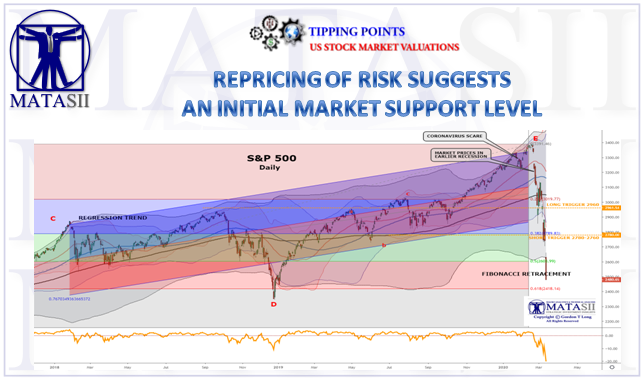
REPRICING OF RISK SUGGESTS AN INITIAL MARKET SUPPORT LEVEL

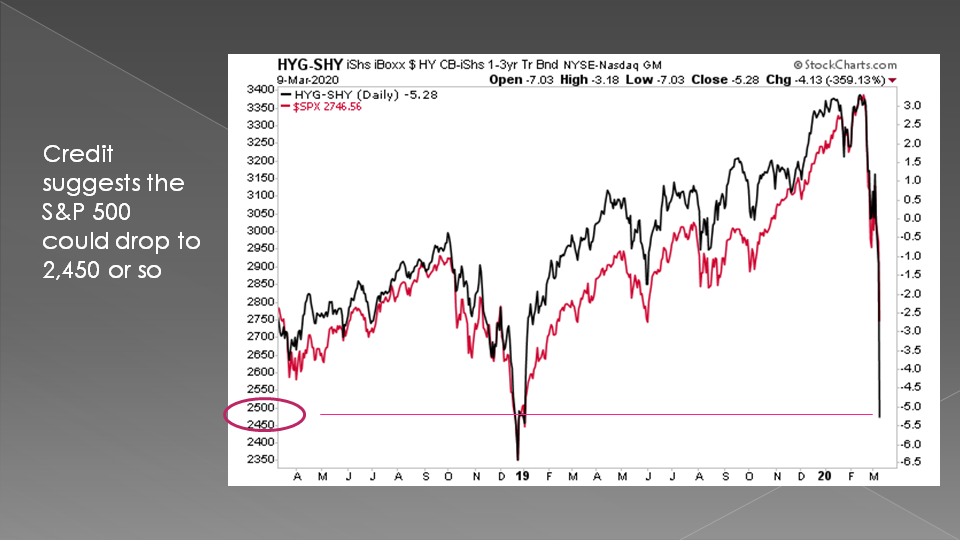
- Protection Costs: Credit Default Swaps
- Risk Pricing: Volatility (VIX)
- Yield - Curve Corporate Spreads
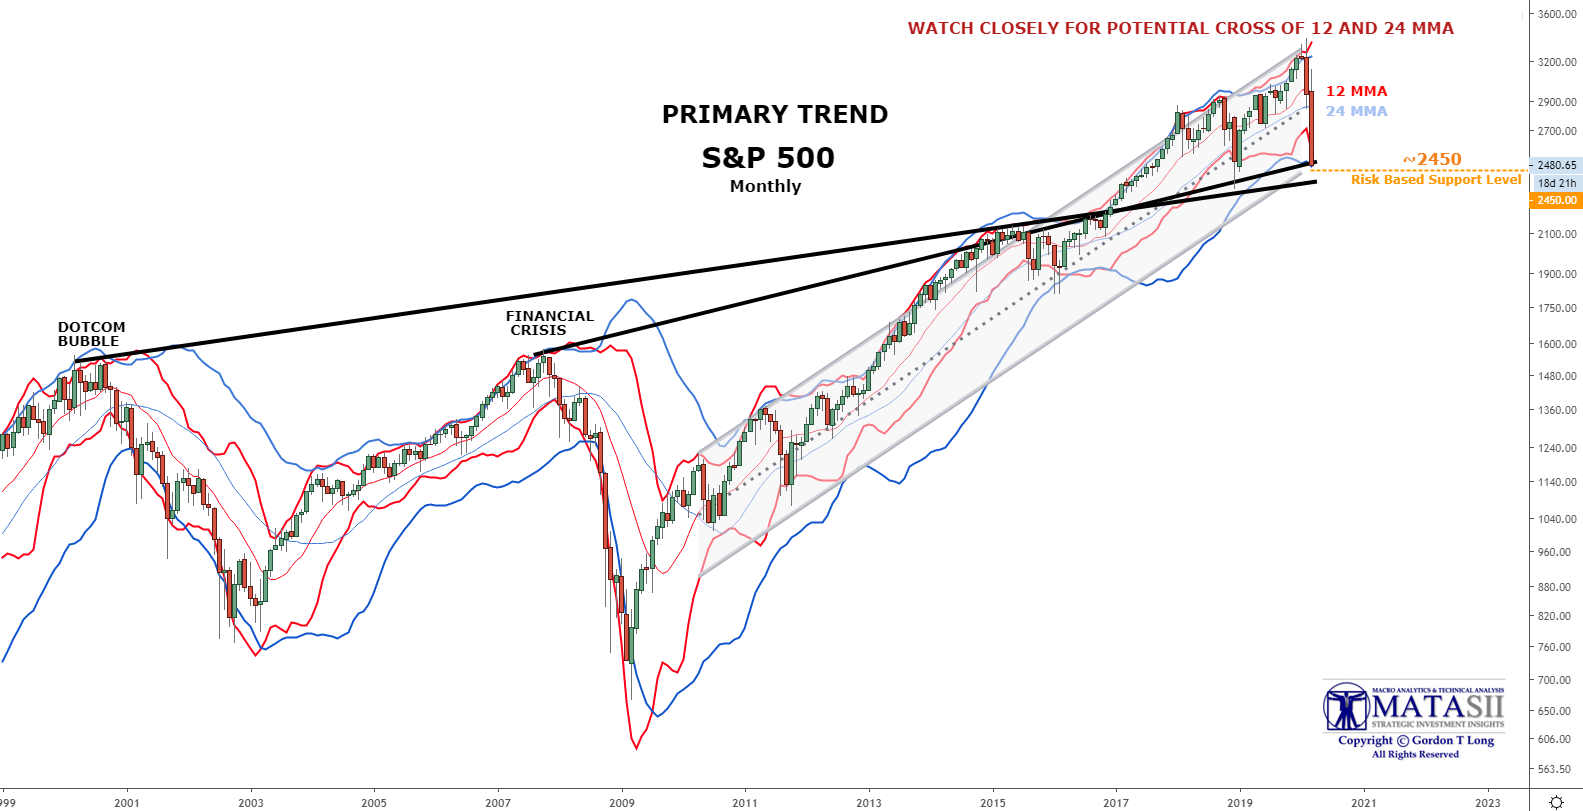
- Support for S&P 500 Primary S&P Monthly Chart Subscriber LINK
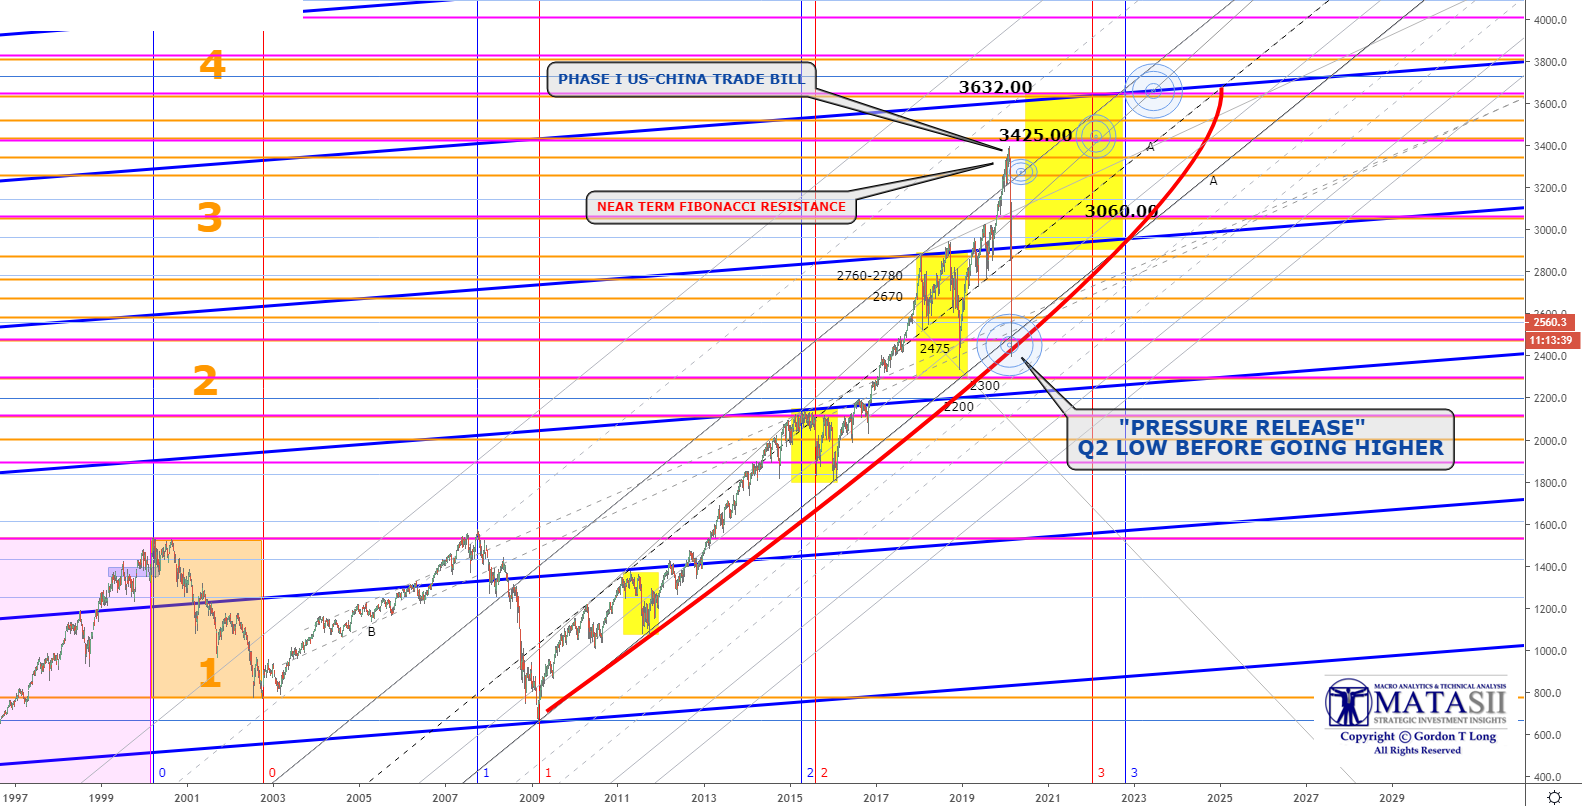
- Long Term S&P 500 Fibonacci's Rising Long Term Projection Subscriber LINK
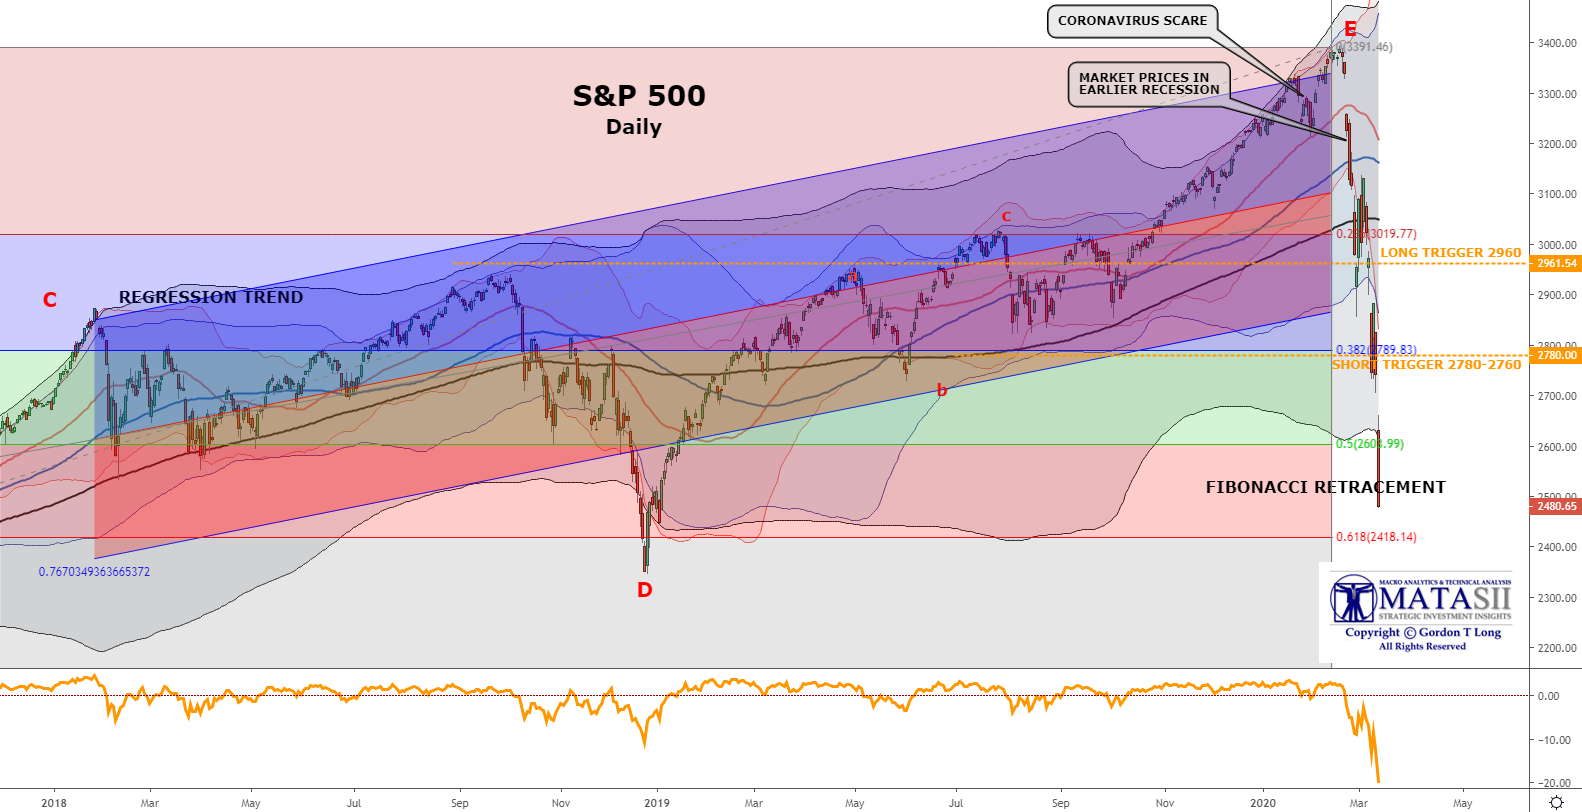
- Short Term Fibonacci Support Level Tertiary S&P 500 Daily Chart Subscriber LINK
SUMMARY
- First Level of Initial Support: S&P 500 ~ 2450
- Credit markets pinpoint this level with an understanding that credit markets are currently quickly deteriorating and becoming volatile as shown by the VIX and MOVE (outlined in video)
- Long Term Support Trends create a "pincer" around the Risk Projections (Chart 2 below)
- The market fall is presently still holding to our Long Term Fibonacci's within our Parabolic Minsky Melt-up Trend (Chart 3 below)
- We are nearing a 61.8% Retracement Level on our Daily S&P 500 "Tertiary Level" charts at ~ 2418 (Chart 4 below)
FAIR USE NOTICE This site contains copyrighted material the use of which has not always been specifically authorized by the copyright owner. We are making such material available in our efforts to advance understanding of environmental, political, human rights, economic, democracy, scientific, and social justice issues, etc. We believe this constitutes a 'fair use' of any such copyrighted material as provided for in section 107 of the US Copyright Law. In accordance with Title 17 U.S.C. Section 107, the material on this site is distributed without profit to those who have expressed a prior interest in receiving the included information for research and educational purposes. If you wish to use copyrighted material from this site for purposes of your own that go beyond 'fair use', you must obtain permission from the copyright owner.
NOTICE Information on these pages contains forward-looking statements that involve risks and uncertainties. Markets and instruments profiled on this page are for informational purposes only and should not in any way come across as a recommendation to buy or sell in these assets. You should do your own thorough research before making any investment decisions. MATASII.com does not in any way guarantee that this information is free from mistakes, errors, or material misstatements. It also does not guarantee that this information is of a timely nature. Investing in Open Markets involves a great deal of risk, including the loss of all or a portion of your investment, as well as emotional distress. All risks, losses and costs associated with investing, including total loss of principal, are your responsibility.