THE HEADLINE: Ride Ford Stock to Big Profits… As a Bear
We have been on the short side of Ford since 2015. Our most recent analysis on April 7th has itself delivered 23.5% gains:
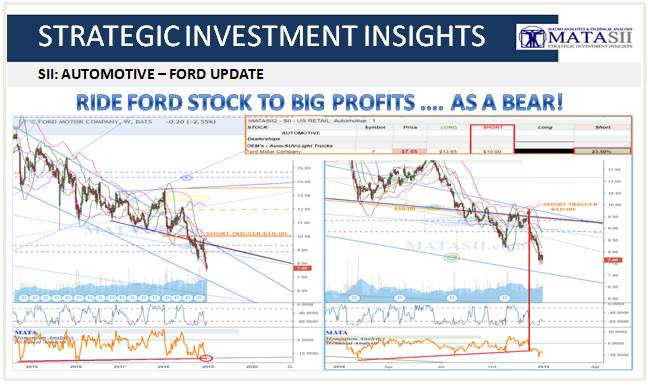
MATASII SII ANALYSIS: APRIL 7th, 2018 CALL: The weekly chart (left) shows Ford steadily falling off since 2014. In the middle of 2017 the market breaks the trend resistance from the drop, starting a new sideways consolidation structure. The pattern appears to be an expanding wedge with the market lifting from the bottom support at the beginning of March this year.
On daily chart (right) we can see a closer look at recent movements: the start of this year has the market drop quickly from $13.50 to $10.25 (-24%), find support at the bottom of the pattern, retest and bounce. The current consolidation had the market break the larger weekly channel from 2014, drop back in, and is now sitting back at the channels s/r.
Overall we are watching the consolidation wedge pattern to see how it continues to develop. The daily chart shows potential opportunities within the pattern: dashed orange highlights significant technicals that if broken could see a move back to one of the wedge patterns bounding s/r's. Otherwise a break up out of the wedge (for a potential reversal of the larger trend), or a drop down through the consolidations supports (possible continuation of larger trend down) are the next significant technical opportunities (highlighted in solid orange).
Initial Chart Supporting Above Analysis:

Ride Ford Stock to Big Profits… As a Bear
Taking Ford (NYSE:F) shares for more than a quick test drive over the past few years has been a less than an enjoyable ride. Now increasingly bearish conditions off and on the price chart point to a well-defined opportunity to ride Ford stock to big profits by shorting shares. Let me explain.
The last several years have seen a historic bull run in the Dow and other averages. It’s also made Ford stock look more like a broken, old clunker, especially compared to the likes of disruptive automotive peer Tesla (NASDAQ:TSLA) and longtime rival General Motors (NYSE:GM).
The fact is the broader market and GM stock have more than doubled in price since late 2011. That period is when equities last made bulls worry that the financial crisis might not be over. Meanwhile, TSLA shares have soared by a meteoric 1,200% to 1,300% over this period.
Then there’s Ford stock.
Being generous in our calculations, shares of F are down about 20%. Ford bulls might point to the company’s dividends during this stretch. However, we’re also keeping the math apples-to-apples for the Dow and GM. And Tesla? I think most of us would be more than happy to have TSLA’s past price performance in our portfolios over counting on Ford’s dividend checks for our returns.
Now, in the midst of a broader market correction, a worsening business environment that needs no introduction, and an in-trouble, canary-like Ford stock dividend of around 7.5%, Ford stock is also looking technically beyond repair and in position for shorting.
Ford Stock Weekly Chart

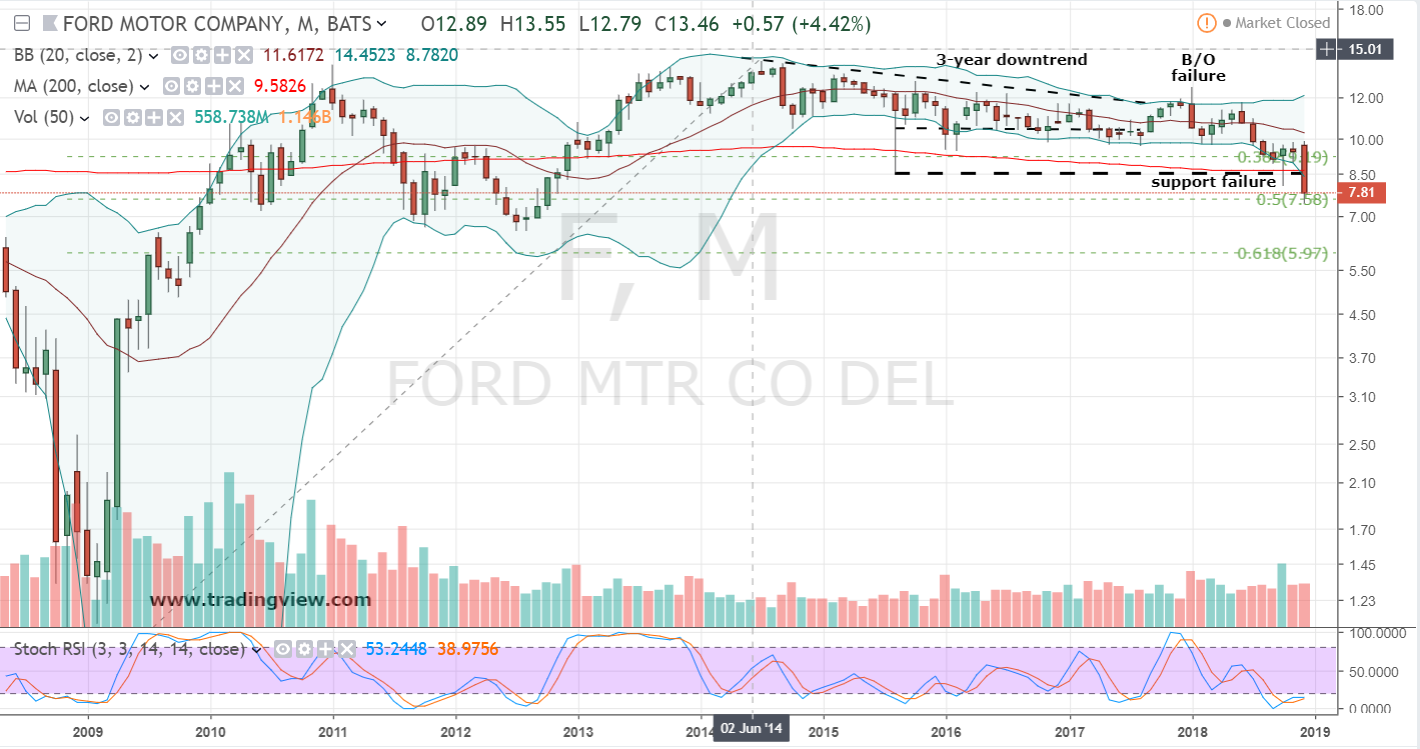
There was a time not so long ago when the case could be made to go long or hold F shares. As recent as last fall, Ford stock did stage a nice-looking breakout above a longer-term dating back to 2014. But the bullish price action proved fleeting.
More recently and at much lower prices, Ford may have offered another reason for technical-oriented traders a reason to go long; albeit at odds with what F’s ‘at-risk’ dividend was warning. As the monthly chart shows, an October monthly hammer which tested 2015’s mini flash crash low was confirmed during November.
Unfortunately, over this past week ‘ho-ho-hope’ on the Ford stock chart turned into very real technical despair. With F breaking below pattern support shares are now prone to continued downside pressure.
I suspect a cut to the dividend — which could happen before or following late January’s earnings report — would swiftly knock Ford stock down to a test of the 2012 bottom and then continue without much hesitation to a test of the 62% retracement level from the 2009 low.
A decline in Ford stock of this magnitude amounts to a drop in share price of around 35%. That’s a lot to be sure. But given today’s less-healthy investing climate it’s also increasingly likely that won’t be the worst of it for F shares in 2019.
Ford Stock Trade
For traders that agree Ford stock looks poised for aggressively lower prices, shorting shares at current levels makes sense. Bottom or squiggly price line, technical support has just been broken and F doesn’t appear so oversold as to warrant waiting for a pullback entry.
For risk management I’d keep a stop-loss to 80 cents or roughly 10% of F shares. This keeps potential losses small while allowing for a decent risk-to-reward ratio. This stop also has the added technical benefit of exiting the position if Ford stock reverses back above the 2015 low — and sufficient evidence in our estimation to close any bearish shorts.
Disclosure: Investment accounts under Christopher Tyler’s management do not currently own positions in any securities mentioned in this article. The information offered is based upon Christopher Tyler’s observations and strictly intended for educational purposes only; the use of which is the responsibility of the individual. For additional options-based strategies and related musings, follow Chris on Twitter @Options_CAT and StockTwits.


