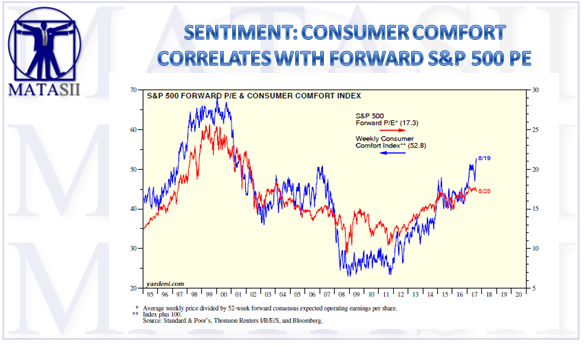
SENTIMENT: CONSUMER COMFORT CORRELATES WITH FORWARD S&P 500 PE

The stock market has been like the Starship Enterprise on “Star Trek.” It continues to “boldly go where no man [or woman] has gone before.” The S&P 500 has been setting new record highs with only two significant corrections since March 28, 2013, when it was 1569.19. It is up 58.5% since the prior bull market record high as of the most recent record high of 2480.91 set on August 7.In other words, it has been 1,594 days in outer space. During the previous bull market of the 2000s, it was in outer space (i.e., exceeded the previous bull market record high) for only 133 days. Granted, the air is thin in outer space, as measured by various valuation gauges. However, there’s no gravitational pull either, so the Starship S&P 500 can continue to fly as long as it doesn’t run out of rocket fuel. The fundamental gauges for the S&P 500 that I watch show plenty of solid rocket fuel:
(1) The Fundamental Stock Market Indicator (FSMI) rose to a new record high during the week of August 19. It has been very highly correlated with the S&P 500 since 2000.
The FSMI isn’t a leading index of the S&P 500. Nothing leads the S&P 500, since it is a leading indicator itself, and is one of the 10 components of the Conference Board’s Index of Leading Economic Indicators. My indicator simply confirms or raises doubts about the underlying trend in the stock market. Its new high certainly confirms that the bullish trend in stocks remains intact.
The FSMI comprises just three components that reflect the underlying strength or weakness in the domestic and global economies. It is the average of the Consumer Comfort Index (which is a four-week average) and the four-week average of the Boom-Bust Barometer, which is the CRB raw industrials spot price index (weekly average) divided by weekly initial unemployment claims.
(2) The CRB raw industrials spot price index is up 30% since it bottomed late in 2015. It had stalled during late 2016 through the first half of 2017, but has been advancing again in recent weeks. One of its 13 components is the price of copper, which has gone vertical in recent days.
(3) The Boom-Bust Barometer (BBB) is simply the ratio of the CRB raw industrials spot price index divided by initial unemployment claims. To smooth it out, I track the four-week moving average, which is extremely procyclical. The BBB has taken off like a rocket ship since late 2015 and has been in record-high territory this summer.
It is also highly correlated with the S&P 500 since 2000. That’s not surprising since it is highly correlated with another very procyclical indicator, namely S&P 500 forward earnings.
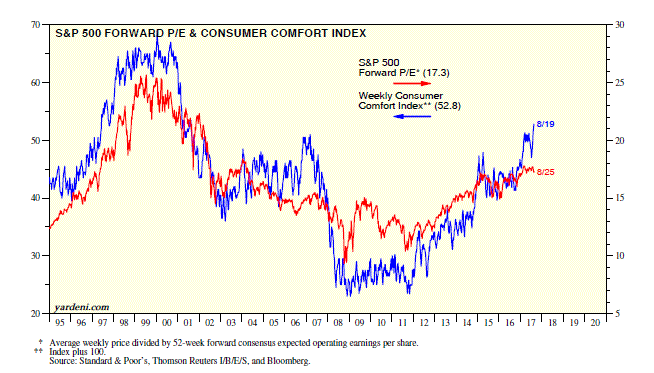
(4) Consumer confidence is the third component of the FSMI, which averages the Weekly Consumer Comfort Index (WCCI) and the BBB. While the BBB is highly correlated with the S&P 500, the FSMI better tracks the stock index. That’s because the BBB is highly correlated with forward earnings and the WCCI is highly correlated with the S&P 500 forward P/E. The WCCI has recovered sharply since late 2011, and so has the P/E.