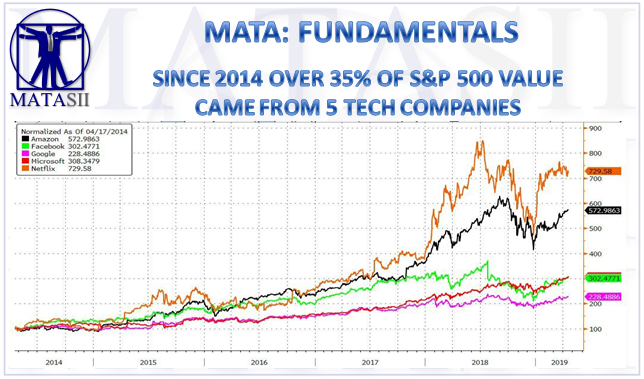
SINCE 2014 OVER 35% OF S&P 500 VALUE CAME FROM 5 TECH COMPANIES
The US stock market, or at least the S&P 500, is inextricably tied to the present and future of disruptive technology.
- Disruption at global scale can add as much market value as a much larger but old-school business even if the latter is very well-run.
- Over a third of the S&P’s 44% value accretion in the last 5 years comes down to a handful of now-super cap tech disruptors. Without them, the S&P’s total value would only have compounded annually at 5.0% instead of 7.6%.
- What will be the source of the S&P’s value creation over the next 5 years (i.e. where is the next $3-5 trillion of market cap coming from)? Here’s how we handicap the odds: 65% chance it will be these same companies. They have the scale and scope to develop the next wave of disruptive technologies and get them to market.
Six companies represent 37% of all the S&P 500’s value creation over the last 5 years:
- Amazon (10.1%),
- Apple (6.5%),
- Facebook (4.7%),
- Google (6.4%),
- Microsoft (7.8%), and
- Netflix (1.8%).
US equity valuations reflect present and future Tech disruption.
Below is the analysis by Nicholas Colas of DataTrek:
Amazon is responsible for 6.7% of the S&P 500’s market value gain since November 2005. Amazon was added to the index in the that month, and since then:
- The value of the companies in the S&P 500 has risen by $13,161 billion.
- Amazon’s market cap has increased by $886 billion
- Divide the two figures and you get 6.7%
That got us to thinking: how much have large Tech companies influenced the S&P 500 over just the last 5 years? Here are a few baseline numbers to start the analysis:
- At the end of March 2014, the S&P 500 had a total value of $17,206,453 million.
- At the end of March 2019, it was $24,760,982 million
- The difference: $7,554.5 billion, or 43.9% higher
- One technical note: the S&P 500 is +51.3% over this period with the difference due to stock buybacks.
So how much of that $7.6 trillion comes from Apple, Amazon, Facebook, Google, Microsoft and Netflix? Here are the numbers:
Amazon: 10.1% of the market’s value gain over the last 5 years:
- Market cap Q1 2014: $157.4 billion
- Market cap now: $917.6 billion
- Difference: $760.2 billion
Apple: 6.5% of the market’s gains over the last 5 years:
- Market cap Q1 2014: $472.1 billion
- Market cap now: $963.9 billion
- Difference: $491.8 billion
Facebook: 4.7% of the market’s gains over the past 5 years:
- Market cap Q1 2014: $157.2 billion
- Market cap now: $510.5 billion
- Difference: $353.3 billion
Google: 6.4% of the market’s gains over the last 5 years:
- Market cap Q1 2014: $375.6 billion
- Market cap now: $859.5 billion
- Difference: $483.9 billion
Microsoft: 7.8% of the market’s gains over the last 5 years:
- Market cap Q1 2014: $343.0 billion
- Market cap now: $934.2 billion
- Difference: $591.2 billion
Netflix: 1.8% of the market’s total gains over the last 5 years:
- Market cap Q1 2014: $21.6 billion
- Market cap now: $154.9 billion
- Difference: $133.3 billion
Pulling all this into 3 summary points:
#1: Netflix may not seem all that impressive at “just” $133 billion of added market cap, but that’s essentially what JP Morgan added to the S&P 500 over the same period. JPM’s market cap has increased by $139.1 billion in the last 5 years.
Conclusion: disruption at global scale can add as much market value as a much larger but old-school business even if the latter is very well-run.
#2: In aggregate, these 6 companies are responsible for 37.3% of all the S&P’s incremental value creation over the last 5 years. Take out Netflix, and the remaining 5 are still 35.5%.
Conclusion: over a third of the S&P’s 44% value accretion in the last 5 years comes down to a handful of now-super cap tech disruptors. Without them, the S&P’s total value would only have compounded annually at 5.0% instead of 7.6%.
#3: The right question out of this analysis: what will be the source of the S&P’s value creation over the next 5 years (i.e. where is the next $3-5 trillion of market cap coming from)? Here’s how we handicap the odds:
- 65% chance it will be these same companies. They have the scale and scope to develop the next wave of disruptive technologies and get them to market.
- 30% chance it will be either new businesses (such as the raft of IPOs currently in the pipeline) or already public Tech companies with a break-through technology or platform. This is why investors are looking so hard at Uber, for example.
- 5% chance it will come from a strategic shift in non-Tech companies to incorporate disruptive business models at scale. The challenge here is the Innovator’s Dilemma – established businesses rarely burn their boats and strike off into the wilderness.
Final thought: remember that we only highlighted 6 disruptive Tech companies here and still got to 37% of all the value creation for US stocks over the last half decade. Add another dozen or two and we suspect we could get to well north of 50%. The US stock market, or at least the S&P 500, is inextricably tied to the present and future of disruptive technology. We don’t see that changing.

[SITE INDEX -- MATA - FUNDAMENTALS ]
READERS REFERENCE (SUBSCRIBERS-RESEARCH & PUBLIC ACCESS )
MATA: FUNDAMENTALS
MATASII RESEARCH ANALYSIS & SYNTHESIS WAS SOURCED FROM:
SOURCE: 04-18-19 - Nicholas Colas of DataTrek - "Five Companies Represent 35% Of All The S&P 500’s Value Creation Over The Last 5 Years"
FAIR USE NOTICEThis site contains copyrighted material the use of which has not always been specifically authorized by the copyright owner. We are making such material available in our efforts to advance understanding of environmental, political, human rights, economic, democracy, scientific, and social justice issues, etc. We believe this constitutes a 'fair use' of any such copyrighted material as provided for in section 107 of the US Copyright Law. In accordance with Title 17 U.S.C. Section 107, the material on this site is distributed without profit to those who have expressed a prior interest in receiving the included information for research and educational purposes. If you wish to use copyrighted material from this site for purposes of your own that go beyond 'fair use', you must obtain permission from the copyright owner.
NOTICE Information on these pages contains forward-looking statements that involve risks and uncertainties. Markets and instruments profiled on this page are for informational purposes only and should not in any way come across as a recommendation to buy or sell in these assets. You should do your own thorough research before making any investment decisions. MATASII.com does not in any way guarantee that this information is free from mistakes, errors, or material misstatements. It also does not guarantee that this information is of a timely nature. Investing in Open Markets involves a great deal of risk, including the loss of all or a portion of your investment, as well as emotional distress. All risks, losses and costs associated with investing, including total loss of principal, are your responsibility.