Gordon T Long

Gordon T Long

Global Macro Research | Macro-Technical Analysis 

TIPPING POINTS

RISK REVERSAL


SMART MONEY IS NOW (VERY) NERVOUS!

What the smart money understands is that when the central banks start to slow or begins to drain monetary liquidity, the clock starts ticking towards a major corrective cycle. 
 
Last week the Fed made it clear at the end of its FOMC Meeting on September 22nd that the Federal Reserve is likely to begin Tapering Quantitative Easing in either November or December. It also indicated that it’s likely to bring QE to anend by the middle of next year.
 
Combine this with what we have been witnessing with the wholesale and rapid withdrawal of central bank stimulus globally it is clear what lies ahead:
    • Last week the ECB was the second giant to Taper bond purchases.
    • Bank of Japan has already ended QE.
    • Bank of Canada shed 15% of its assets.
    • Bank of England & Reserve Bank of Australia are tapering.
    • Reserve Bank of New Zealand quit QE cold turkey.
    • Riksbank will end QE this year.
With the Federal Reserve starting to “taper” its asset purchases it should now be expected to witness increased market volatility. That is now occurring!
 
THE FIRST SIGNS OF TECHNICAL DAMAGE
 
A BREAK OF THE 50 DMA
 
The 50 DMA has acted as major support throughout much of 2021. The fact we broke below it is significant.
 
If the S&P 500 cannot reclaim this level and stay there… then stocks are in MAJOR trouble.
 
WATCH THE MONTHLY CHARTS FOR A SECOND MONTHLY CLOSE LOWER
 
On a monthly basis, the S&P 500 is EXTREMELY overstretched to the upside. At a minimum, you would expect a drop to the 12-month moving average (MMA) to occur sometime this year.
 
This would mean a 10% drop in stock prices.
 
You see in the chart below, every drop to the 12-MMA started with a significant black candle.
 
We have this week left in September, but it looks like we could be getting our first black candle of the year!


MARKETS ARE REACTING TO FED & US TREASURY GUIDANCE
 
In our August 30th Newsletter entitled “LIQUIDITY TIGHTENING IS ACCELERATING!” (https://conta.cc/3kIwwHq) we outlined three central concerns we had with short term US liquidity (chart to the right):
 
1- REVERSE REPOS REDUCING TOTAL BANK
DEPOSITS
2- INCREASING TREASURY SUPPLY
3- TAPER TALK MAKING BUYERS HESITANT
 
My colleague Richard Duncan has just released his latest Macro Watch video where he gives us his perspective on what the Federal Reserve and US Treasury are signaling.
 
I strongly recommend you subscribe to Richard’s Macro Watch service. You can do this at LINK. Enter the Promo Code “FLOWS” to receive a special 55% discount for being a follower of my work.
 
Richard is currently reporting:


There are four drivers that create a contraction:
1. Repayment within Discount Operations window (this seems remote),
2. Currency in Circulation is increased. This is likely but not a major concern as shown by the green line but not seen as a major concern – at least yet,
3. Treasury Deposits at the Fed increase – this is also not a major concern,
4. Reverse Repo levels increase. This is a major concern since they have already spiked to $1T and many are calling for a doubling from this level!
 
ADDITIONALLY:
·Bank Reserve Liquidity will fall if QE Tapering were to begin
·Overall market Liquidity will fall if the Treasury’s Debt Ceiling is not suspended again because Treasury Spending will be crimped.
·Bank Reserve Balances will not grow if ongoing Treasury Supply is not issued or rolled over.
 
THE FEDERAL RESERVE ANNOUNCEMENT
 
    • At the end of its FOMC Meeting on Wednesday (September 22nd) the Fed let it be known that it’s likely to begin Tapering Quantitative Easing in either November or December.
    • It also indicated that it’s likely to bring QE to an end by the middle of next year.
That would be a more aggressive Taper scenario than when the Fed Tapered in 2014 and a more aggressive scenario than the markets had expected until very recently.
 
SCENARIO 1: If the Fed begins Tapering in November, and Tapers by $15 billion per month, it would create $540 billion between now and the time QE ends in May.
SCENARIO 2: If the Fed begins Tapering in December, and Tapers by $15 billion per month, it would create $660 billion between now and the time QE ends in June
 
Total Liquidity in the financial markets would increase by either $540 billion or by $660 billion between now and mid-2022. That would be quite a lot of new Liquidity and would probably by itself continue to support asset price appreciation.
 
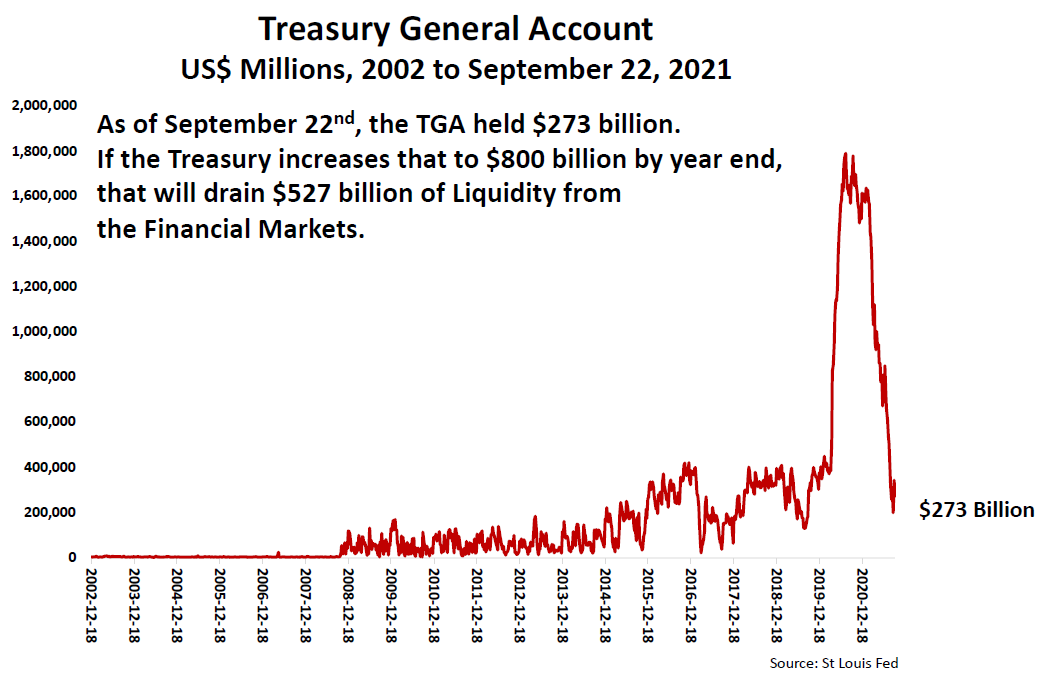
THE LIQUIDITY KILLER: The Treasury General Account (TGA)
 
The Treasury Department has announced that it plans to have $800 billion in its account at the Fed (the Treasury General Account or TGA) at the end of this year.
 
“During the October – December 2021 quarter, Treasury expects to borrow $703 billion in privately-held net marketable debt, assuming an end-of-December cash balance of $800 billion.”
 
 
The TGA May Absorb More Than The Fed Creates
 
Richard Duncan concludes:
 
  1. That would be equivalent to 98% of the Liquidity created by the Fed in Scenario 1, and 87% of the Liquidity created by the Fed in Scenario 2.
  2. Not only that, but during the fourth quarter of this year, the $527 billion build-up in the TGA would drain even more Liquidity than the Fed creates (which would be $315 billion over the next three months in Scenario 1 or $345 billion in Scenario 2).
  3. Therefore, Bank Reserves and Liquidity could actually contract during the next quarter.
 
CONCLUSION
 
The combination of an aggressive Taper, which now appears to be in the cards, and the build-up in the Treasury’s cash balance at the Fed (in the TGA), strongly suggests that the Liquidity Tsunami that has driven asset prices so much higher over the last 18 months is about to come to an abrupt end.
 
 
“Once the Fed begins to hike rates or yield curves start to invert, the time to become much more defensive will become evident. However, such could all change quickly with the introduction of an exogenous event. In the meantime, remain invested but don’t be lulled into complacency. Changes in markets always happen slowly, then all at once.”
 

FOLLOWING DETAILED ANALYSIS IS SUBSCRIBER CONTENT ONLY

Subscribe to view full post content with supporting live charts
 

FAIR USE NOTICE  This site contains copyrighted material the use of which has not always been specifically authorized by the copyright owner. We are making such material available in our efforts to advance understanding of environmental, political, human rights, economic, democracy, scientific, and social justice issues, etc. We believe this constitutes a ‘fair use’ of any such copyrighted material as provided for in section 107 of the US Copyright Law. In accordance with Title 17 U.S.C. Section 107, the material on this site is distributed without profit to those who have expressed a prior interest in receiving the included information for research and educational purposes.  If you wish to use copyrighted material from this site for purposes of your own that go beyond ‘fair use’, you must obtain permission from the copyright owner.


NOTICE  Information on these pages contains forward-looking statements that involve risks and uncertainties. Markets and instruments profiled on this page are for informational purposes only and should not in any way come across as a recommendation to buy or sell in these assets. You should do your own thorough research before making any investment decisions. MATASII.com does not in any way guarantee that this information is free from mistakes, errors, or material misstatements. It also does not guarantee that this information is of a timely nature. Investing in Open Markets involves a great deal of risk, including the loss of all or a portion of your investment, as well as emotional distress. All risks, losses and costs associated with investing, including total loss of principal, are your responsibility.