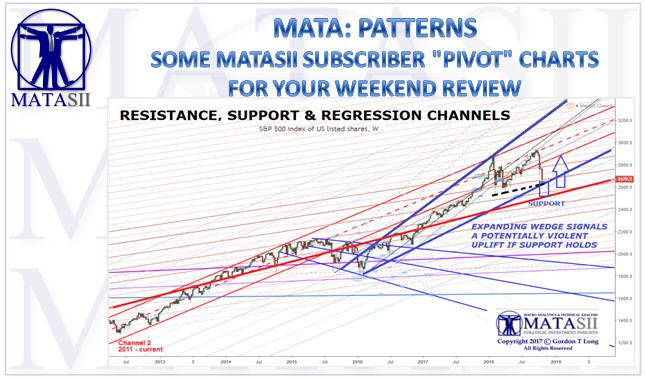
SOME MATASII SUBSCRIBER "PIVOT" CHARTS FOR YOUR WEEKEND REVIEW
(These Charts can be found within the MATA: PIVOTS section on your MATASII Subscriber site).
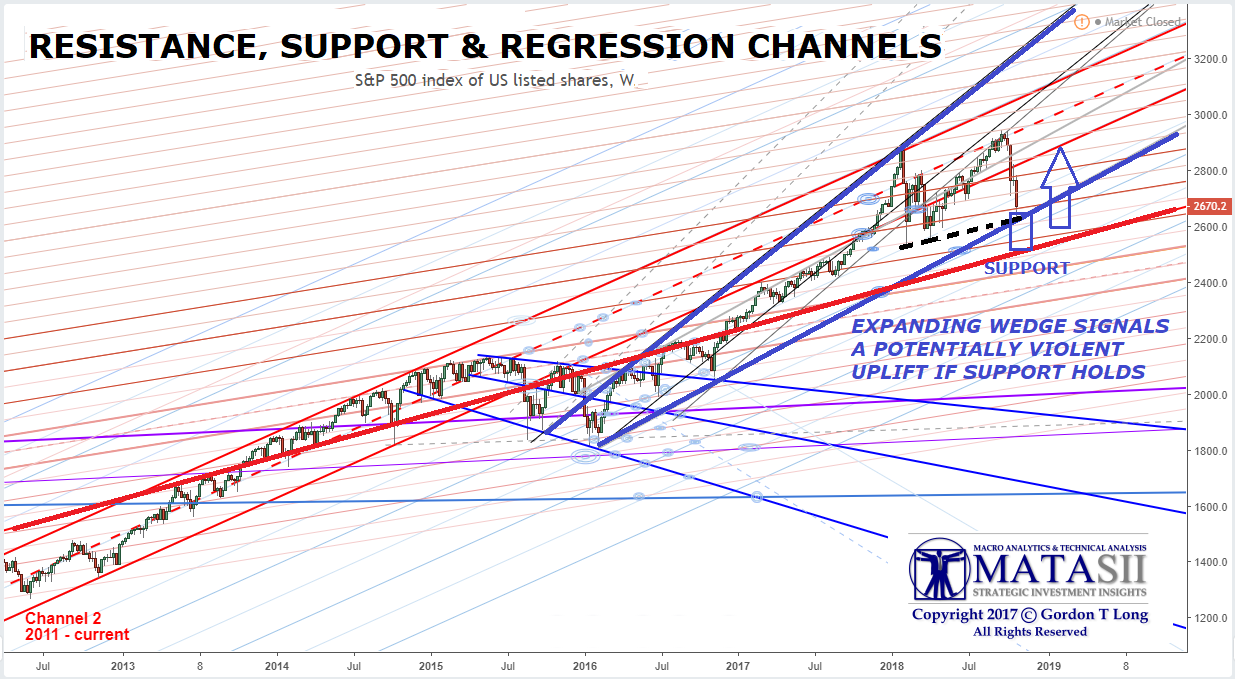
INTERMEDIATE LEVEL S&P 500 SUPPORT CHARTS
We published this chart in last months MATA Report (Pivots: Resistance, Support & Regression Channels) on where we felt support would soon be found and tested.

Here is that same chart updated as of the close Friday 10-26-18.
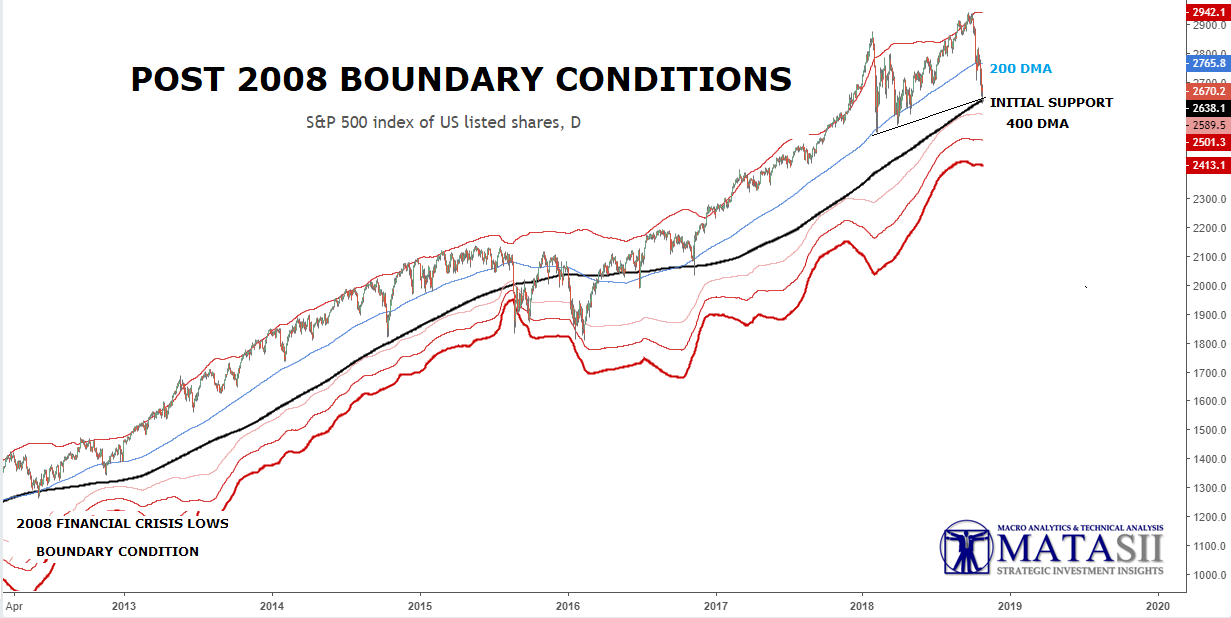
Our 2008 Financial Boundary Conditions Chart has now touched the controlling 400 DMA. The associated Bollinger Bands are now in play.
THE MATASII SHORT TERM TRACKING CHART SUGGEST MINIMALLY A NEAR TERM CONSOLIDATION
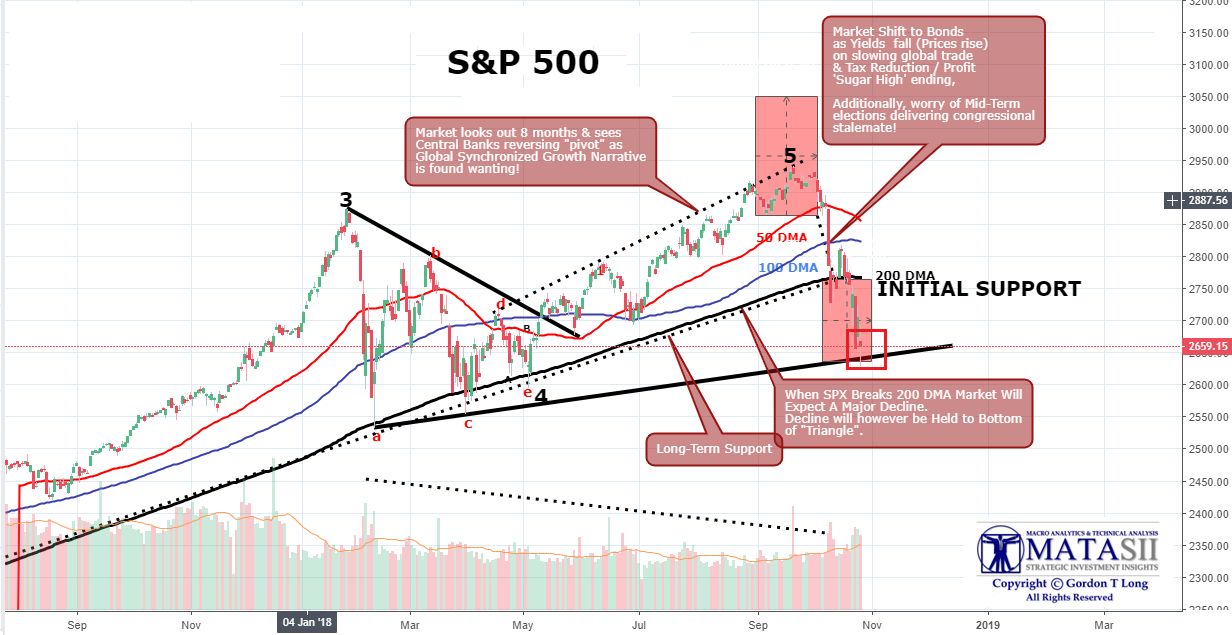
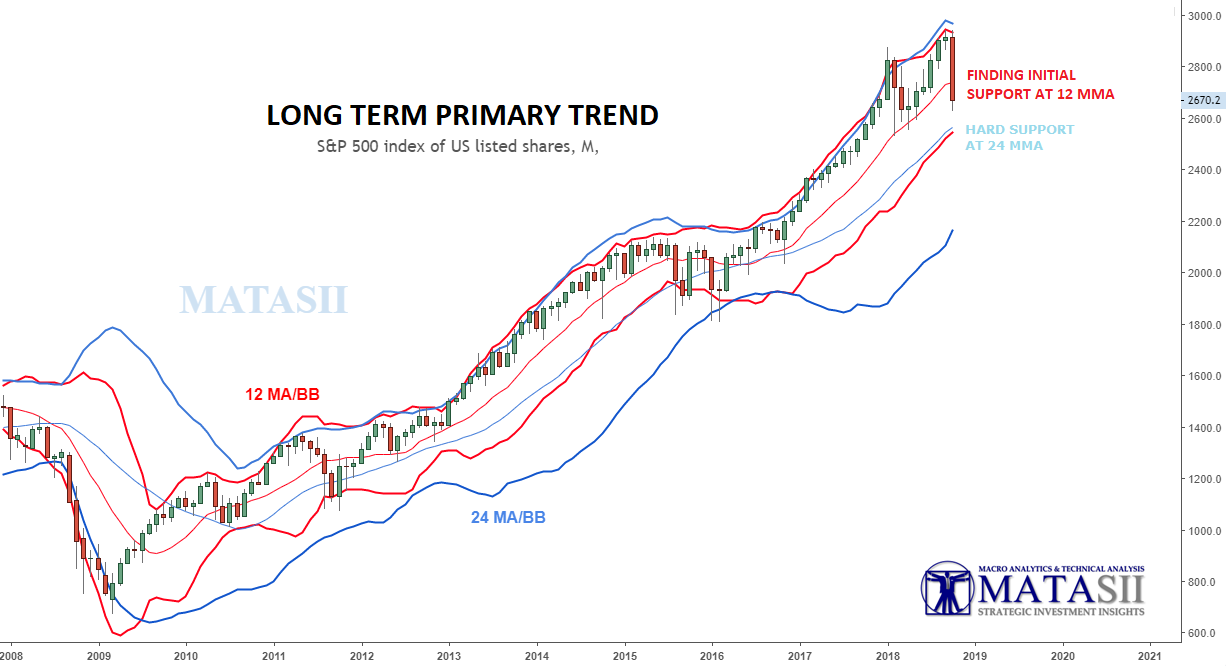
MATASII LONGER TERM PIVOTS TO CONSIDER
The 24 MMA will offer firm support for a potential oversold and overly "panic" driven market.
This week’s sell-off caused the S&P 500 to break below its uptrend line that began in early-2016. We could see technical support and price target in the 2,550 to 2,600 support zones that formed at the lows earlier this year.

OTHER INDICES YOU MAY BE WATCHING
Unlike the S&P 500, the Dow Jones Industrial Average still has not broken below its key uptrend line. If the Dow closes below this uptrend line in a convincing manner on the weekly chart (possibly next week if the sell-off continues), the next important support level and price target to watch is the 23,250 to 23,500 zone that formed in early-2018.

The Nasdaq Composite index closed below its uptrend line that began in early-2016. The index would need to close back above this trend-line to negate the bearish technical signal. If the sell-off continues, the next price target to watch is the 6,600 to 6,800 support zone that formed earlier this year.

The small cap Russell 2000 index broke below its uptrend line two weeks ago and tested the 1,475 support level this week. If the index breaks below the 1,425 to 1,475 support zone, it would give yet another bearish signal.
