THE HEADLINE: S&P, Nasdaq Slump Into Red As MSFT Plunges Below Key Technical Support
MATASII SII ANALYSIS: August 2nd, 2018: MSFT Microsoft Corporation IDEA MSFT has been in a positive trend since 2008; at the start of 2017 the trend increased in velocity, breaking from trend channels (weekly chart, left). The lift continued to increase in velocity, and although I have placed parallel s/r's identifying significant supports and resistances (looks like 3 blue channels), the lift is actually curved. This implies that until we see a significant pull back, the "steepness" or velocity of the trend may continue to increase, eventually going "parabolic".
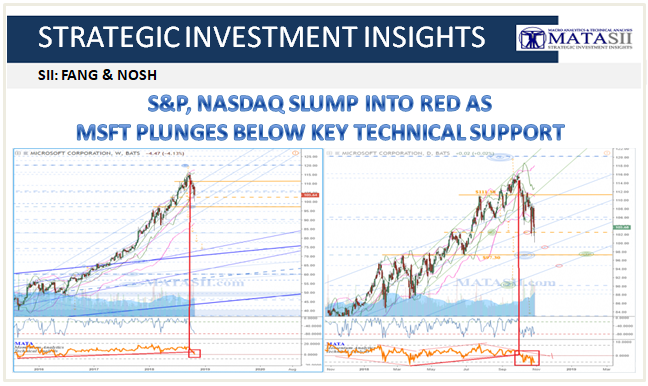
IF we see the lift continue, lifting past recent highs offers a trigger consideration, where we can then look to the next Fibonacci extensions for target levels. Solid orange highlights the trigger level consideration at $111.30.
IF MSFT finds resistance and starts to fall off, a solid orange trigger consideration highlights the last significant s/r level ($97.30). Breaking under this would also move the market out of the green channel (daily chart, right) that it has been lifting in since May of this year (2018); as well as below the top of the 3 blue channels identifying support / resistance (s/r). A dashed orange line offers a more aggressive trigger consideration (ie. more risk): breaking under this could be the start of a drop off, however we need to watch for potential bounces at the next significant s/r's that could continue the current positive trend.
S&P and Nasdaq have given up the early bounce gains...

As MSFT tumbles below its 200DMA...

And all the FANGs slump...

GE also fell back below a $10 handle...
