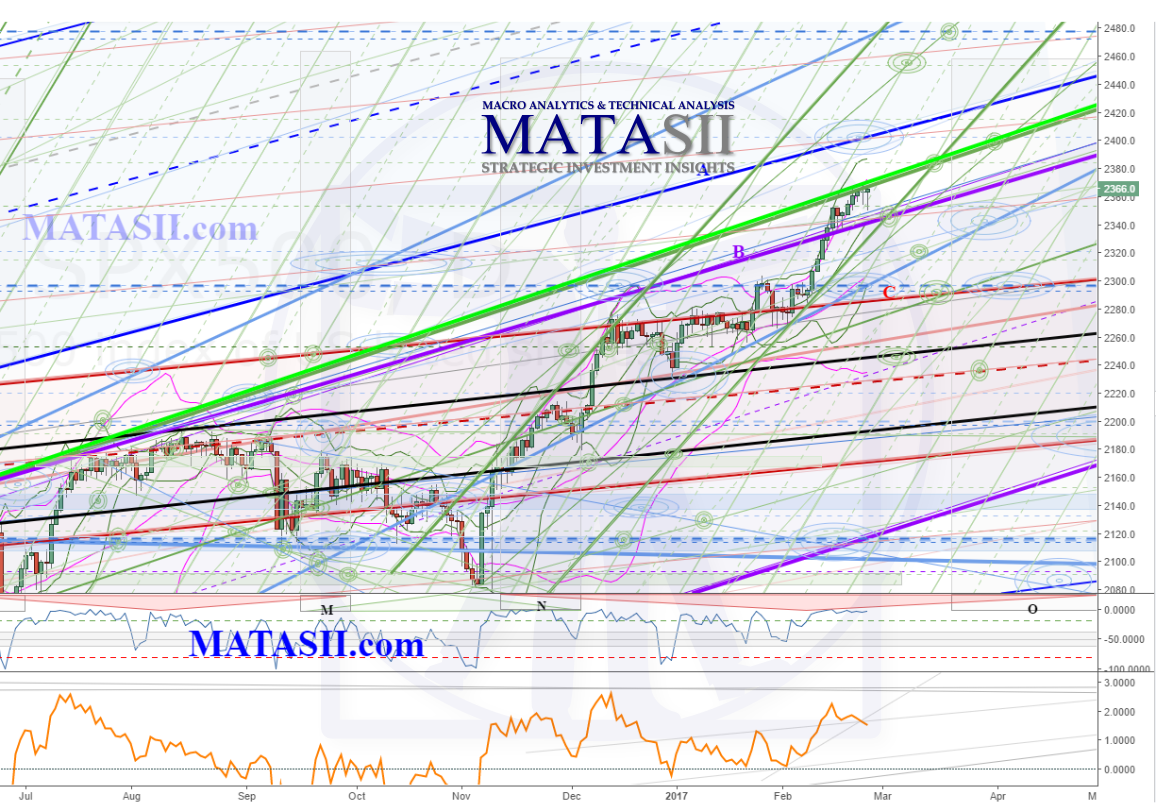
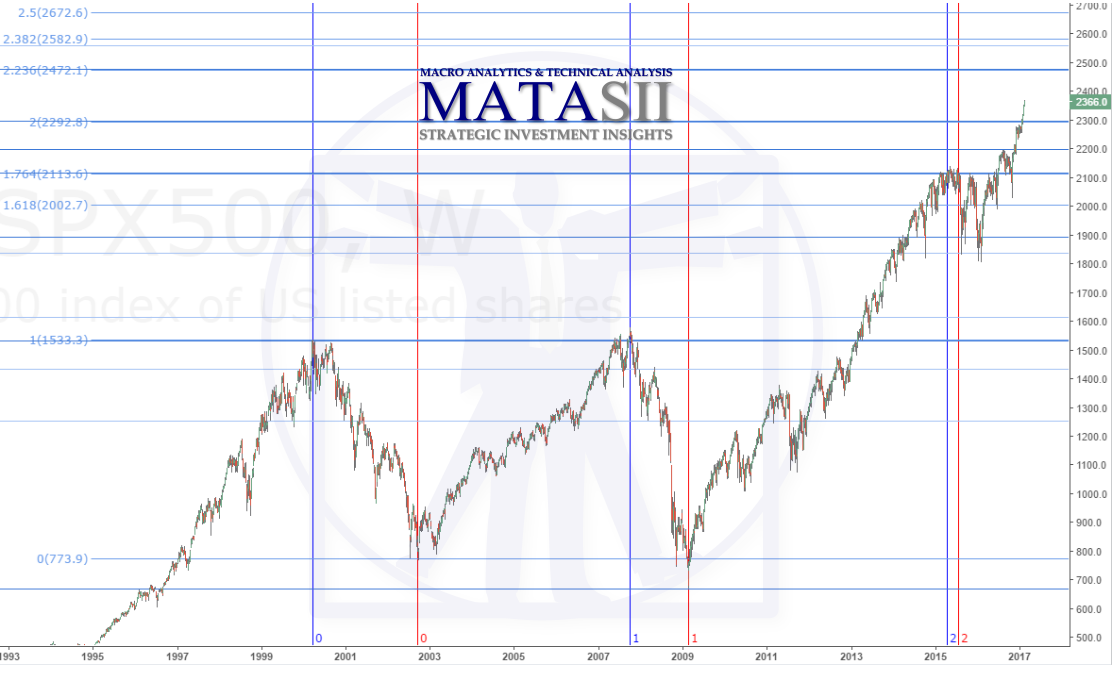
Last update we were looking for a lift to 2300 for the SPX, where we were watching for potential resistance. This was based on Fibonacci extensions, and we can see the market has followed them well. Resistance did occur and the market held at the 2300 level for 2 weeks before finally breaking through. The next levels suggested by the Fibonacci extensions are around 2475.
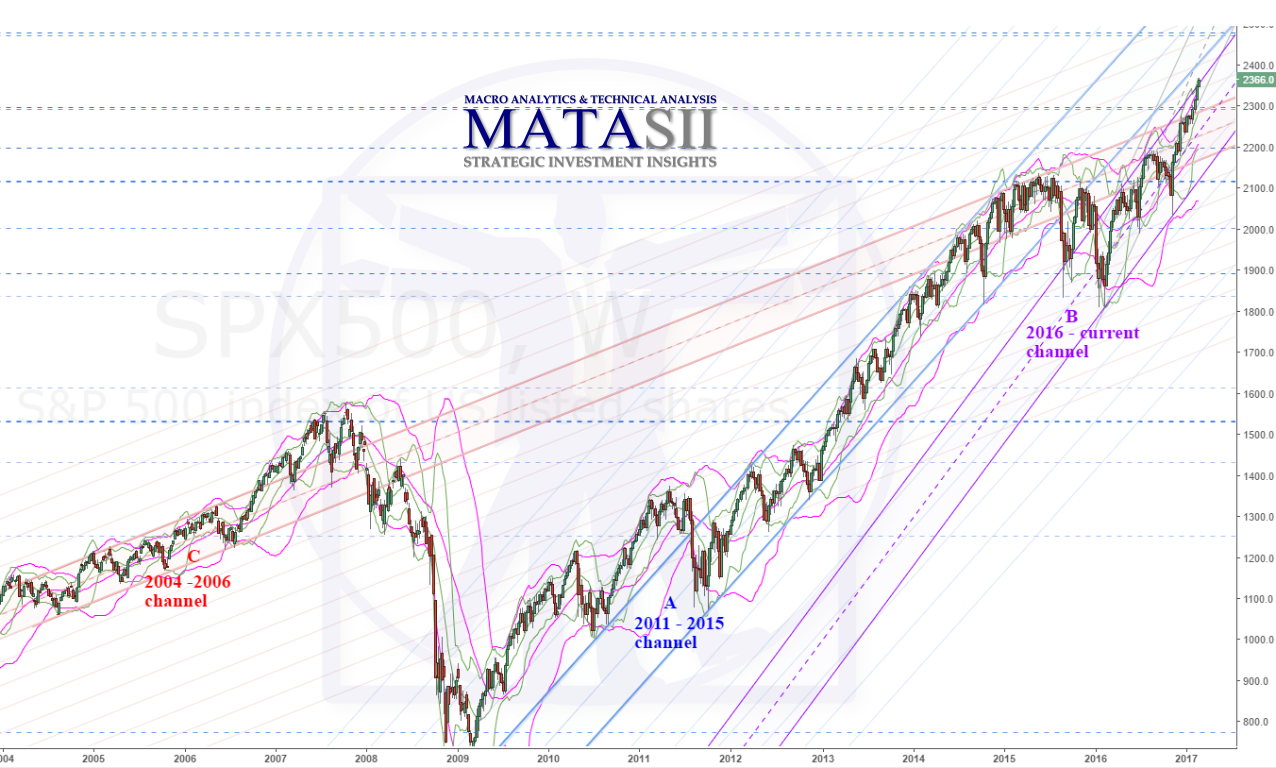
Last update we discussed the Fibonacci extensions and how they were derived. This update we are going to take a look at some significant channels and what they can tell us.
The first chart shows a long term view of the markets (weekly). The channels we want to consider are Channel A (blue) from 2011-2015; Channel B (purple) from the most recent lift in 2016; and Channel C (red) from 2004 -2006.
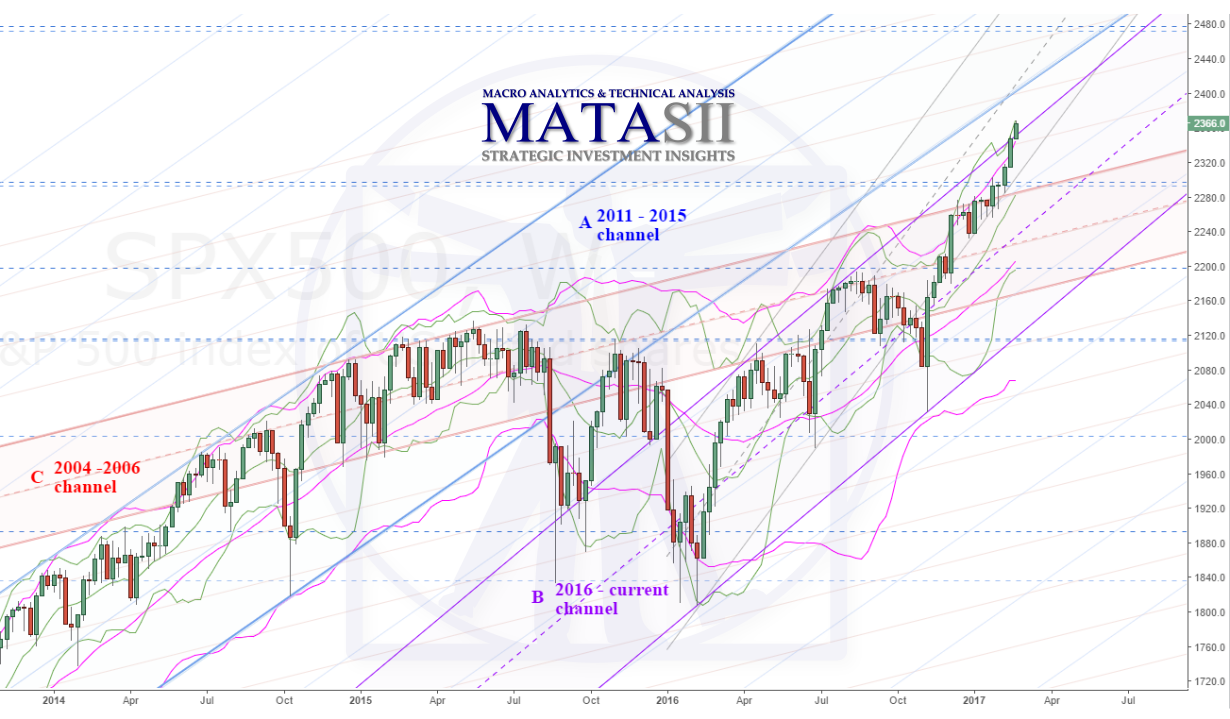
The next chart below is a closer view of the chart above. The last 3 weekly bars are almost straight up; while this could continue we would expect to see a pause at some point, the channels offer us places to consider. The market is through one BB and touching the other - suggests we could see a consolidation or fall off from the BB's from here. The market has also just pushed through the top of channel B resistance: a slight throw-over and drop back down in to the channel would not be out of the ordinary. IF the market does pull back from here, we can see several technicals just below that may offer support, including a retest of channel C. Technically the market could pull back and touch the supports of channels C & B and still be in a positive trend. Falling back in to channel C would be a waning sign that the market may be turning. Breaking down under channel C would give us cause to consider a market " top" may be under way.
IF the market continues to lift we are watching for a retest of channel A's support, and then to see if it moves back in to channel A or not. At the top of the chart you can see the next Fibonacci extension levels (around 2475) that we are also keeping an eye on.
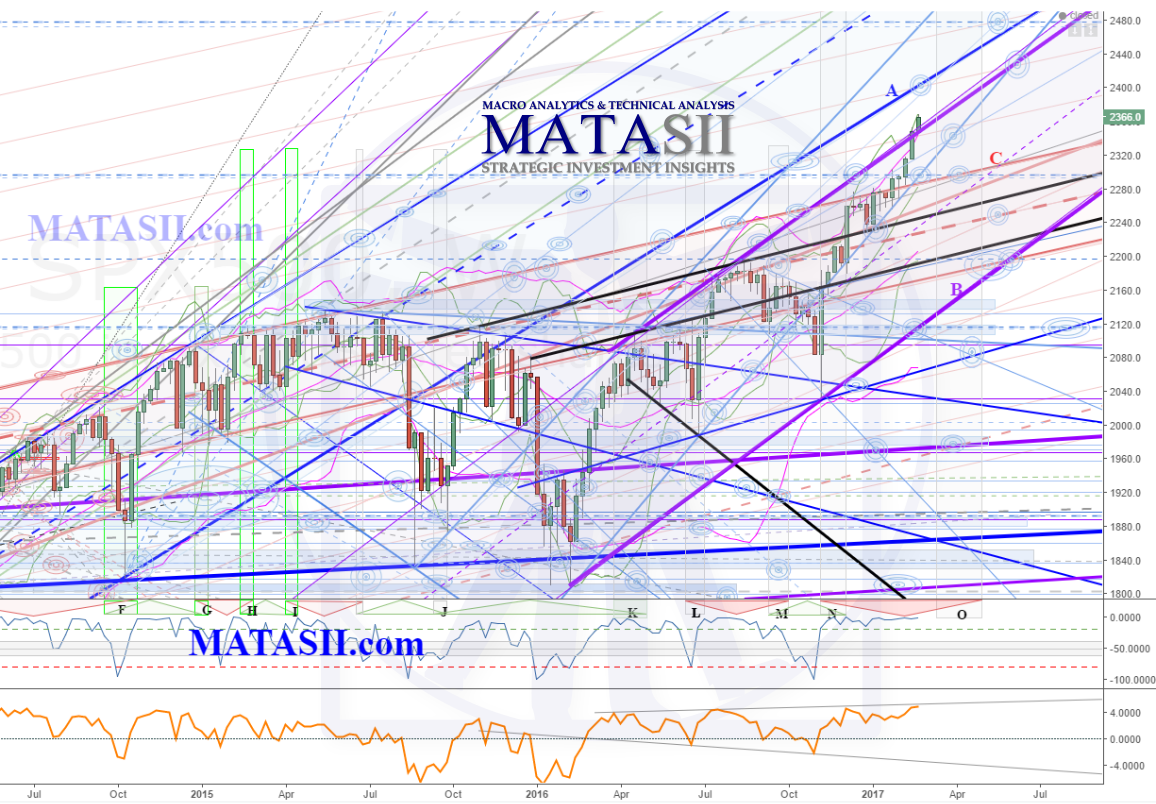
Here is a look at the full mark-up for the weekly. A, B, and C are the channels from the above charts; the blue dashed line at the top of the chart is the next Fibonacci extension target level. Note the W%R is at the upper extremes and at this time shows no signs of falling off, indicating positive pressure continues and more up is possible. A move up to retest channel A, or a drop back to retest channel C are what we are watching for in the immediate future.
On the daily a green trend line is highlighted as the most immediate significant resistance that needs to be broken through for more lift to occur. We can also see a green channel defining the lift since Nov 2016: falling out of this would be a warning to watch for channel C to be retested. Similar to the weekly, the daily W%R is also at upper extremes suggesting more lift is possible; falling below -20 would be another warning of potential weakness; watch for potential support from the grey zone on the indicator.