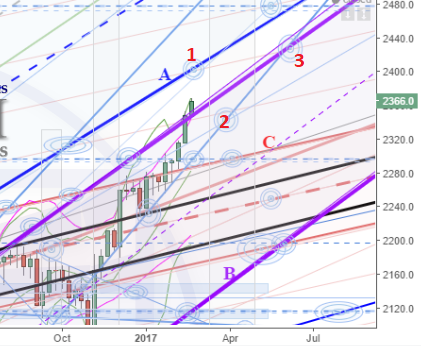
 Weekly: the chart to the right shows what we had given last update, the red numbers 1-3 have been added and highlight the targets the market moved through. You can see these in the current weekly chart below, with the market sitting at target 3. Since last update the market lifted in to HPTZ1; pulled back slightly in to HPTZ2; and then continued the lift, moving in to HPTZ3.
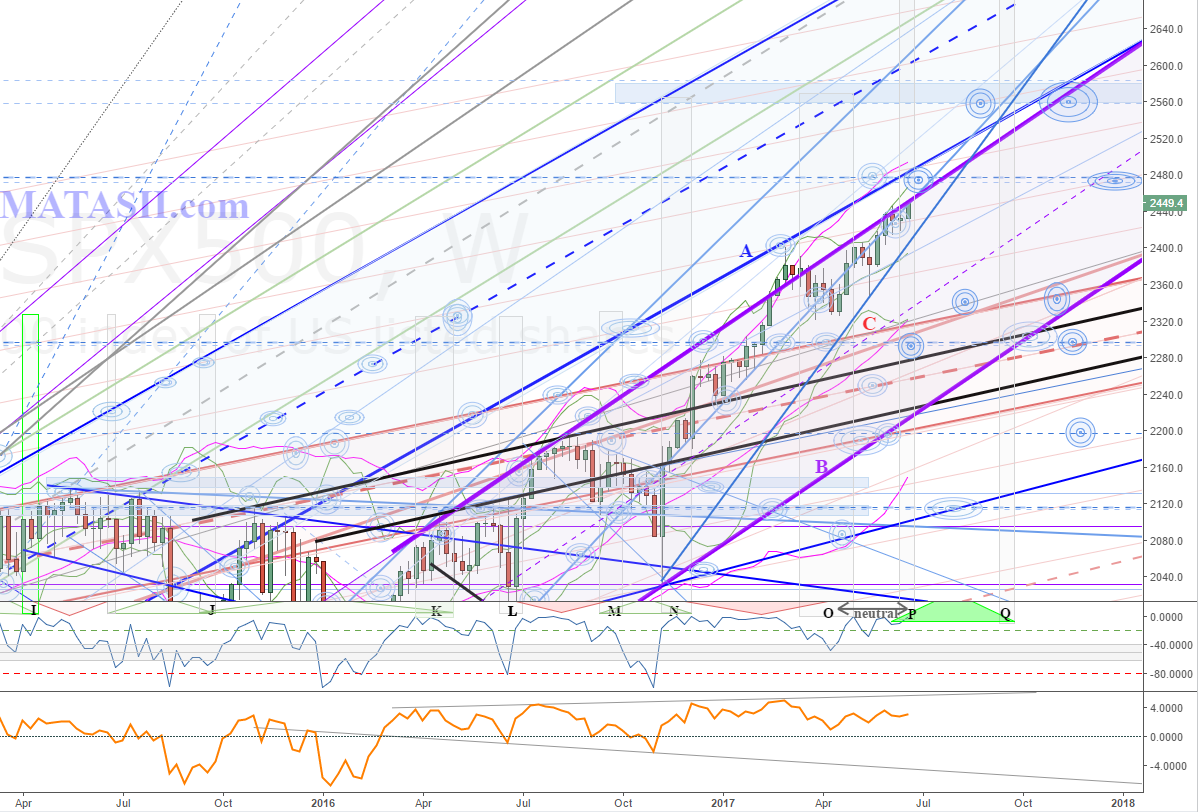
The market is about 25 pts shy of the 2475 level we have been looking towards. We will be watching for market reaction as we get nearer. This level was derived from Fibonacci extensions / projections and you can check previous updates to see exactly how those were placed. IF the market does not find resistance around 2475, then we would be looking to the next significant Fib extensions for a target level. These can be seen on either side of blue s/r zone above the market, starting at 2560.
Note the recent lift remained within the purple channel (B), riding along the upper channel s/r. IF resistance occurs around 2475, a pull back to the bottom channel support is possible, as we can see it occurred at the bottom of the chart, between Jul & Nov of 2016. Significant s/r's from red channel C can also be seen in the bottom 1/2 of purple channel B, and these will also be watched for support.
Daily: Watching 2475 and expecting a reaction around the thick dashed blue Fib level that can be seen above the market. As noted on the weekly above, if the market breaks through and continues to lift, we would then be looking to the next Fib levels around 2560, seen at the top of the chart.
IF resistance is found, pullbacks to the pink 34ma and blue s/r just below it would be normal market movement and we would need to see the market moving below these and finding resistance from them before we could consider more than just a pause within the larger positive trend. There is also a thick green s/r that can be seen to hold the last two lows, potentially the bottom of an expanding wedge pattern (top of the pattern could be the purple, green or blue s/r's seen at/above the current market). This would be the next place to watch for market support and a potential continuation of the pattern. Breaking down through this would be a warning for a potential larger market correction, with the top of red channel C (bottom of chart) and then the bottom support to the purple channel (not shown here on daily, see weekly above), as the next potential pull back levels to watch for support.
