If you have been following any of Gordon's Macro work then you are aware that there is a disconnect between the current market and reality. One of the many issues associated with this is trying to determine how high the market(s) will go. With respect to the S&P, it is also making new market highs: this means the market is in new territory and there are no previous market levels to look for past support and resistances.
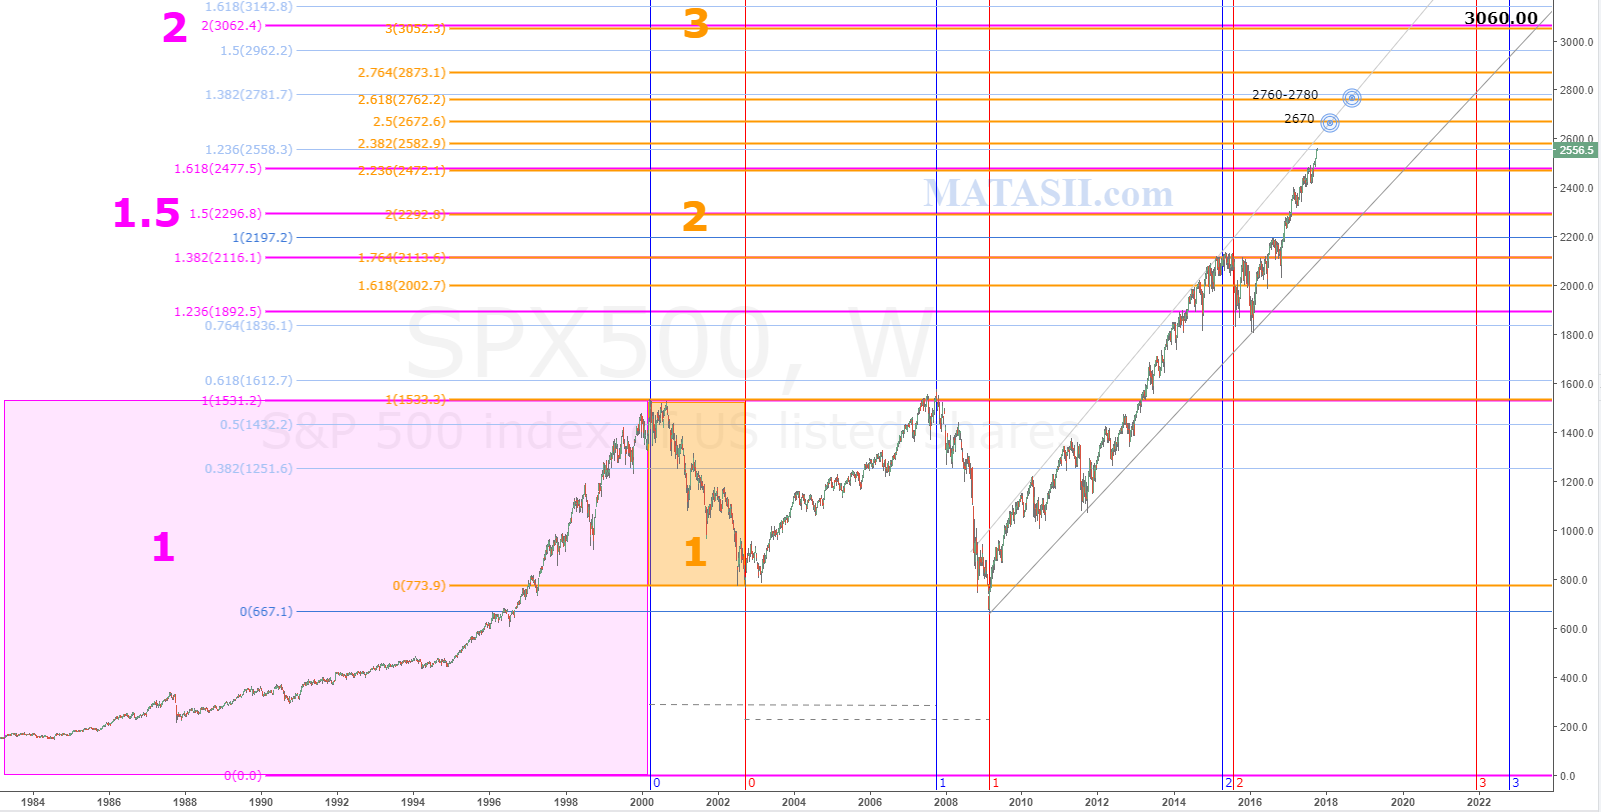
We first published this chart on Nov 27th, 2016, the original post discusses how it was constructed for those interested. At that time the market was sitting around 2200 and we had the same problem. Here is the current chart:
 Last update we said:
"The market is about 25 pts shy of the 2475 level we have been looking towards. We will be watching for market reaction as we get nearer. This level was derived from Fibonacci extensions / projections and you can check previous updates to see exactly how those were placed. IF the market does not find resistance around 2475, then we would be looking to the next significant Fib extensions for a target level. These can be seen on either side of blue s/r zone above the market, starting at 2560."
The market reached 2475, had a minor correction, then lifted again. As I write this it currently sits at 2558.30.
Again we are watching for market reaction. IF the market breaks 2580 and continues its lift, then the next level to watch for is around 2670. 2760-80 will be next levels to look towards if the market fails to respect 2670.
Note that this chart is suggesting 3060 around the year 2022. The lift from 2009 can be bound with an expanding wedge: as the market moves forward the potential for drastic corrections increase. At any time the market could be allowed to fall back to the support of the grey wedge pattern, and it would technically still be within the overall lift, and could then continue the pattern. The depth of the potential drop is increasing, as the expanding wedge shows. Watch for a potential increase in volatility over the next 5 years.
Weekly View
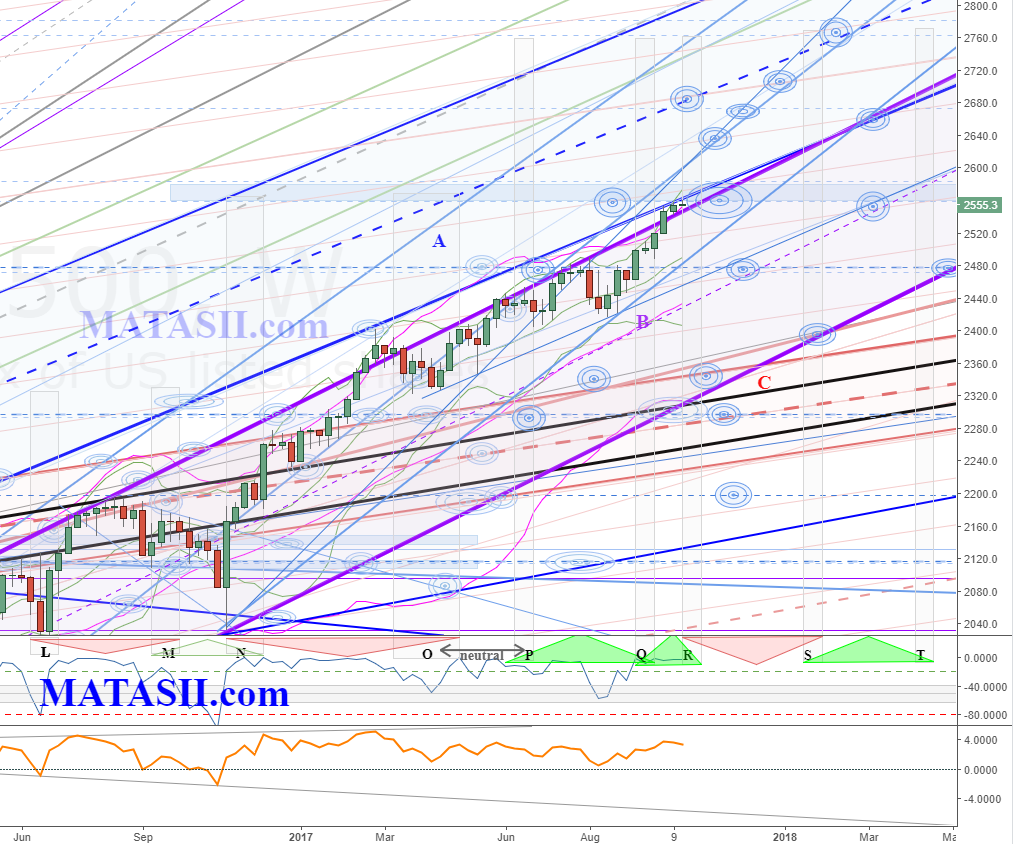
The blue s/r zone and 2560 were our target levels from last update, and we can see the market now sits just below the blue s/r zone. There is potential for market reaction - correction or consolidation. IF the market lifts through the blue s/r zone then we are looking towards 2670 for the next market highs. As noted above, we could have a significant correction at any time. In order for this to occur, the market would need to start breaking significant technical supports, and each of these would offer a potential opportunity to follow the market down to the next significant technical. While we can't know with any certainty how high the market will lift, or how deep any corrections will be, we can follow them technically as they occur, being mindful of the likely places for market reactions, as it moves from one technical to the next.
Daily View
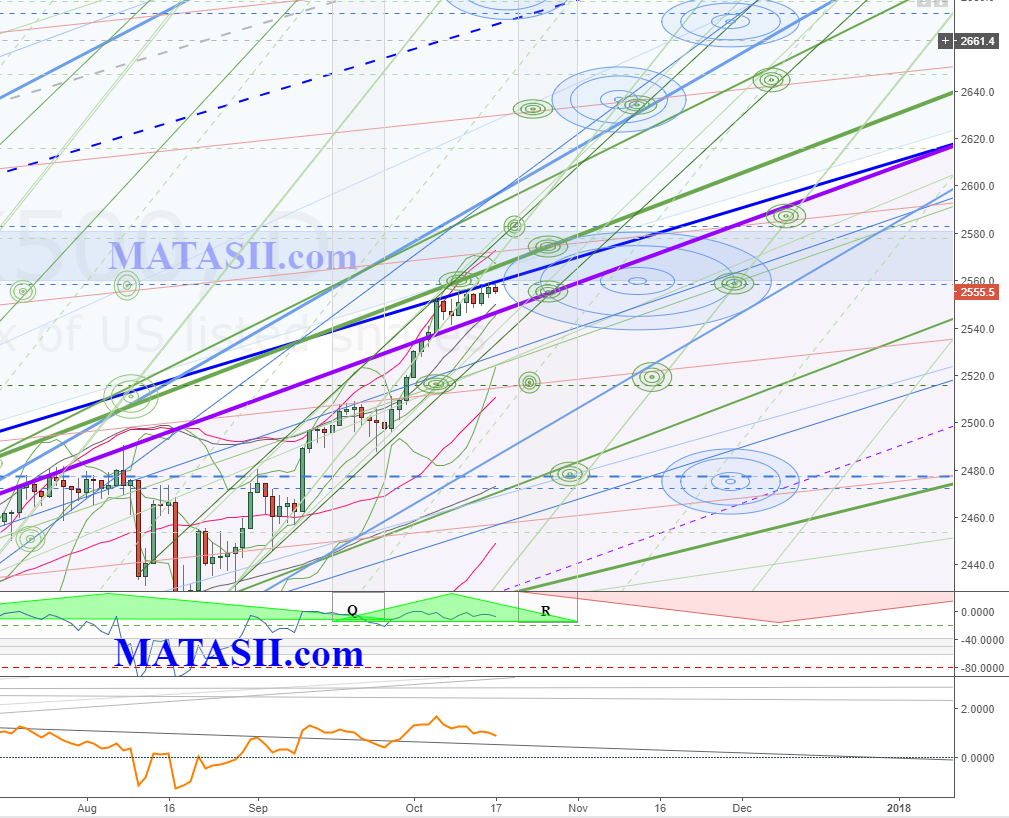
A look at the daily perspective shows the market has come up to the blue s/r zone and other significant technicals, and for the last 9 days has been in a sideways consolidation. At this time it appears to be a continuation pattern, and if it does lift further then we need to be wary of the other significant technicals near by, including the top of the blue s/r zone. IF resistance is not found from any of them, then the odds increase that the market may continue on to the next Fibonacci target level (2670). The lift seen on the chart is bound by a green daily channel, offering perspective and guidance for more lift, or if broken, for the potential start of a larger consolidation (or worse).
Note Gordon's Macro zones, negative pressure is expected to potentially start soon.