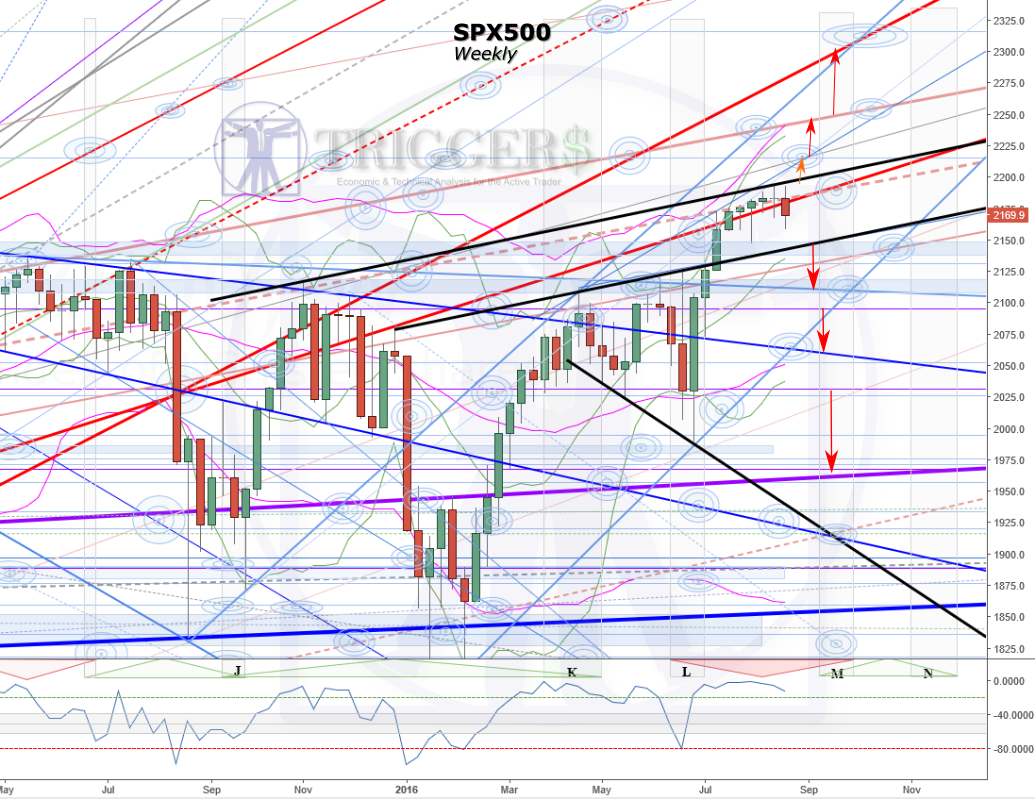
Last update I had said "Strong and quick lift that has occurred since the end of June will need to have a correction soon to make up time." The market was just coming up to the red-dashed s/r at that time and we can see that it has consolidated at this since.
Black trend lines have been drawn in to highlight significant technicals. Breaking from these offers a potential for the market to move to the next significant technicals (red arrows).
The sideways movement has a few possibilities that need to be considered.
Consolidation: I can see a few different Elliott Wave counts possible: one has the last drop off as the final leg C of an ABC correction. C may not be in yet, more down is possible - in to target and the 34ma. There is then a potential to see another significant lift from here as the new impulse wave up starts. There is a potential for this to be a 5 count corrective (instead of 3) and we could still see 2 more corrective waves D & E before the lift out of the consolidation occurs.
A black trend line can be seen to hold the market, breaking up through this could see the next wave up.
However there is another possibility developing.
Diamond Reversal: The recent sideways movement may be forming a diamond reversal pattern suggesting a down can be expected.
The black trend line under the market offers a significant technical, that when/if broken could see a drop to the next significant technicals.
FIB PRICE & TIME EXTENSIONS
The market has reached a significant Fibonacci Price extension level.
Below we can see the SPX Weekly with a long term view. We are interested in the current market level having reached the highlighted Fib extension at purple A2. It is interesting where this level is derived from and what it means. There is a Fib tool set from red A1 to red A2. A1 sits at 0.00 and A2 marks the highs seen from the market in 2000. I duplicated the Fib tool and shifted it up so that the bottom or start of the Fib tool, previously at 0.00, now starts at the low seen in 2009. Purple A1 highlights the Fib level. Purple A2 highlights where red A2 lifts to when you shift the tool.
And this is where the market currently is. Since 2009 it has lifted the same distance as the highs seen in 2000, originating from inception, if we mark the total value.
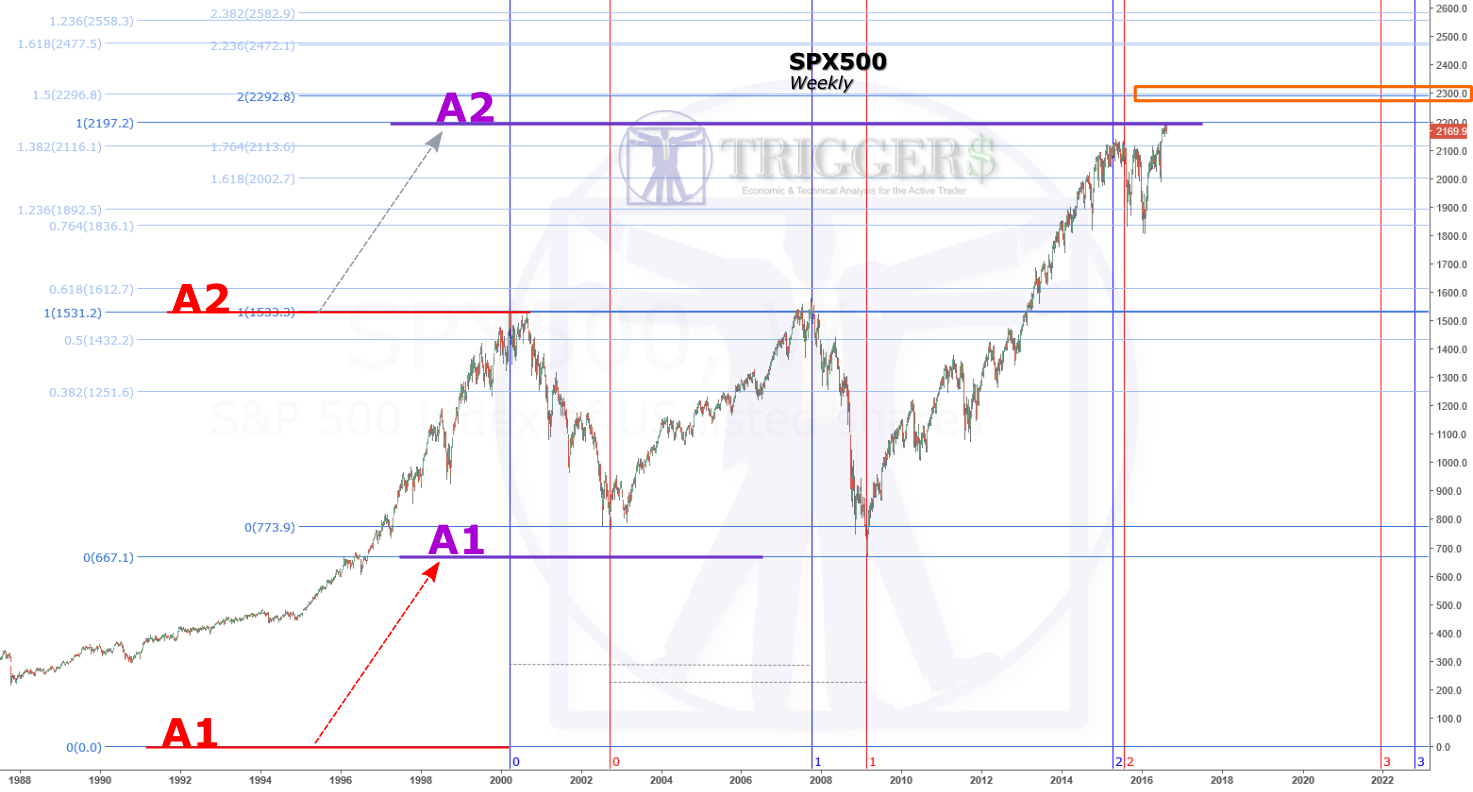
The next level of interest sits around 2300 and we can see 2 different Fib extensions clustering.
It should be noted that there are only 3 different price extension studies (tools) used here. The first two are highlighted above as red A1-A2 and purple A1-A2. The third can be seen just above A1 marking the bottom in 2002, encompassing the drop from the 2000 highs. All Fib levels seen on the chart above the 2000 & 2007 highs are price extensions from the 3 Fib studies. Note how nicely the drop off, consolidation and move to the current market level are respecting the forecasted Fib extension levels.
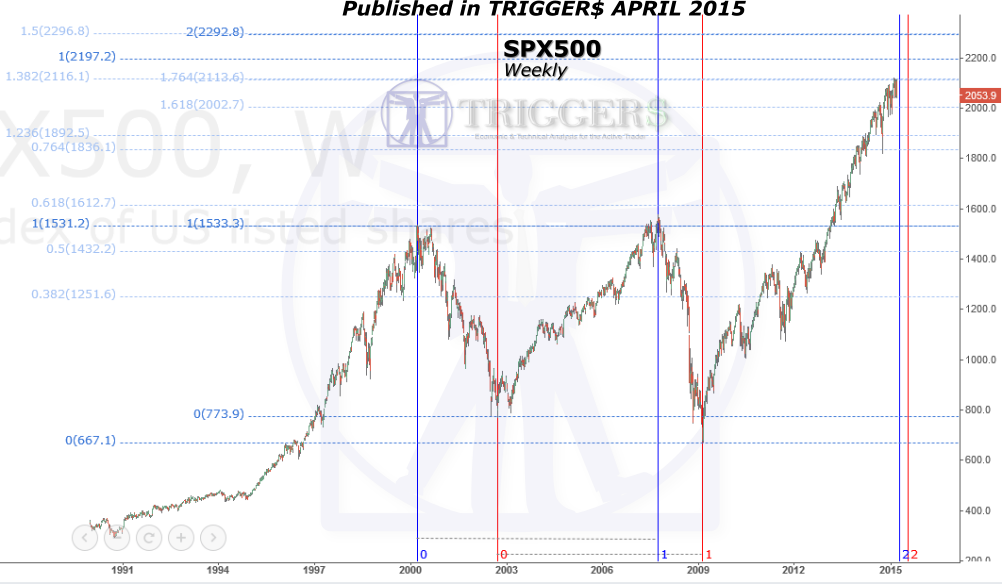
Below is the original chart first published in our TRIGGER$ APRIL 2015 issue. We brought it to attention as the the TIME extensions were nearing and warned of a potential shift in market structure just ahead. It ends up marking the first major sell-off in the market since the lift started in 2009.