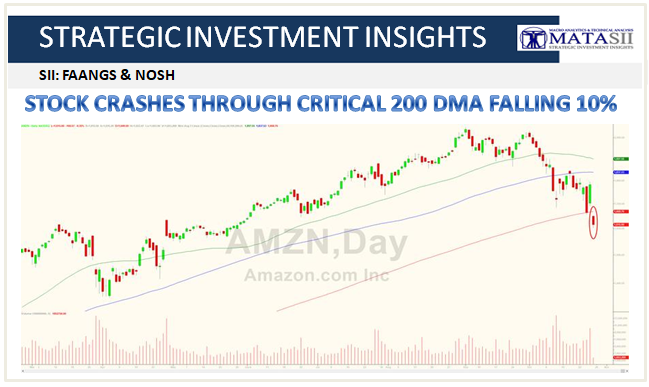
THE HEADLINE: STOCK CRASHES THROUGH CRITICAL 200 DMA FALLING 10%
MATASII SII ANALYSIS: JULY 12, 2018 CALL: The daily chart (right) gives us a closer look at more recent action. The low and lift we can see in April comes off two significant technicals: previous long term weekly channel; and the current support from the wedge pattern since the lift started in 2017. Solid orange highlights technical trigger considerations: breaking up above the higher could mean a continuation of the positive wedge pattern; falling below the lower would have the market broken down out of the wedge pattern and through a significant blue s/r zone. Orange dashed arrows offer potential moves for consideration from one technical to the next.
Down 10% on the day, after missing revenues overnight...

Amazon is now smaller in market cap than Microsoft...

All of the FANG stocks are getting crushed...

Dragging Nasdaq dramatically lower... (S&P and Dow are back in the red for 2018)

Expect the Plunge Protection Team any second - when was the last time we closed ugly on a Friday?