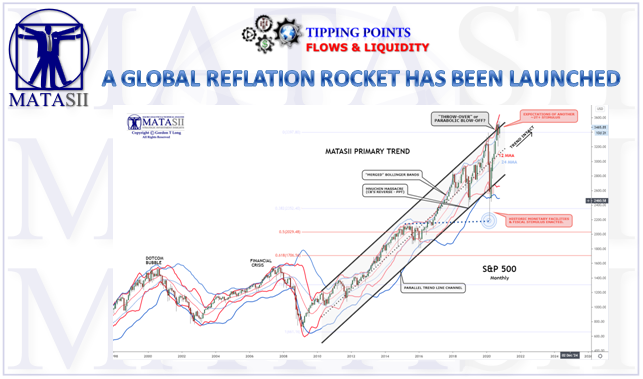
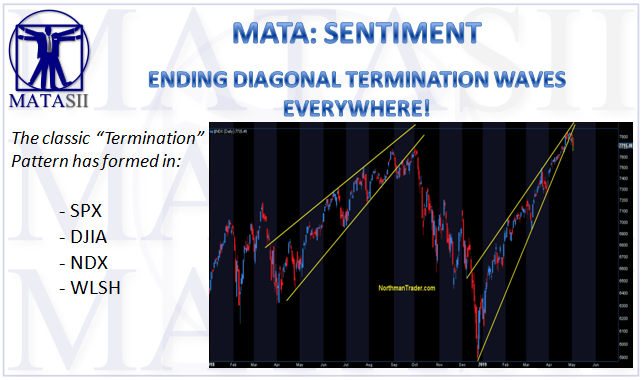
what Gordon T Long Global Macro Research | Macro-Technical Analysis TIPPING POINTS FLOWS & LIQUIDITY A GLOBAL REFLATION ROCKET HAS BEEN LAUNCHED It is easy to lose perspective with the financial recovery and stimulus numbers currently being bantered around – Millions, Billions and now Trillions! Lets try and put them into some sort of context. […]
spx
WILL 2021 BE THE YEAR OF HARD ASSETS?
Gordon T Long Global Macro Research | Macro-Technical Analysis SII PRECIOUS METALS WILL 2021 BE THE YEAR OF HARD ASSETS? INFLATION: We expect to see Inflation in the short to intermediate term impacting disposable income in the form of; Increased taxes at all levels of government, Covid-19 retail and services ‘surcharges’, Rising interest rates, Higher […]
IS THE MARKET SETTING UP FOR ANOTHER INVESTOR SCARE?
Gordon T Long Global Macro Research | Macro-Technical Analysis STRATEGIC INVESTMENT INSIGHTS S&P 500 MARKETS SETTING UP FOR ANOTHER INVESTOR SCARE Though the markets are in a confirmed uptrend that has not yet been broken (despite the March Covid-19 driven market plummet), three factors suggest we are nearing another market scare. A scare that […]
CAN A STOCK MARKET DISCONNECTED FROM THE ECONOMY BE MAINTAINED?
Gordon T Long Global Macro Research | Macro-Technical Analysis TIPPING POINTS FLOWS & LIQUIDITY CAN A STOCK MARKET DISCONNECTED FROM THE ECONOMY BE MAINTAINED? There is little dispute amongst long term market professional that equity markets have disconnected from the economy. Yesterday, yet another investment legend Jeremy Grantham went on record that in his […]
MACRO ANALYTICS: TERTIARY INDICATORS – S&P 500
MACRO ANALYTICS: TERTIARY INDICATORS – S&P 500 TERTIARY INDICATOR CHARTS – S&P 500 The Tertiary Indicators use a 50 / 100 / 200 Daily Moving Average (DMA); The moving averages are reflect the 50 DMA above both the 100 and 200 with the 100 DMA approaching a “possible positive cross of the 200 DMA. The […]
MACRO ANALYTICS: SECONDARY INDICATORS – S&P 500
MACRO ANALYTICS: SECONDARY INDICATORS – S&P 500 The Secondary Indicators for the S&P 500 are still giving a positive market bias despite market turbulence and Monday’s largest sell-off since January 4th. SECONDARY INDICATOR CHARTS – S&P 500 The Secondary Indicator uses a 20 /40 / 80 Week set of Weekly Moving Averages. The first chart […]
MACRO ANALYTICS: PRIMARY INDICATORS – S&P 500
MACRO ANALYTICS: PRIMARY INDICATORS – S&P 500 The MATASII Macro Analytic Primary Indicators are still in an upward trend and as of 09-09-19 no violations have as yet occurred. The Primary Indicators for the S&P 500 are still giving a positive market bias despite market turbulence. We have broken our 2960 Trigger to the upside […]
MACRO ANALYTICS: PRIMARY INDICATORS – S&P 500
MACRO ANALYTICS: PRIMARY INDICATORS – S&P 500 The Primary Indicators for the S&P 500 are still giving a positive market bias despite market turbulence and Monday’s largest sell-off since January 4th. The MATASII Macro Analytic Primary Indicators are still in an upward trend and as of 05-13-19 no violations have as yet occurred despite a […]
ENDING DIAGONAL TERMINATION WAVES EVERYWHERE!
ENDING DIAGONAL TERMINATION WAVES EVERYWHERE! Elliott Wave’s “Ending Diagonals” The ending diagonal is a special type of wave that occurs in Wave 5 of an impulse, or the last wave of a correction pattern – Wave C of an A, B, C correction. This wave often occurs when the preceding move of the trend has […]
S&P 500 & DJIA ACHIEVES MATASII “RIGHT SHOULDER” PRICE TARGETS
S&P 500 & DJIA ACHIEVES MATASII “RIGHT SHOULDER” PRICE TARGETS The S&P 500 achieved the MATASII “Right Shoulder” target price and a critical overhead resistance level (shown by the black parallel) channel. We posted this chart with the right shoulder initially on December 24, 2018 along with a larger scale Elliott Wave Analysis There is a […]