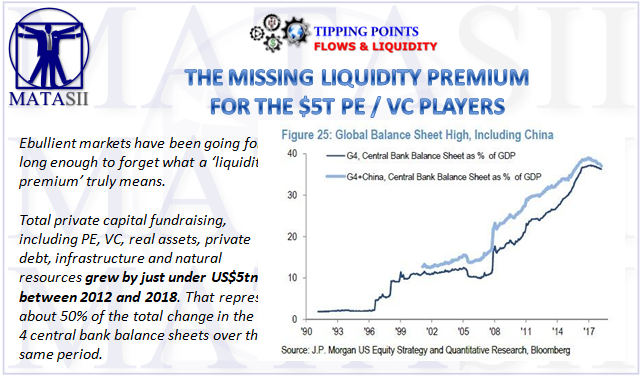
THE MISSING LIQUIDITY PREMIUM FOR THE $5T PE / VC PLAYERS
Ebullient markets have been going for long enough to forget what a ‘liquidity premium’ truly means.
- Accounting for US$20tn of central bank liquidity is by no means easy, but we have a hunch about where an outsized re-allocation of capital might have landed.
- While public markets were being distorted by QE, accelerated by ETFs and central bank buying (with the Bank of Japan owning Japanese Equities equivalent to 77.5% of Japan’s ETF market at last count), capital poured forth into private markets.
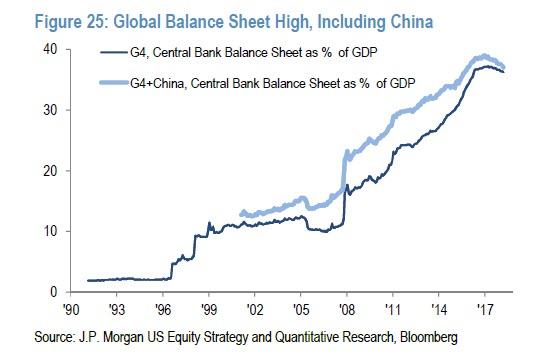
Total private capital fundraising, including PE, VC, real assets, private debt, infrastructure and natural resources grew by just under US$5tn between 2012 and 2018. That represents about 50% of the total change in the big 4 central bank balance sheets over the same period.
- The industry hit peak private equity mania in 2016, with a whopping 1,936 PE funds closing their rounds that year, raising a total of US$487bn in funds.
- In 2018, the average assets raised per fund is at an all time high of US$362m.
- In 2018, 32 first-time PE managers raised a total of US$8.7bn.
- In the VC space, 2018 saw 58 first-time VC managers raising US$6bn, versus 51 managers raising US$4.1bn in 2017. On a per-fund basis, assets raised per fund increased from US$80m in 2017 to US$103m in 2018.
Here’s the kicker – a sizeable chunk of incremental new assets is locked up in typical 10+1+1+1 year structures that are illiquid, with legally binding capital commitments.
The PE/VC model offered:
- The promise of lower volatility (thanks to lockups and the exclusion of retail investors),
- Lower correlations and
- Higher returns.
Distress is getting much harder to locate in scale and contrary to what FOMO-stricken investors want to believe, managers are admitting the easy times are coming to an end. A preponderance of new funds entering the market in the past decade means too much cash bidding up too few worthwhile assets, eroding potential returns.
Here is the root cause of this massive misallocation of capital ......
[SITE INDEX -- TIPPING POINTS - GLOBAL GOVERNANCE FAILURE]
A PUBLIC SOURCED ARTICLE FOR MATASII
READERS REFERENCE: (SUBSCRIBERS & PUBLIC ACCESS)

MATASII RESEARCH ANALYSIS & SYNTHESIS WAS SOURCED FROM:
SOURCE: 04-28-19 - Emad Mostaque of Three Body Capital - "$20 Trillion Later... Where Did All The Money Go?"
FAIR USE NOTICE This site contains copyrighted material the use of which has not always been specifically authorized by the copyright owner. We are making such material available in our efforts to advance understanding of environmental, political, human rights, economic, democracy, scientific, and social justice issues, etc. We believe this constitutes a 'fair use' of any such copyrighted material as provided for in section 107 of the US Copyright Law. In accordance with Title 17 U.S.C. Section 107, the material on this site is distributed without profit to those who have expressed a prior interest in receiving the included information for research and educational purposes. If you wish to use copyrighted material from this site for purposes of your own that go beyond 'fair use', you must obtain permission from the copyright owner.
NOTICE Information on these pages contains forward-looking statements that involve risks and uncertainties. Markets and instruments profiled on this page are for informational purposes only and should not in any way come across as a recommendation to buy or sell in these assets. You should do your own thorough research before making any investment decisions. MATASII.com does not in any way guarantee that this information is free from mistakes, errors, or material misstatements. It also does not guarantee that this information is of a timely nature. Investing in Open Markets involves a great deal of risk, including the loss of all or a portion of your investment, as well as emotional distress. All risks, losses and costs associated with investing, including total loss of principal, are your responsibility.