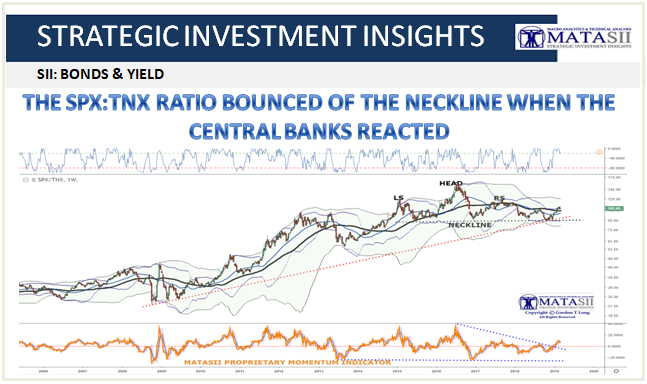
THE SPX:TNX RATIO BOUNCED OF THE NECKLINE WHEN THE CENTRAL BANKS REACTED
A PUBLIC SOURCED ARTICLE FOR MATASII (SUBSCRIBERS-SII & PUBLIC ACCESS) READERS REFERENCE
SII - BONDS & CREDIT
MATASII SYNTHESIS:
- We at N+MATASII watch the SPX:TNX Ratio very closely as it is a proven overall market indicator, especially since the advent of QE and domination of central bank policy initiatives,
- The TNX is the 10Y UST measured as Yield. We are dividing the SPX price by the 10 year UST Yield,
- It is important to additionally recognize that the chart is a log chart so percentages are factored in,
- The ratio reversed direction and started rising in late October. Equity prices were falling but yields were falling faster on a relative basis,
- When this ratio breaks its neckline ( falling equity prices and rising yield) the way down will be steep, deep and fast,
- We expect yields to soon begin rising (our TNX right shoulder), as Equities soften as they have now approached their expected Right Shoulder price levels.
- We expect another test of the "Neckline" by late spring.
