Gordon T Long

Gordon T Long

Global Macro Research | Macro-Technical Analysis 

TIPPING POINTS

INFLATION PRESSURES

FOLLOWING DETAILED ANALYSIS IS SUBSCRIBER CONTENT ONLY

Subscribe to view full post content with supporting live charts
 

LOOK FOR INFLATION TO REMAIN ELEVATED & PERSISTENT!

Markets are treating Inflation as both Cyclical and Transitory. It is not! It is Secular and will be Persistent!
 
Though Supply Chain issues may prove to be transitory (though many we suspect are permanent), inflation is not transitory for at least five secular reasons:
 
    1. Owner Occupied Rent (OER),
    2. Labor Costs (Why bond yields rose on August’s NFP),
    3. Import Costs,
    4. Financing Costs,
    5. Three Level Government Charges (Explosion in Taxation)

INFLATION IS NOT TRANSITORY!

THE CURRENT RATE OF INFLATION MAY BE TRANSITORY, BUT INFLATION WILL REMAIN AT HIGHER LEVELS

What is TRANSITORY:

  • Certain inflation elements are attributable largely to temporary supply bottlenecks which will be alleviated in due course.
    • Yes, medium-term negative supply shocks will increase production costs,
    • Yes, supply bottlenecks in labor and goods markets will prove transitory.,
    • Delta Variant:
      • Is temporarily boosting production costs, reducing output growth, and constraining labor supply,
      • Is disrupting the reopening of many service sectors and throwing a monkey wrench into global supply chains, ports, and logistics systems.
    • Shortages
      • Shortages of key inputs such as semiconductors are further hampering production of cars, electronic goods, and other consumer durables, thus boosting inflation.

Negative supply shocks are likely to persist over the medium and long term.

What is SECULAR:

  • We have persistent loose monetary, credit, and fiscal policies which will excessively stimulate aggregate demand and lead to inflationary over-heating.
    • Monthly Core inflation is now running close to 4% in the US and is expected to fall back toward the US Federal Reserve’s 2% target by next year.
    • In the past 6 months the Annualized rate of CPI inflation was 7.8% while core inflation was 6.8% (chart below).

Inflation doesn’t look like a transitory event when we look back to the mid 1950’s!

FED IS PREPARED FOR HIGHER SHORT TERM INFLATION?

FED’S POLICY: ‘AVERAGE INFLATION TARGETING’ (AIT)

By adopting average inflation targeting, the Fed is communicating that 2 percent is not a ceiling for inflation and that it may let inflation exceed 2 percent modestly and temporarily to make up for past low inflation. The key aim of this policy shift is anchoring inflation expectations. The basic idea is simple: Instead of aiming to return inflation over the medium term to the target rate of 2 percent, the Fed would aim to return the average of inflation over some period to the target rate.

What is considered an acceptable level of inflation? Answer: Around 2 percent.

    • The Federal Reserve has not established a formal inflation target, but policymakers generally believe that an acceptable inflation rate is around 2 percent or a bit below.
    • Academics within the Federal Reserve believe very low inflation usually signals demand for goods and services is lower than it should be, and this tends to slow economic growth and depress wages. This low demand can even lead to a recession with increases in unemployment – as we saw a decade ago during the Great Recession
    • The UK, as an example, adopted inflation targeting in 1992 following a painful currency devaluation. The Bank of England was given responsibility for setting interest rates in 1998 with an inflation target of 2.5%. The Fed, which for a long time worked to a target range of inflation, adopted a fixed 2% target in 2012.

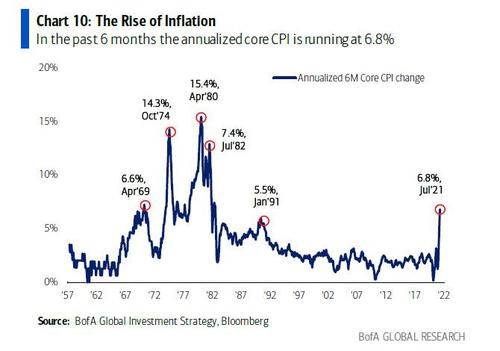
US core inflation, which strips out volatile food and energy prices, is likely still to be near 4% by year’s end. Macro policies, too, are likely to remain loose, judging by the Biden administration’s stimulus plans and the likelihood that weak eurozone economies will run large fiscal deficits even in 2022. And the European Central Bank and many other advanced-economy central banks remain fully committed to continuing unconventional policies for much longer. Although the Fed is considering tapering its quantitative easing (QE), it will likely remain dovish and behind the curve overall.

Like most central banks, the Fed has been lured into a “debt trap” by the surge in private and public liabilities (as a share of GDP) in recent years.

EXAMPLE 1: OWNER OCCUPIED RENT (OER)

Since January 2021, the national median rent has already increased by a staggering 13.8%. To put that in context, rent growth from January to August averaged just 3.6% in the pre-pandemic years from 2017-2019.

Over a third of the CPI index is what is referred to as Owner Occupied Rent. This number will explode the reported consumer inflation rate in 2022 as rent hikes are already occurring. CPI reflects renters’ existing leases but new lease figures predict surging rent inflation as old leases expire and the current moratorium on rent payments expires. What the government reported as rent inflation in July reflects the economy of a year ago and more. Renters’ leases take a year or two to expire. The Zillow, Apartment list.com and CoreLogic reports reflect the average rent on a new lease, not the rent on leases signed in the past. As old leases expire and renters have to pay the higher market rate, rent inflation will surge.

David Goldman’s Asia Times “Chart of the Day” shows this clearly below:

“The chart to the right shows that today’s reading of the Consumer Price Index for shelter lines up with past changes in the Zillow Rent Index. That is, past values of the Zillow Index correlate closely with today’s value of the Consumer Price Index.

With a lag there is a correlation between respectively, the rent component of CPI and the Zillow Rent Index (in terms of year-on-year change). So the first bar (starting from the bottom and going up) is the correlation of this month’s value of each variable with the previous month’s; the next bar is the correlation of this month’s value with the value two months ago, etc.

This cross-correlogram shows that there is a very high correlation between this month’s CPI shelter number and lagged values of the Zillow index going back 12 months.


Using the lagged relationship between the shelter component of CPI and the Zillow Index, I forecast next year’s change in the CPI shelter index from this year’s change in the Zillow Index. The result is shown in the chart below:

The model forecast lines up quite well with ten years of history of the CPI shelter component. Projected into the middle of 2022, the model forecasts a 5% annual rate of increase in CPI shelter. That’s far in excess of the Federal Reserve’s threshold of pain.”

CONCLUSION

Rents are rising at an annual rate of at least 12%, which should translate into another 5 percentage points of annual CPI growth. When these numbers finally post, stock and bond markets will be very unhappy.

Additionally, the latest Case-Shiller data showed that home prices across the US had soared at the fastest pace in history, surpassing even the epic surge from the housing bubble, after rising at a record 19.1%.


WE HAVE PERSISTENT INFLATION, NOT TRANSITORY INFLATION

We see from the chart that there have been three periods in which the commodities PPI sustained an annual rate of increase of 30% for six months or more. Two of them (1973 and 2007) coincided with spikes in the oil price where oil jumped to US$140 in 2007 – double its price today.

The two earlier periods of persistent inflation thus reflected a shock from outside the US economy. This time, we’ve had six months of a 30% rate of increase of commodity inflation due to factors inside the US economy. That’s what is really scary.

Everything is going up at once, from transportation services to manufacturing to commodities. That’s what happens when you try to shove $5 trillion worth of demand through an economy without the supply chains to make the goods and services or the infrastructure to ship them.

Strong research from @DallasFed confirms my suspicion: big increases in house prices presage substantial increases in measured housing inflation that will tend to consumer price measures up.

Lawrence H Summers, Former US Treasury Secretary


FAIR USE NOTICE  This site contains copyrighted material the use of which has not always been specifically authorized by the copyright owner. We are making such material available in our efforts to advance understanding of environmental, political, human rights, economic, democracy, scientific, and social justice issues, etc. We believe this constitutes a ‘fair use’ of any such copyrighted material as provided for in section 107 of the US Copyright Law. In accordance with Title 17 U.S.C. Section 107, the material on this site is distributed without profit to those who have expressed a prior interest in receiving the included information for research and educational purposes.  If you wish to use copyrighted material from this site for purposes of your own that go beyond ‘fair use’, you must obtain permission from the copyright owner.


NOTICE  Information on these pages contains forward-looking statements that involve risks and uncertainties. Markets and instruments profiled on this page are for informational purposes only and should not in any way come across as a recommendation to buy or sell in these assets. You should do your own thorough research before making any investment decisions. MATASII.com does not in any way guarantee that this information is free from mistakes, errors, or material misstatements. It also does not guarantee that this information is of a timely nature. Investing in Open Markets involves a great deal of risk, including the loss of all or a portion of your investment, as well as emotional distress. All risks, losses and costs associated with investing, including total loss of principal, are your responsibility.