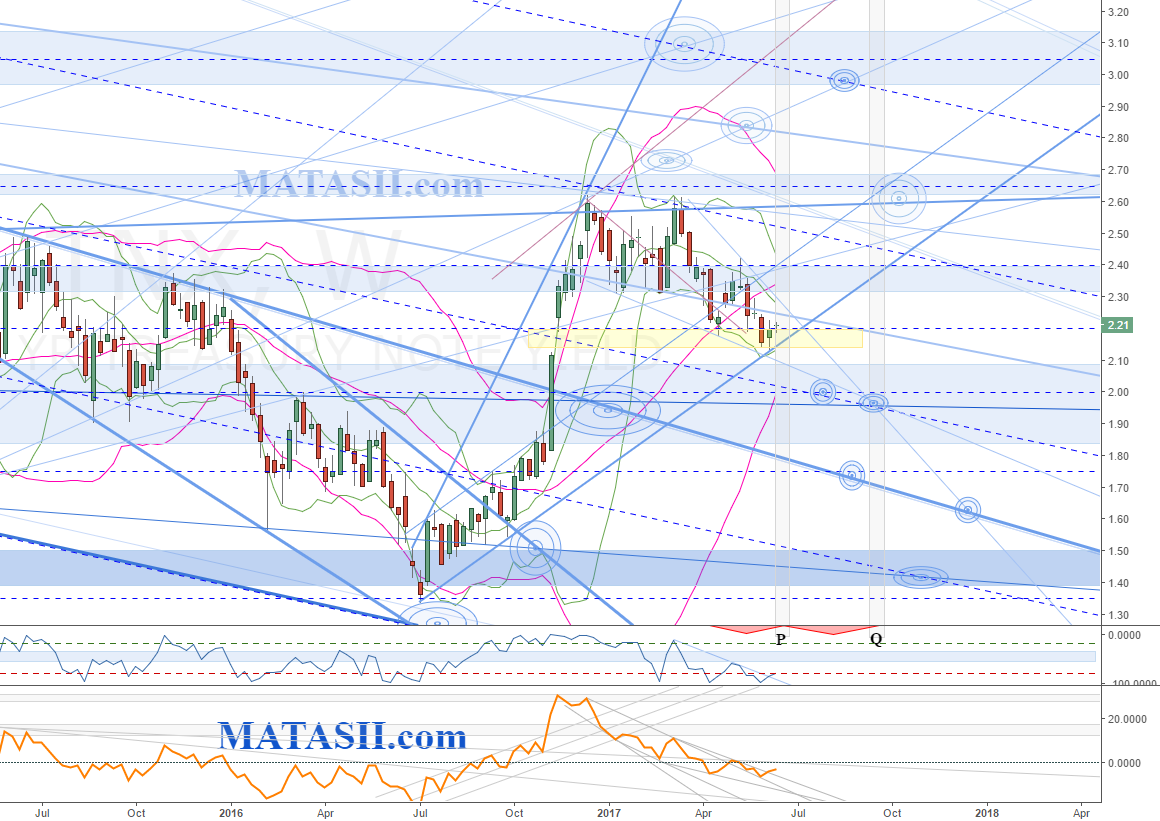
Weekly: The last time we updated the TNX we were watching for a potential move lower to fill a gap (yellow highlight). This occurred, and the market now sits at several significant technicals. The pattern for the lift since June 2016 could be seen as a potential expanding wedge, with the market currently sitting at the lower support s/r for the pattern. IF support is found here, we would be looking towards the the ma's and the next significant technicals for target level considerations. IF the market continues to fall of then a break of the wedge pattern s/r offers a technical consideration for a potential move to the LBB and other significant technicals. IF the market drops out of the wedge pattern, then a move back to retest the previous pattern s/r would be normal market movement.
Daily: The consolidation pattern since the end of 2016 currently looks like a contracting wedge. IF the market continues to fall, watch for this to potentially turn in to a more rounded shape top: if this occurs it could be warning of an even more sever drop (parabolic). An unfilled gap can be seen below the market (yellow highlight) and this would be the next lower levels to look towards. It is possible for the market to continue to follow the contracting wedge for some time, right in to the gap to be filled. IF the market finds support and breaks up out of the contracting wedge, we would be looking to the highs of the previous levels, or the blue s/r zones above the market.
