Our previous update (Jan 21/2017) gave a couple of high probability possibilities to watch out for. Our first paragraph said: "An initial break of 2.3 offers potential opportunity for a drop to fill the first gap, with a another potential drop to the next blue s/r zone below". This is pretty much what occurred. Initially the 2.3 level holds and gives a double top, the market then drops and breaks the 2.3 level on the way back down, continuing on to fill the gap, and eventually reaches the next lower blue s/r zone.
The second paragraph states: "A lift over 2.64 could be the continuation of the severe lift and a move to the next blue s/r zone around 3.0". The market first drops: note the double top forming does so and holds at the 2.64 level. After filling the gap and touching the lower blue s/r zone, the market then bounces significantly, lifting back up and breaking over 2.64, where it then moves to just under the next blue s/r at 3.0. A small consolidation and the next lift takes the market in to the blue s/r zone and just over 3.0.
Where to now?
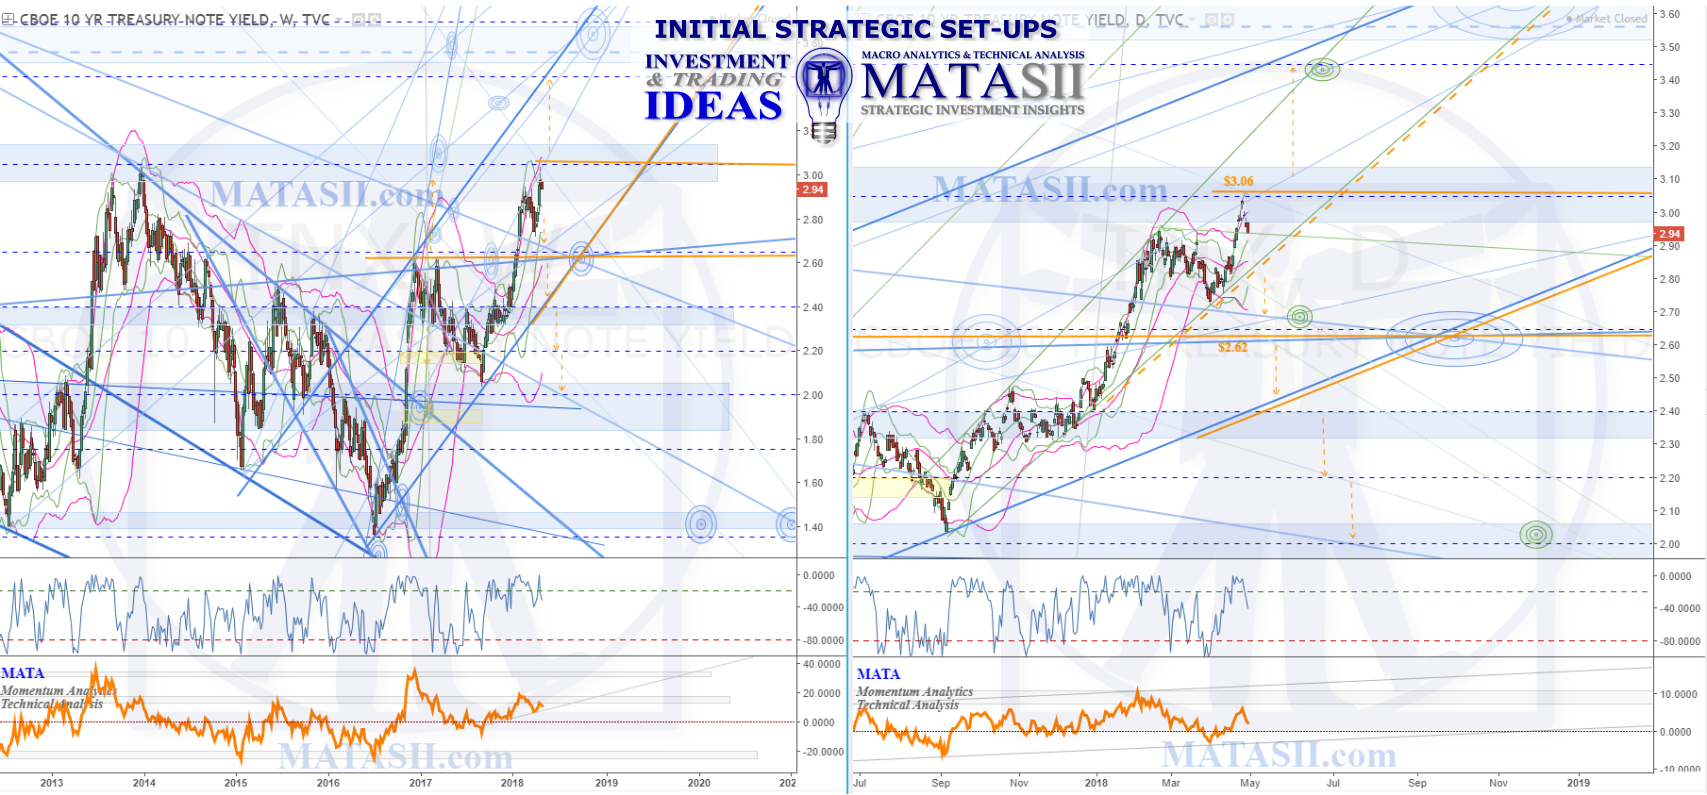
The weekly chart (left) shows us 3 clear waves with equal highs and lows, the current market sitting back at the previous highs in 2014. Given that we now have a fairly clear ABC pattern potentially completed, we should be wary of a reversal and a drop back down (and potentially past) the lows seen on the weekly chart.
Solid orange highlights significant technicals to watch for potential trigger considerations. A lift past the recent highs and Fibonacci level the market just bounced off ($3.06) could see another significant lift: the next Fibonacci level ($3.45) and blue s/r zone above the market ($3.52) are target levels to watch, with a potential to see a move as high as $3.64.
IF the market holds and reverses from current levels there are 2 significant technicals to watch: the level formed at 2.64 - note the solid orange highlight at 2.62; and the long term weekly support from the last lift starting in Jul 2017. A solid orange line highlights the potential channel support the market has been lifting in and we would like to see a move through this to confirm more down. It is possible to hit the lower channel (blue weekly) and then bounce to continue the lift.
On the daily chart (right) we can see a closer view of the recent market action as well as the highlighted significant technicals discussed above. Also note the dashed orange highlight - this is identifying the support for the most recent lift from Sept. 2016 when the market bounced from the blue weekly channel support. This is a riskier technical consideration, or for shorter targets, as the market could still bounce and continue to lift within the larger blue weekly channel.
Orange dashed arrows offer potential move considerations as the market moves from one technical to the next.