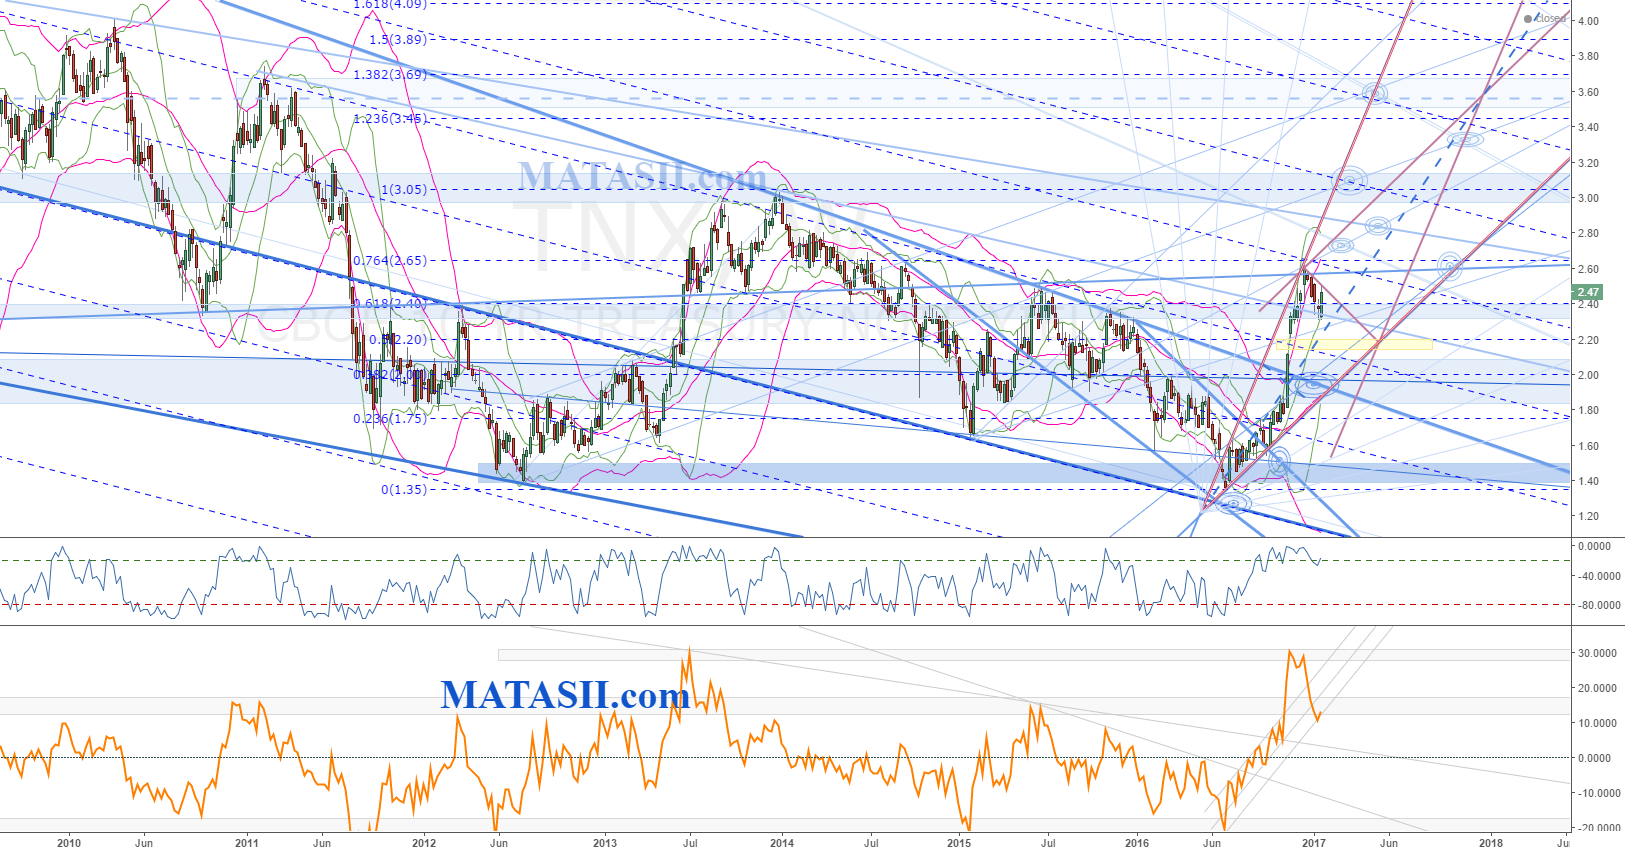
WEEKLY View: A long term descending wedge pattern can be seen coming from the left of the chart; this has recently been violently broken through: the lift can be seen to reach significant pattern resistance. The last few weeks have seen the market fall off slightly from the recently made high, dropping back in to a blue s/r zone. The W%R remains lifted in to extreme territory suggesting positive pressure continues and more lift potential. There is a possibility of more pull back: a gap remains unfilled and it is normal market movement to see a retest of previous pattern resistance (large blue wedge pattern). A lot of strength remains at this time however and more weakness would need to be seen for these to occur. Following the technicals on the Daily time frame can offer clues for when/if this may be unfolding.
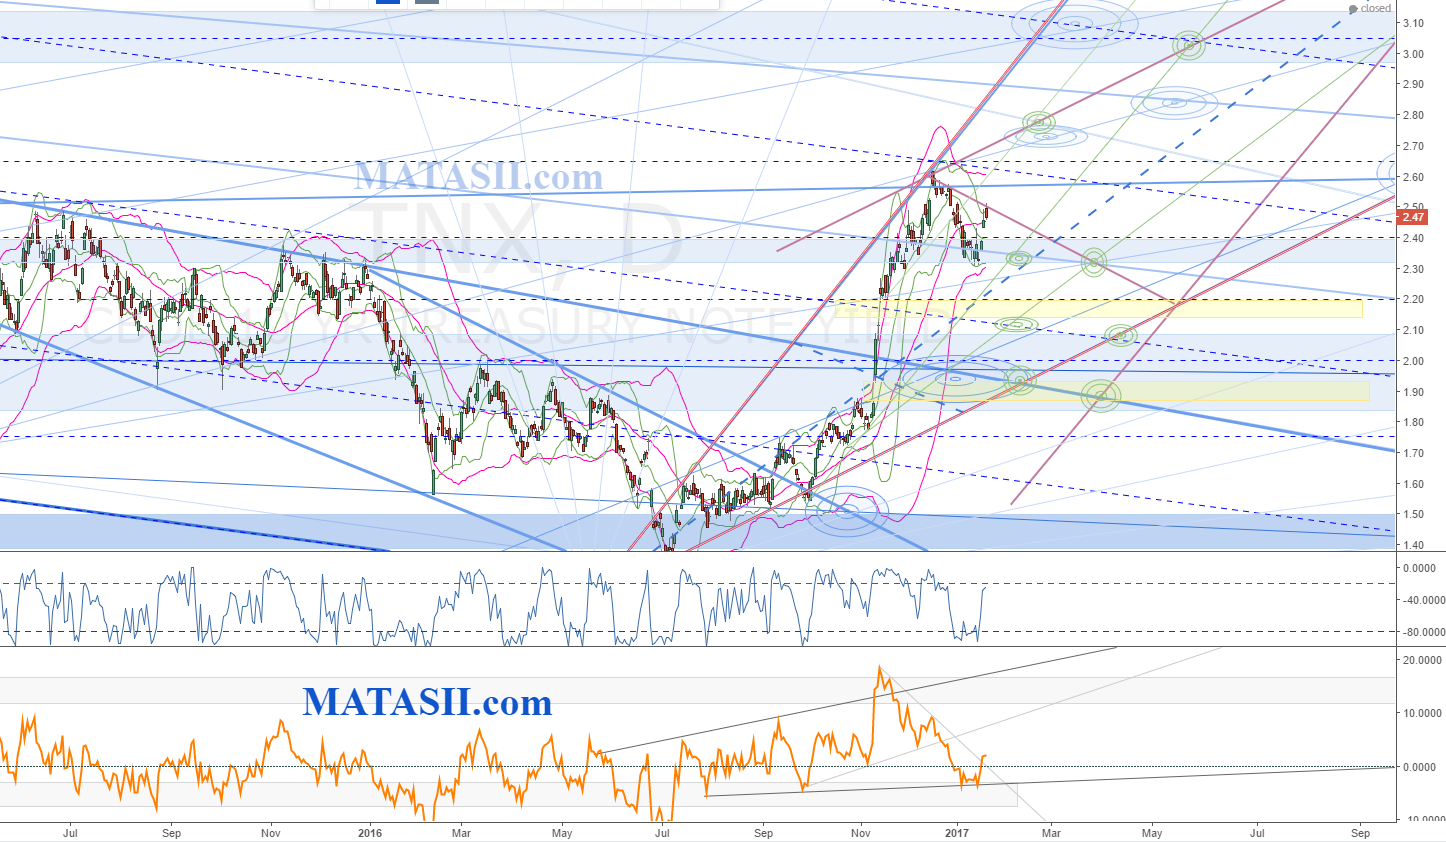
On the Daily chart below we can see the recent lift and break from the wedge pattern has done so in it's own potential wedge. It was noted above that a fall back to retest the larger blue weekly wedge s/r would be normal market movement. For this to occur we would first see the market drop through the current blue s/r zone, with a look towards filling the first gap (yellow highlight). Below the gap the next blue s/r zone would be the next target level to watch for, with a possibility to drop further to fill the lower gap (2nd yellow highlight) and retest previous patter resistance.
A lot of strength from the previous lift can still be seen: W%R is just coming up to upper extremes here on the daily and we noted the Weekly above has been staying lifted. IF we do not see the market drop through current support (blue s/r zone), then we could see another gap up, similar to the previous, if not just a resuming of the recent strong up trend. Lifting past previous highs would offer a potential trigger consideration for more lift: we would be looking toward the next blue s/r zone for target levels.