UNDERSTANDING THE INVESTMENT THESIS OF A FUND THAT IS "SHORT" THE MARKET
A PUBLIC SOURCED ARTICLE FOR MATASII (SUBSCRIBERS & PUBLIC ACCESS) READERS REFERENCE


SOURCE: 02-24-19 - Crescat Capital's Shareholder Newsletter - "China Is Already In Recession, Get Ready For The Implosion"
MATASII SYNTHESIS:
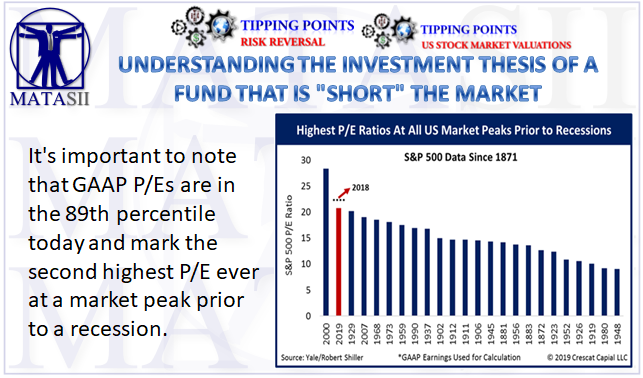
- It's important to note that GAAP P/Es are in the 89th percentile today and mark the second highest P/E ever at a market peak prior to a recession.
- 2018's valuation records are astounding in that they show the S&P 500 to be more fundamentally overvalued than it was at the prior two historic stock market valuation peaks in 1929 and 2000, bona fide speculative manias.
- We believe most investors remain oblivious to these valuation facts as well as the coincident economic cycle timing signals we outlined above.
- Stock market bulls remain focused on non-normalized P/E ratios today as their main argument for why stocks are still reasonably valued. But using data going back to 1871 provided by Robert Shiller, GAAP P/E ratios reached as high as the 89th percentile at the end of the third quarter last year at 22.3.
- The problem we see with P/E today is that even this historically high P/E ratio is a potential "value trap" because unsustainably high profit margins today are likely to play a role in the peak of the economic cycle.
- Adjusting for margins, normalized P/Es hit a record all-time high of 47 in 2018, higher than market peaks in 1929 and 2000.
- Normalized P/Es smooth earnings for the whole business cycle (Robert Shiller) but also adjust for structural shifts in profit margins (John Hussman).
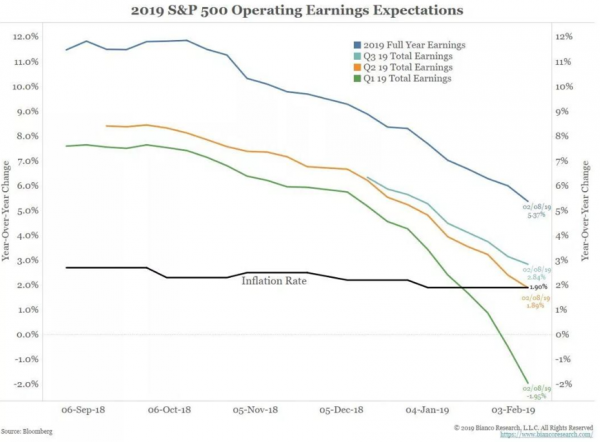
- Analysts expect S&P 500 earnings to decline year-over-year in the first quarter of 2019, just one sign of potentially peak earnings and a massive deceleration of growth.
THE TWO MAJOR CATALYSTS
CATALYST #1
- The bursting of the everything bubble has been the Fed's monetary tightening cycle over the last three years.
- The Fed has been hiking interest rates at a record rate of change late in a business cycle and has also been engaged in a year of Fed balance sheet reduction or quantitative tightening (QT).
- The Fed tightening followed eight years of record Fed easing or interest rate reduction that would also include debt monetization and money printing, aka quantitative easing (QE).
- Remarkably, QE did not lead to any significant real-world inflation or hyperinflation in the world's developed economies, but instead inflated global asset bubbles to historic levels.
CATALYST #2
- The beginning of the bursting of the everything bubble is the macro downturn in China.
- China has been the largest growth engine of the global economy since the Global Financial Crisis, but in our analysis, China already entered a recession in the fourth quarter of 2018, official GDP numbers not being trustworthy, another casualty of Fed tightening.
- The median Chinese stock was down 40% in the fourth quarter from its highs a year ago, strong evidence of recession.
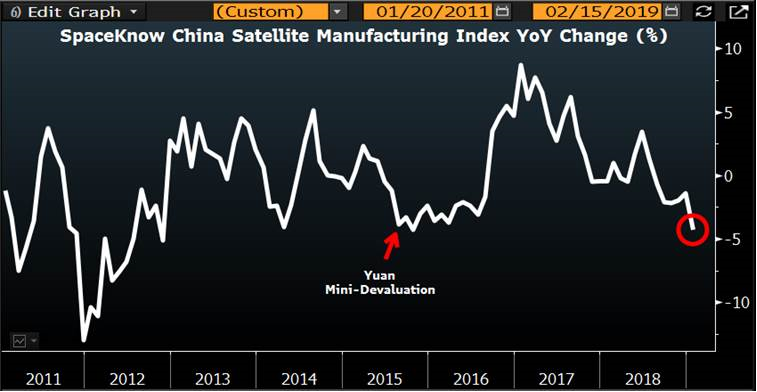
- Satellite data show that authoritarian countries such as China routinely and systemically overstate their GDP.
- One such study by SpaceKnow monitors 6,000 industrial sites in China and shows that China's manufacturing sector entered a contraction last year.
Market update from Crescat Capital's latest email to investors.
There is indeed a business cycle, and timing it ahead of key inflection points is key to successful long-term investing. Based on our analysis, we are heading into a bear market in 2019 that will coincide with the start of a global recession that will not be officially acknowledged until well after it began. For the following reasons, we believe September of 2018 marked the essential peak of the US stock market for the current economic cycle:
- In 2018, the US stock market's historic high valuations across 8 fundamental metrics.1
- The technical damage to stocks at the end of last year has altered investor psychology and likely begun a cyclical shift out of stocks from historically high US household allocation to equities that was exceeded only in the tech bubble.
- Evidence is building that both China and Europe may already be in recession: industrial production decline in both countries, 2018 Chinese equity bear market, and Chinese manufacturing satellite data show a contraction.
- Interest rates across global credit markets are sending signals with uncanny resemblance to past cyclical asset-bubble peaks.
- Cross country yield spreads and yield curve inversions are reminiscent of tech and housing bubble peaks.
- We have had the steepest ever Fed rate hike cycle on an interest rate of change basis late in an economic expansion combined with Fed balance sheet reduction that the rest of the world's central banks have been unable to follow.
- The Chinese banking asset bubble is currently the largest of any country ever with 400% on-balance-sheet banking asset growth relative to GDP in the last decade to $40 trillion.
- Heightened trade and geopolitical conflict between US and China that is likely to continue at a major impasse despite a token trade deal may be reached in the short term between Trump and Xi.
- The US consumer, the #1 driver of the US economy, is weakening based on a breadth of various indicators including sharp drop in US consumer confidence expectations, the biggest decline in monthly retail sales since the last recession, deteriorating composite of housing market indicators, and sharply rising auto loan delinquencies.
- Near-record low junk and investment grade credit spreads reached in 2018, a contrarian indicator of a credit cycle peak.
- The second longest economic expansion in US history but one that does not have a US fiscal budget surplus that supported the longest economic expansion ever in the 1990s.
- Historically high global debt-to-GDP levels in aggregate and across a record number of countries.
At Crescat, we remain tactically positioned to capitalize on a downturn in the global economic cycle. 2018's valuation records are astounding in that they show the S&P 500 to be more fundamentally overvalued than it was at the prior two historic stock market valuation peaks in 1929 and 2000, bona fide speculative manias. We believe most investors remain oblivious to these valuation facts as well as the coincident economic cycle timing signals we outlined above.
Stock market bulls remain focused on non-normalized P/E ratios today as their main argument for why stocks are still reasonably valued. But using data going back to 1871 provided by Robert Shiller, GAAP P/E ratios reached as high as the 89th percentile at the end of the third quarter last year at 22.3 as we show in the chart below. The problem we see with P/E today is that even this historically high P/E ratio is a potential "value trap" because unsustainably high profit margins today are likely to play a role in the peak of the economic cycle. Adjusting for margins, normalized P/Es hit a record all-time high of 47 in 2018, higher than market peaks in 1929 and 2000. Normalized P/Es smooth earnings for the whole business cycle (Robert Shiller) but also adjust for structural shifts in profit margins (John Hussman).
In any case, even if one is relying solely on P/Es as valuation measure, it's important to note that GAAP P/Es are in the 89th percentile today mark the second highest P/E ever at a market peak prior to a recession.
Already, analysts expect S&P 500 earnings to decline year-over-year in the first quarter of 2019, just one sign of potentially peak earnings and a massive deceleration of growth.
Source: Bianco Research L.L.C.
In our analysis, the 2018 US stock market valuation bubble was a mania in and of itself, the product of the global central-bank driven debt-fueled "everything bubble" in global equities, credit, real estate, and illiquid private assets. The froth has been so extreme that it spilled over into modern-day Dutch tulip bulbs like cryptocurrencies and cannabis stocks. The US stock market finally cracked in the in the fourth quarter of last year with an almost 20% correction in the S&P 500 from its September highs. Crescat's hedge funds were among the top-performing in 2018 according to Bloomberg thanks to our global equity net short position with that we steadfastly maintained for the full year. We believe careful individual stock and country selection driven by our models was also key to our outperformance in 2018. Based on our macro models, we believe it is only the beginning of new bear market and downturn in the US and global business cycle.
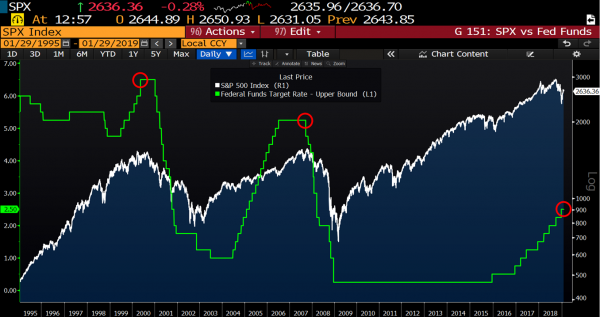
After a sharp snap-back rally year to date in equity markets, as the Fed signaled a panic pause in its rate hike cycle and its balance sheet reduction plans, many are hopeful that the US economic cycle can be extended. The S&P 500 Index is now down only 4.7% from its record highs in September 2018. The problem is that US equity valuations remain in near-record valuation territory while US corporate earnings and other macroeconomic indicators are deteriorating. Our analysis shows that when the Fed halts and/or reverses its monetary tightening late in a business cycle, as shown in the chart below, it is not a bullish signal at all. Instead, it is a reliable sign that we are in the early stages of a macro downturn that can often very quickly lead to recession. Even when the pause such as in 2006 translated into a delayed recession, it was a signal that asset bubbles were beginning to burst in the US housing and subprime finance markets. Short opportunities abounded after that pause and contributed to Crescat's strong performance in both hedge funds in 2006 followed by their best yearly performance ever in 2007. Shorting at high valuations ahead of the recession is key. But today, as compared to 2006 when the Fed paused, we are much later in the business cycle, also as shown below, at record valuations, and the market has already begun to crack. If there was a soft landing and extension of the business cycle after a Fed pause, that is what we had already had in 2016.
Source: Bloomberg
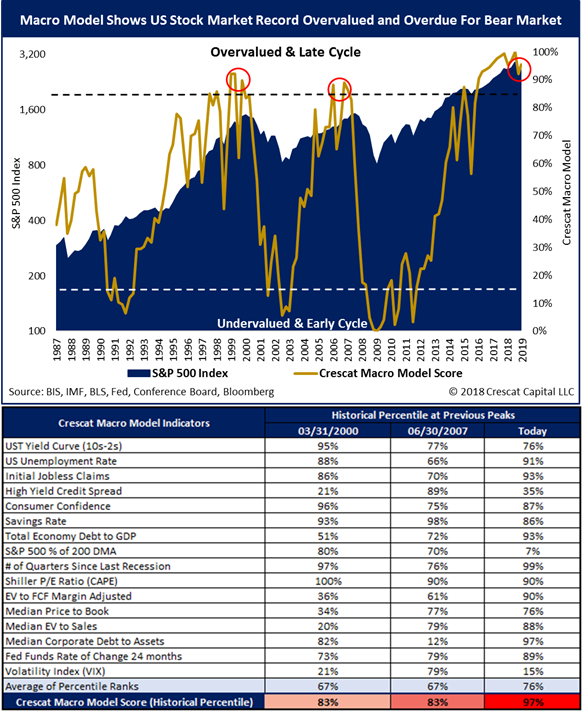
Based upon our 16-factor macro model, updated below through mid-February, we believe we are only in the early stages of a US equity bear market following a record overvalued/late-cycle reading from our macro model which is still in the 95th percentile. The highest reading in our model so far at 100% was in September 2018 and coincided with the market top to date for this business cycle.
The stock market strength year-to-date has been fueled by optimism over a China trade deal and the Fed pause in response to the equity correction in the fourth quarter. These are temporary factors driving the bounce that we cannot ignore, but we are compelled to stay grounded in the fundamental and economic factors in our macro model. We strongly believe the YTD performance is bear-market rally that will soon fail. Within the constraints of our risk model, we remain positioned to profit from a further equity market meltdown with a net short global equity position in our hedge funds and substantial cash and precious metals long exposure in our long-only SMA.
A major catalyst for the bursting of the everything bubble has been the Fed's monetary tightening cycle over the last three years. The Fed has been hiking interest rates at a record rate of change late in a business cycle and has also been engaged in a year of Fed balance sheet reduction or quantitative tightening (QT).
The Fed tightening followed eight years of record Fed easing or interest rate reduction that would also include debt monetization and money printing, aka quantitative easing (QE). Remarkably, QE did not lead to any significant real-world inflation or hyperinflation in the world's developed economies, but instead inflated global asset bubbles to historic levels.
A second major catalyst for the beginning of the bursting of the everything bubble is the macro downturn in China. China has been the largest growth engine of the global economy since the Global Financial Crisis, but in our analysis, China already entered a recession in the fourth quarter of 2018, official GDP numbers not being trustworthy, another casualty of Fed tightening. The median Chinese stock was down 40% in the fourth quarter from its highs a year ago, strong evidence of recession. Satellite data show that authoritarian countries such as China routinely and systemically overstate their GDP. One such study by SpaceKnow monitors 6,000 industrial sites in China and shows that China's manufacturing sector entered a contraction last year.
Source: Bloomberg
In our past research letters, we have shown extensive evidence that the Chinese economy represents the largest banking and currency bubble in modern world history. China is now facing its Minsky moment that is likely to lead to new historic levels of money printing and currency devaluation, as has been the fate of most other totalitarian, communist economic systems to date.
Global equities have rallied year to date on hopes that a US/China trade deal and a pause in Fed tightening can extend the business cycle. Never mind that historical busts from speculative valuations late in an economic cycle have led to significant bear markets. The last four of note in the US have ranged from 46% to 86%. Can we get by this time with a less than 20% one and no recession at all? We strongly doubt it.
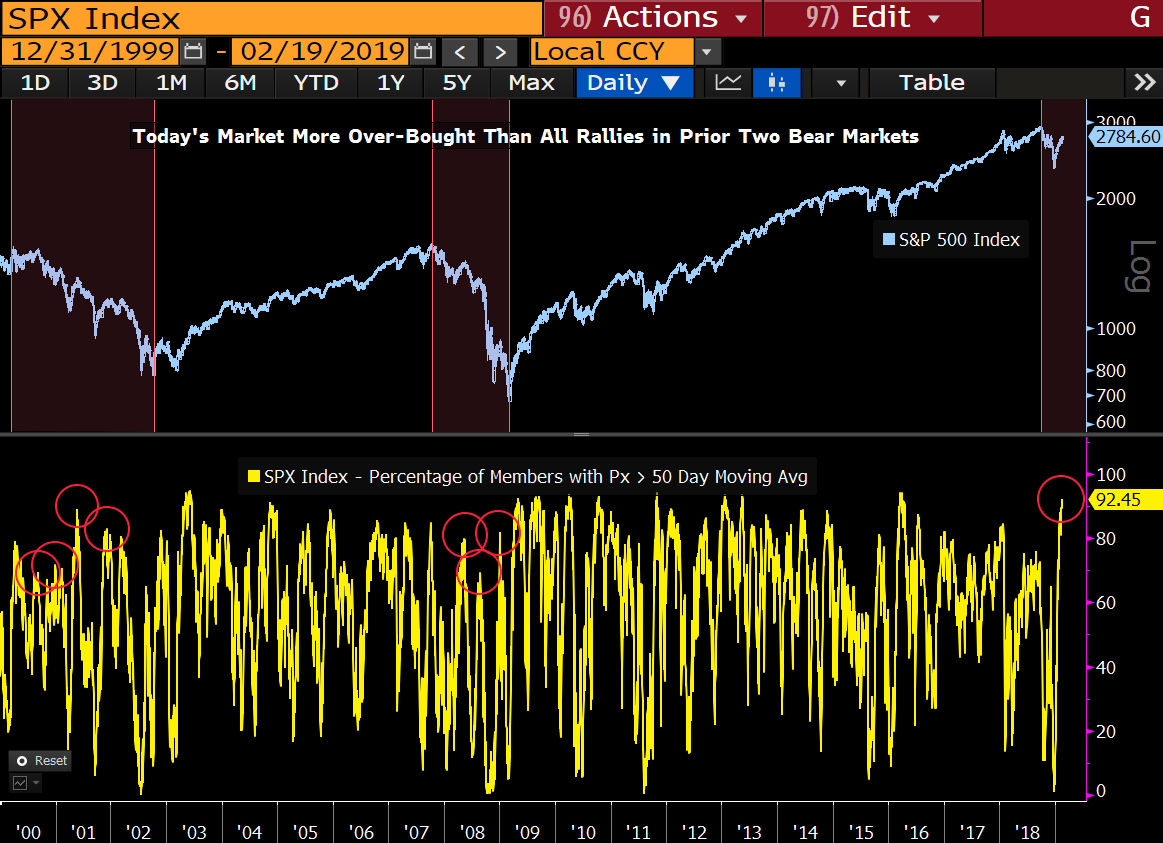
We are highly confident that what we have seen year to date in 2019 is nothing more than a bear market rally leaving US equity valuations still near record territory. Below, we show that today the US stock market is historically overbought compared to the last two bear markets and recessions based on the percentage of S&P 500 stocks trading above their 50-day moving average. We think this is a great setup today for selling stocks ahead of the next down-leg.
Source: Bloomberg
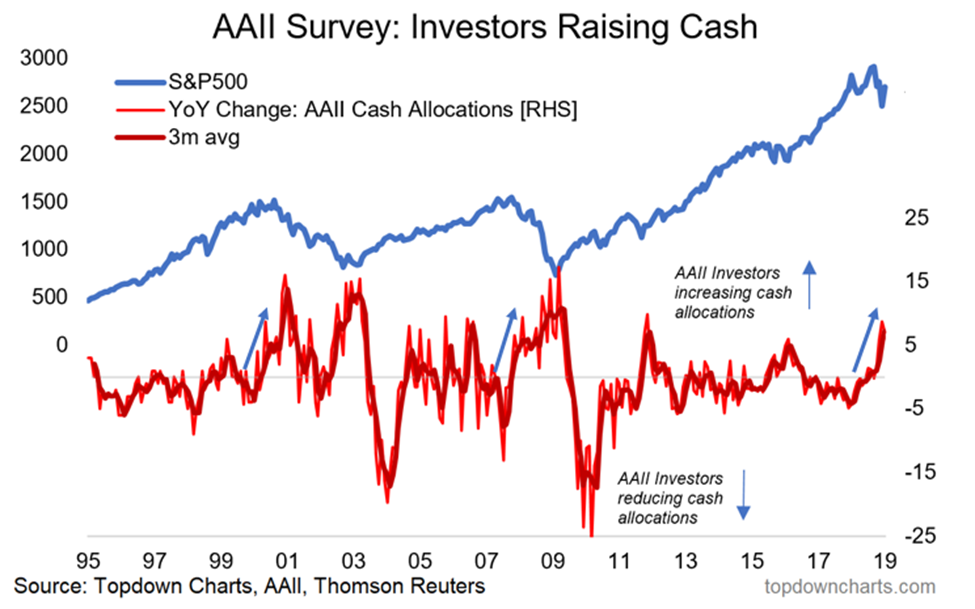
The new chorus of bulls behind the year-to-date run-up is claiming that the Fed's signal of a rate-hike pause is bullish. We disagree strongly. At the end of a long bull market and economic expansion, when the Fed pauses, it's an acknowledgement that we have finally reached the end of the cycle, and it is extremely bearish. There is no soft landing or extension of the business cycle when it is late in the cycle at record valuations and macro fundamentals are turning down, particularly after the Fed has been engaged in a long monetary tightening campaign. Investors are now raising cash after a long bull market. In the past, such investor selling has been the catalyst that kicks off bear markets and recessions as we show below:
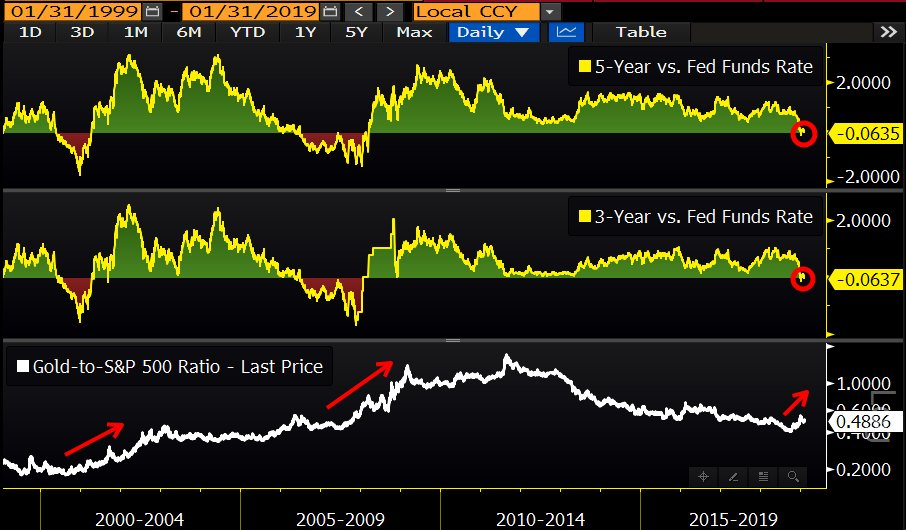
If one is looking for something to buy at this point in the economic cycle, we think one clear beneficiary is gold and gold mining stocks. To illustrate, note that both 3- and 5-year Treasury yields have recently just inverted relative to the Fed Funds rate for the first time since the global financial crisis and the tech bust. Such inversions historically signaled great times to get long precious metals versus a short in the S&P 500. Note that on the third panel of the chart below, the gold-to-S&P 500 ratio rallied every time the 3- and 5-year Treasury inverted versus Fed Funds. Here we are again:
Source: Bloomberg
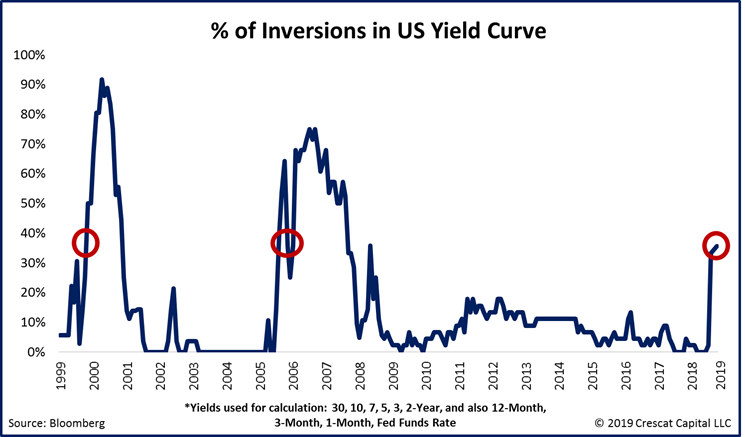
The US Treasury yield curve further goes to show that US equity and credit markets are in significantly different positions from the soft-landing scenario that played out in 2016. Our models show that the percentage of inversions across US 30-year to overnight rates is now at 33%! It is just as high as it was at the start of the tech and the housing busts. To put into perspective, this measurement did not go above 20% in Feb of 2016.
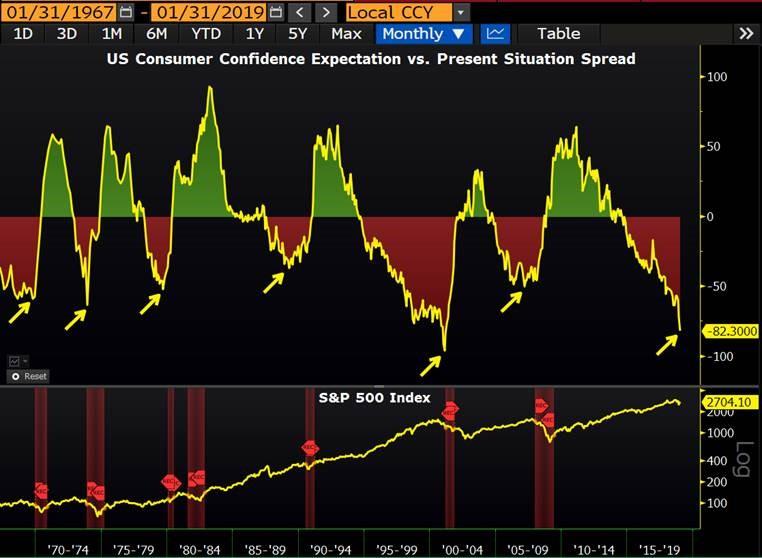
The following chart is another courtesy of John Hussman's work. We are also seeing the widest drop in consumer expectations vs. present situation since the Tech Bust. As we show below, we are close to an extreme today, and every other cyclical decline in this ratio in the past 50 years led to a recession.
Source: Bloomberg
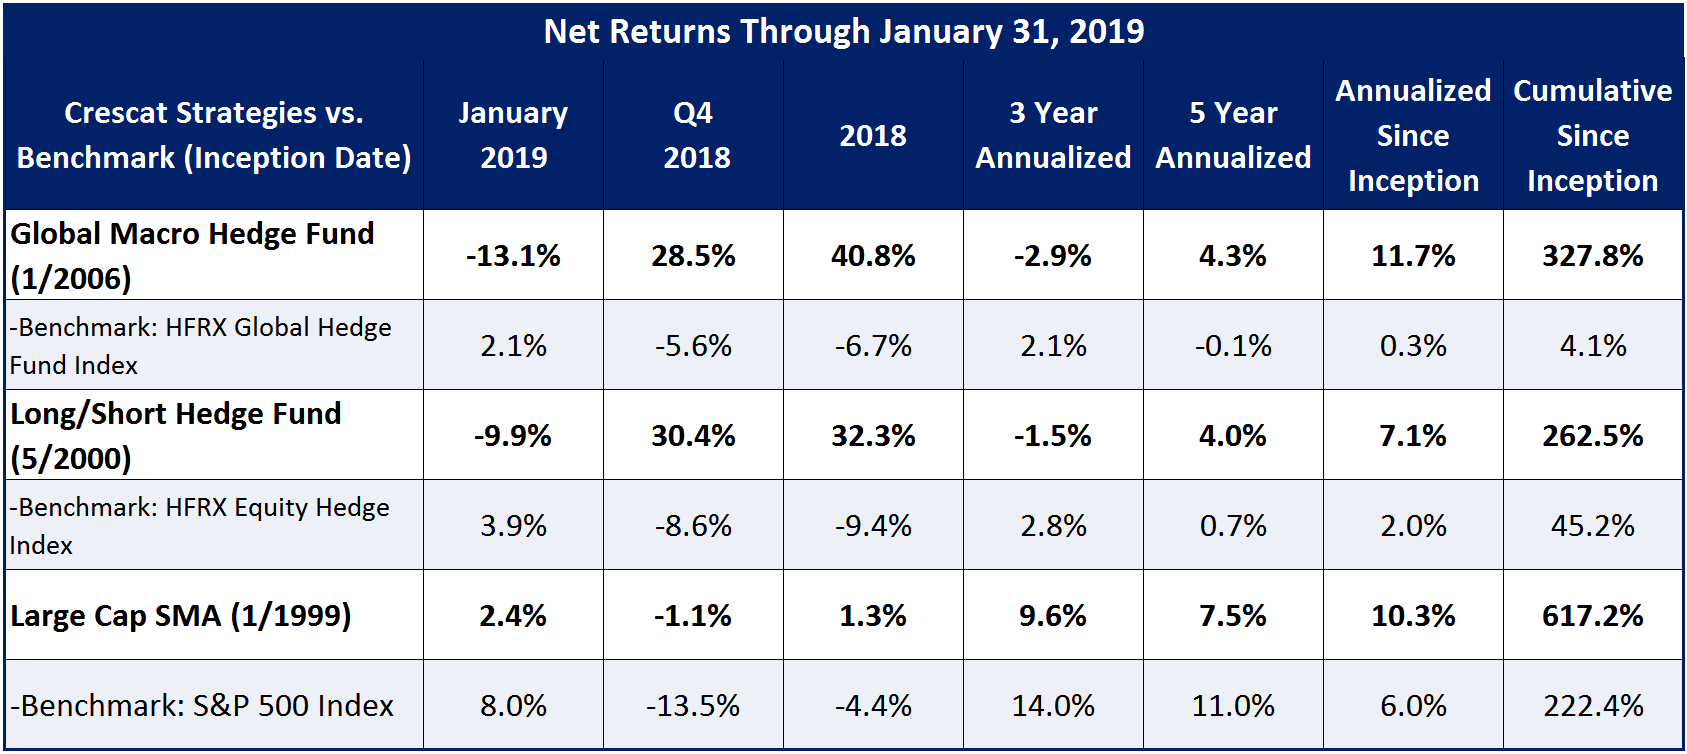
As one should suspect, Crescat's hedge funds have been pulling back in the is sharp bear market rally year to date. Crescat Global Macro Fund was down 13.1% net in January and is down another 5.9% net in February MTD. Crescat Long/Short Fund was down 9.9% net in January and is down another 5.5% MTD. In hindsight, our recent short-term mistake was to underestimate the strength and the length of the recent bounce in US stocks from the December lows. In our hedge funds, we took some profits in our short positions and added some long hedges in late December/early January after technically short-term oversold conditions. However, we unwound our hedges and re-entered shorts too soon given our high conviction in our macro and fundamental models that continue to call for tactically bearish positioning.
We believe there is a tremendous near-term opportunity to capitalize on a market downturn as record asset bubbles burst and the downturn in the economic cycle picks up steam. Our models indicate that the bear market has only just begun, and we are determined to profit from it. We believe in taking a moderate amount of risk in order to deliver a strong return which was key to our industry leading performance last year. We are confident it will work in our favor again as the rest of this year plays out.
It is still very early in the bear market, still near record valuations at the end of business cycle with much more to play out to the downside, and we remain net short global equities, short yuan, and long precious metals all within the construct of our risk model. Given our extensive research and current positioning, we believe the YTD pullback presents a great time to add money to our hedge fund strategies.