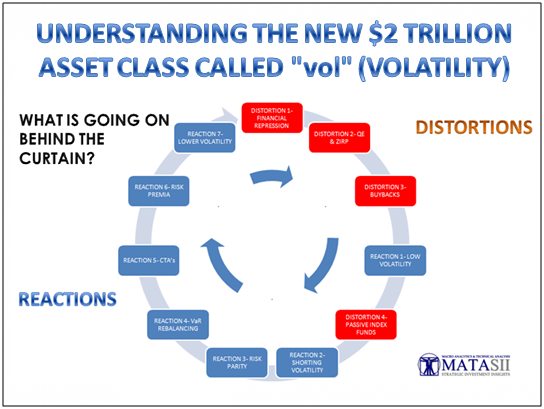
UNDERSTANDING THE NEW $2 TRILLION ASSET CLASS CALLED "vol" (VOLATILITY)
MONETARY MALPRACTICE
I put this schematic together not long after the 2008 Financial Crisis as we were witnessing the emerging approach the Federal Reserve was taking to its resolution. The last update of the diagram was in 2012 (note the 2012 copyright at the bottom) as Quantitative Easing I was rolled out.
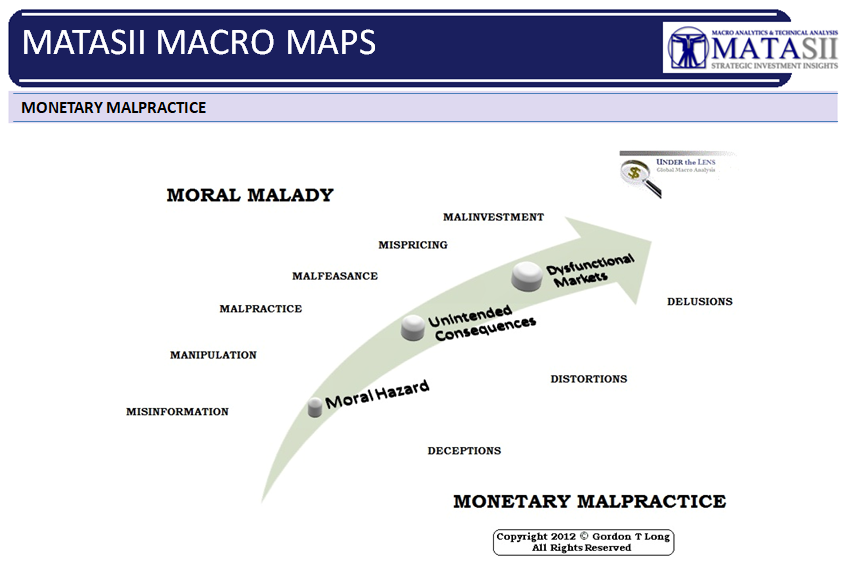
The chart has stood us in good stead in recognizing what was to be expected going forward and why.
As direct consequence of Moral Hazard and Unintended Consequences the Dysfunctional markets have delivered a new phenomenon that we would have fully expected to emerge.
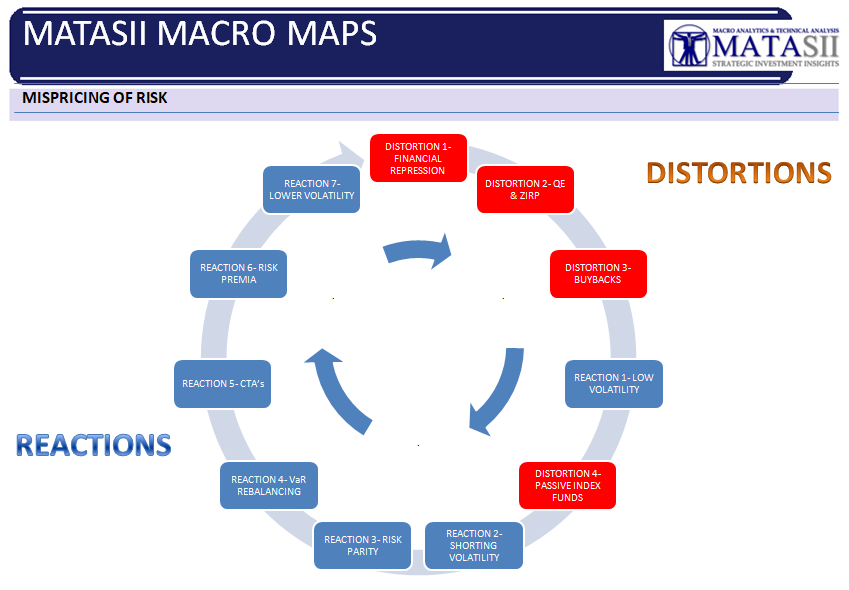
A SELF-REFLEXIVE FEEDBACK LOOP
There has emerged a dangerous "self-reflexive feedback loop" that exists between:
- Central Bank stimulus,
- Sustained Ultra-low interest rates,
- Data Signalling,
- Asset Volatility and
- Financial Engineering that is both pricing and allocating risk based on that volatility.
This is leading to what more and more analysts are recognizing as a "self-reflexive loop" where lower vol. feeds into lower vol. (abbreviation: Volatility) and has resulted in Volatility across asset classes being at multi-generational lows. The "Short vol" trade has become a dominate strategy for a very large segment of market participants. The "Short vol." is now effectively an investment asset class estimated to be over $2 Trillion globally in various Financial Engineered equity product strategies.
Unfortunately this loop, as so many loops do, can reverse violently. An unexpected market shock (such as inflation) can abruptly trigger this. The higher vol. that would occur would then reinforce higher vol.. This is now a massive, under appreciated risk in today’s market environment which is not being correctly priced in for "tail risk".
FINANCIAL REPRESSION
It all began with what is called central bank stimulus but which itself is only one element of the Macro-Prudential Strategy of Financial Repression.
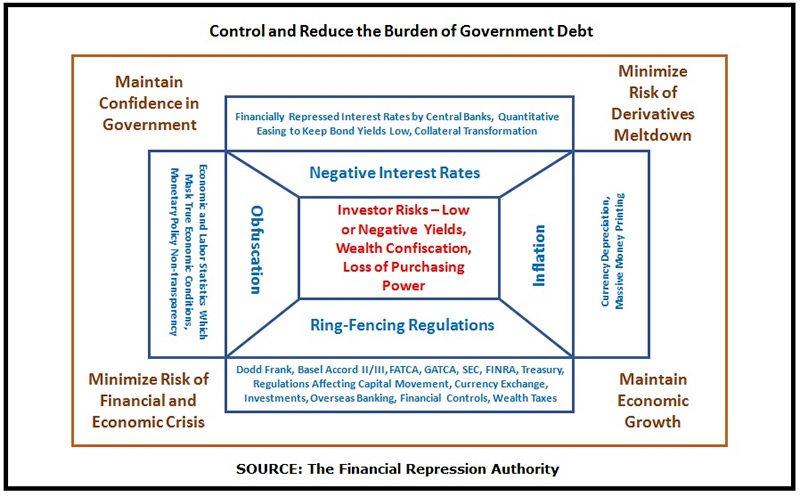
The Moral Hazard which has emerged is the mistaken view that the Central Bankers will always be there to support markets. Central Bankers will sacrifice the Equity Markets in a "heartbeat" if the Debt Markets are in trouble which is the mounting case today as the Debt Super Cycle completes its final stage.
Interest Rates today are at the lowest levels in recorded human civilization and $10 Trillion at even negative rates.
CORPORATE BUYBACKS
- QE brought Demand Forward but more damaging, exploded the Global Supply Chain to unprecedented levels of over-capacity and reduced Pricing Power,
- Excess liquidity and easy abundant Credit has lead to excess Investment Capital resulting in over priced asset acquisitions.
As a result, Corporations are finding that it’s not very efficient to reinvest in human capital, or CAPEX. Instead they are literally "eating themselves" as they buy back their shares. Corporations for the past 6-7 years have been levering their balance sheets by taking on cheap debt to buy back shares and pay dividends. It is conservatively estimated that 1/3 of gains, or about 30% of the share price gains, since 2009 have come from the share buyback phenomenon. We would already be in an earnings recession if it was not for share buybacks.
The fatal system flaw this has created is a price-insensitive buyer that’s always there to buy back the market. This "floor" has removed perceived risk and destroyed realized volatility. In effect the stock market is cannibalizing itself quite literally, and this is having a pronounced effect on lowering vol. I think we’ve had some of the most mean-reverted markets in history – the idea that vol is low is not surprising. That’s happened before.
But one of the things we’ve been seeing is that every single time volatility jumps it mean reverts immediately. And that’s actually quite unusual. Because volatility tends to cluster. This has been driven by some of the share buyback effects.
So, beyond the blatant overvaluation of the market, and the fact that price multiples that are not affected by the buybacks, that are not – The price-earnings ratio is something that people oftentimes put out there and say, oh, the stocks are not that expensive on a price-earnings ratio or P/E growth ratio.
If you look a market capitalization to GDP ratio, if you look at an enterprise value EBITA ratio, if you look at price-sales ratio, ratios that are affected by the buyback phenomenon, P/E ratios are manipulated by the buyback phenomenon. But the buybacks will funnel through to something like enterprise value EBITA ratio. We are seeing across all these multiples some of the highest overvaluations since 1928, 2007, and the late ‘90s.
So, really, the buyback phenomenon leads to a situation of a greater fool where the market keeps going up and up and up, quashing volatility.
If we end up seeing a collapse in buybacks – either due to rising interest rates, which would make it unprofitable for companies to continue to do this phenomenon – if we see a situation where there is some shock to the system and/or credit ratings of companies begin to come into peril as a result of rising interest rates and are not willing to continue to issue shares to buy back their debt – then the buyback dynamic may die down.
With the tax reform that’s happening, it’s unlikely to happen this year.
We will come back to Share Buybacks in a moment when we discuss the "Implicit Short Volatility Trade".
First however lets consider the scope of the Short Vol Trade itself.
SHORT VOL TRADE
This has led to the out-performance of:
- Short volatility trades.
- Passive funds and indexation.
- Various strategies that use financial engineering in some way to bet on market stability (introducing A kind of a short Gamma
effect into the market). These could be strategies ranging from everything from risk parity to vol-rebalancing funds.
This is all great as long as volatility is low or dropping, as long as markets are stable. But, in the event that we have a reversal in this, there’s two trillion dollars of equity exposure that
self-reflexive-driving lower vol can reverse in a quite violent way.
If you look at short volatility and you think about what volatility really is – it’s a bet on stability. And when you’re betting on stability, that’s a myriad of different bets. Part of that is the expectation that markets remain low volatility or low realized volatility. Part of that is short Gamma – so there is this implicit short Gamma exposure.
Part of that is a bet that:
- Correlations remain stable,
- Or that different market relationships remain anti-correlated with one another,
- Or that implied correlations are dropping,
- Or realized correlations are dropping,
- Or interest rates remain low or go lower.
So if we look at each of these different factors, these are the risk exposures that you will have when you own a portfolio of short options. And, if you own a portfolio of short options you are
short:
- Vega,
- Gamma,
- Correlation,
- Interest rates.
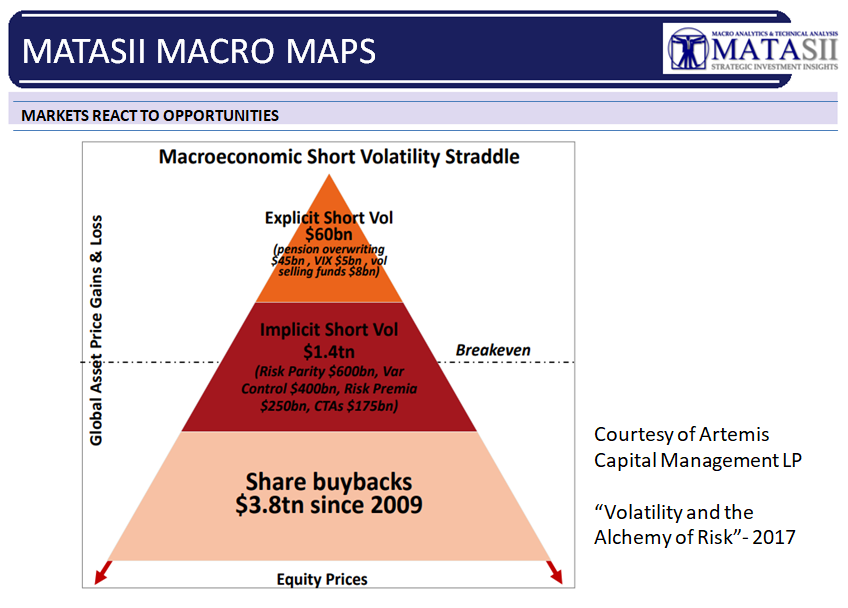
What we’ve seen now with this short-vol trade, explicitly and implicitly, is that various financial engineering strategies out there that have become dominant in the marketplace – we’re talking about the largest hedge funds in the world employ these strategies – that are just replicating the exposures of a short-options portfolio. And of course the VIX trade gets a lot of attention, but it’s the smallest portion of the short-vol trade. This is what is called explicitly shorting volatility. This is where you’re literally going out and you’re shorting an option. Or you’re shorting a volatility future. But in the VIX space, that’s only about $5 billion worth of short exposure. You have about $8 billion of vol-selling funds, according to Bloomberg. And then about $45 billion (estimated) in pension over-writing strategies, these short-port or short-call strategies the pensions are doing.
So, in total, there’s about $60 billion of explicit short volatility. Which is big. But that’s not the most concerning aspect.
THE BIGGER IMPLICIT SHORT VOLATILITY TRADE
The bigger aspect is this $1.4 trillion in implicit short volatility strategies. These are replicating the exposures of a portfolio of short options, even though they may not be directly selling derivatives or directly selling optionality.
For example, we have about $600 billion worth of risk parities out there. Equity exposure to risk parity. Risk parity is a strategy that’s short Gamma and short correlations. We have about $400
billion of vol-control funds out there. That’s a short Gamma strategy. About $250 billion of risk-premium strategies. And then there’s the equity exposure of CTAs.
So, these are strategies that have elements of short-volatility trade embedded in their equity exposure.
Corporate Buybacks
At the bottom of the short-volatility trade is the $3.8 trillion worth of share buybacks that have occurred since 2009. One might look at share buybacks and say, wait a minute, that is not a financial engineering strategy. That’s not a short-volatility strategy. But let’s think about what share buybacks do.
If you’re a corporate CEO, you don’t have the ability to generate growth. You can’t generate sales. And you want to get your bonus. So if you can’t generate earnings, if you can’t help your top of the line, what you can do is reduce the number of shares. And this will artificially increase the EPS so you can hit your bonus target.
You go out and you issue debt and you buy back your shares. You’re leveraging the company up – which means that you’re exposed to interest rates, you’re exposed to market stability. And then you’re buying back your shares, resulting in a price-insensitive buyer that is always underneath the market, resulting in this price-insensitive buyer always buying on market dips.
So, the result of this is that you’re artificially reducing realized volatility. The strategy is always to buy on dips. That is part of the replication strategy of the short-variance swap. Literally it’s part of the replication of shorting vol.
When you add all of this exposure together, we have this self-reflexive short straddle of financially-engineered strategies in the market. And this really comes out to about $2 trillion worth of implicit and explicit short-volatility strategies. And then you can tack on the share buybacks. To some effect that is resulting in this.
Leading into 1987. Portfolio insurance comprised about 2% of the market, leading to the Black Monday. And that was a reflexive strategy. Today anywhere between 6%–10% of the market is comprised of these self-reflexive implicit and explicit short vol strategies. And this should be concerning.