Back in October 2017 we offered an idea for the USD, indicating the potential for a little more up and then another significant drop. This aligned with our potential Elliott Wave count of wave 4 completing and another drop, wave 5, to go. Here is the chart given at the time:
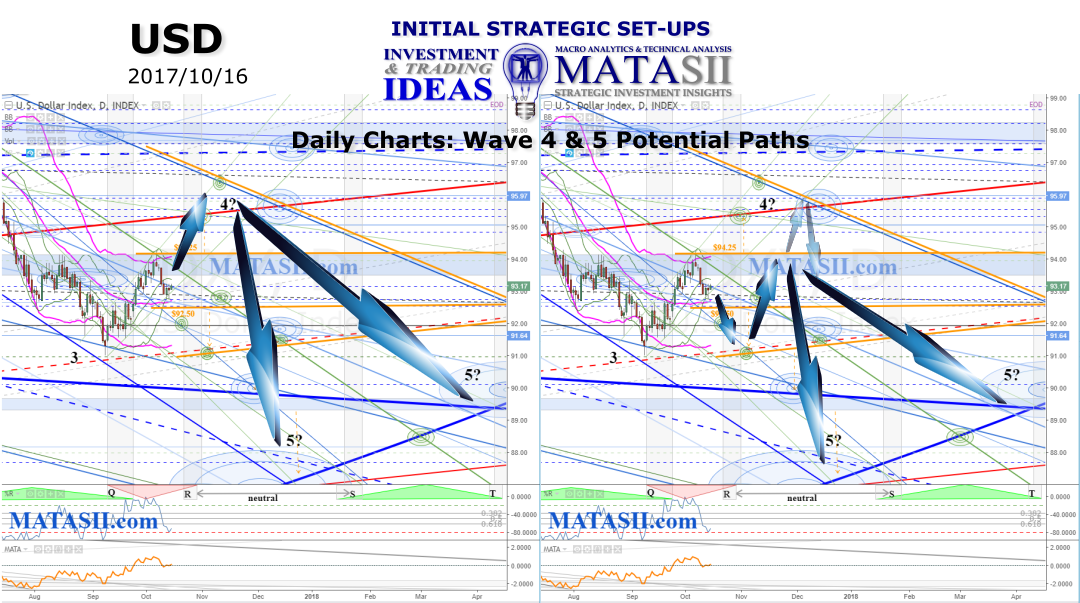
USD next paths to watch for, posted 2017/10/16
Here is where the market sits as of March 2nd, 2018:
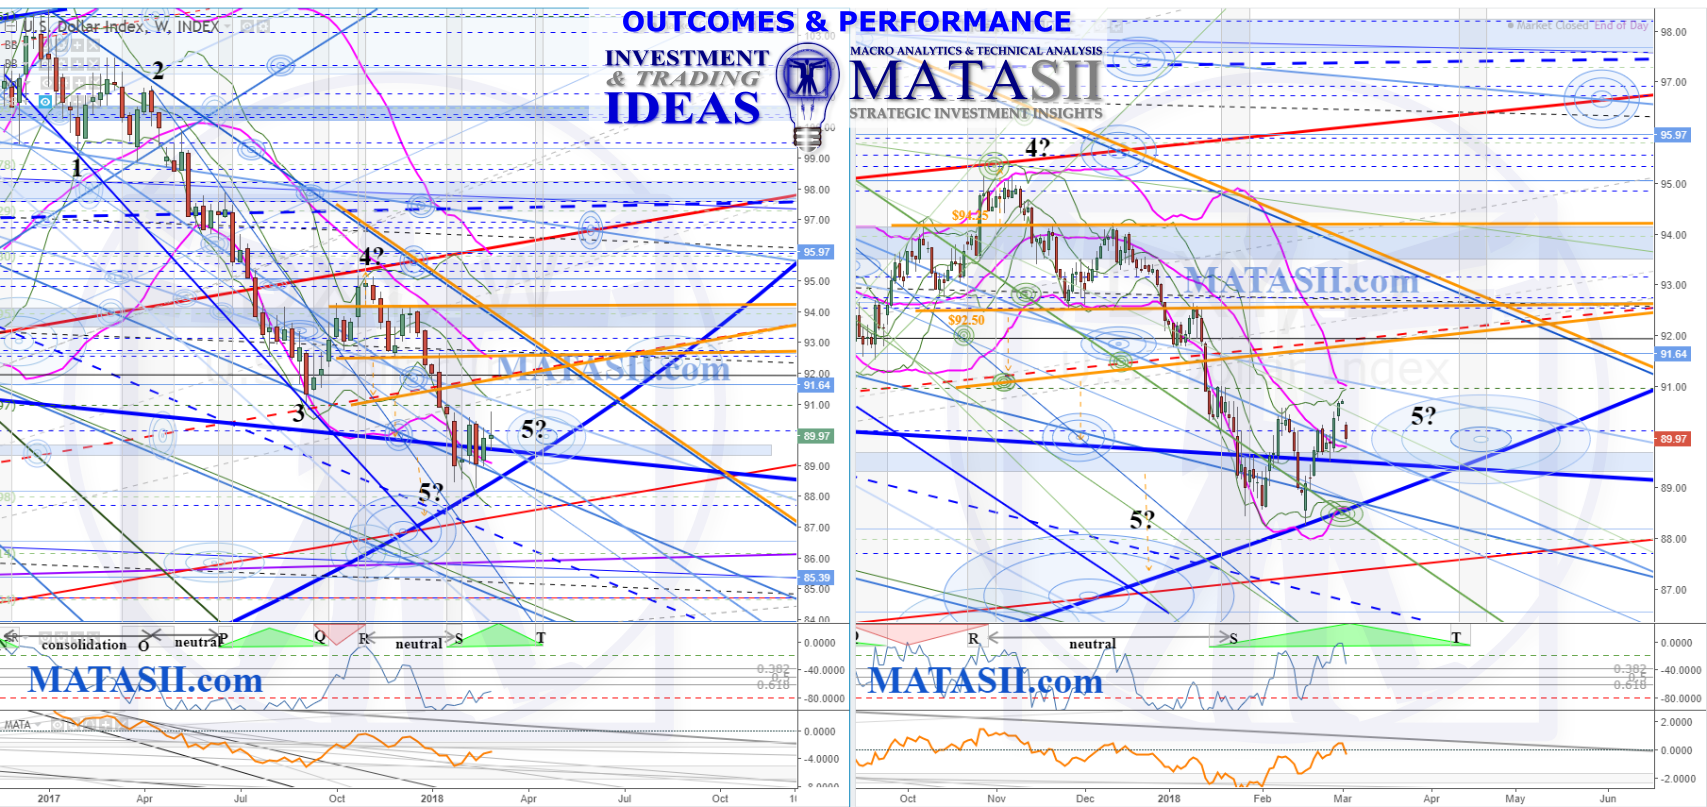
We can see the market gives us a little more lift, just touching a daily target (green, right chart, near 4?); and then falls off. The drop takes a little more time, moving the market over to the right, and just misses a weekly (blue) target by a few days on the way down.
Note the solid orange highlighted technicals given: these are offered as potential technical trigger considerations and any could have been used as the market bounced around as it dropped.
Where to next? Although we have now reached the levels where 5? could be ending, it appears that another drop is still to come. Note that inside the 4? - 5? (5th wave) on the weekly (left) chart we can see another 5 count, with the current market in the 4th wave. This suggests another 5th down to go....
Stay tuned! We are currently updating our USD charts and will be posting a new idea, giving new technical trigger considerations and potential targets to look towards.