Our recent USD technical update showed a potential for the drop since the beginning of 2017 to come to an end. Several significant technicals can be seen near the current market location and there is a possibility for the USD to find support some time in the near future.
Here is a look at a previous update and the current USD.
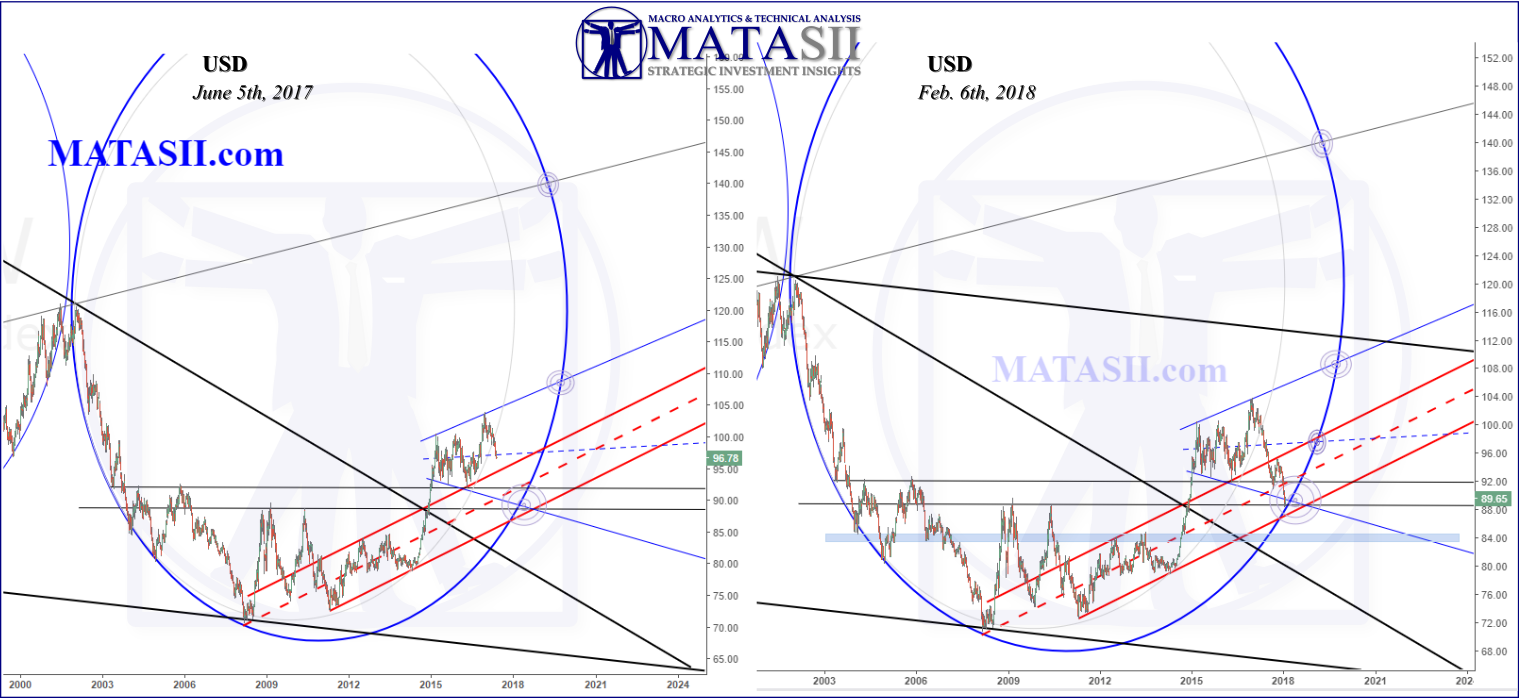
Note that the current market location has reached a long term target and several potentials for support can be seen. A reversal could happen at any time; as well there is still a little room left for another down to reach the bottom red channel support trend line. Overall the USD is at a critical juncture: holding the current technicals could see a drastic lift, while breaking down through them could see another drop, potentially to the blue s/r zone below the market (where we would once again watch for potential support). IF these all fail, then we would be looking much lower for the USD: towards the black trend lines that can be seen below the market.
Breaking or holding the technicals here could be significant, and the resulting move could be dramatic, up or down.
As the USD does not move in isolation, we would expect to see other markets react or have moves of their own. Similar to how we can see the potential moves from the USD in the technicals, we should see other markets setting up as well.
Let's take a quick look at a few markets to see if this is the case.
EURUSD

This long term weekly view shows the EURUSD in a large blue channel that started back in 1995. The drop in the USD the last year can be seen here as the the last lift from the bottom blue channel support.
The red dashed box is highlighting the current market location and nearby significant technicals; the technicals are highlighted with orange. [Note all charts follow the same format]
Note the large wedge pattern: ABC. The EURUSD has lifted to the base of the pattern (s/r trend line CB). This is a significant technical that the market has come back to retest. Note that more lift could occur and the market would then be at s/r trend line AB, the top resistance of the wedge pattern. Either of these could hold the market and reverse it back down to the large blue channel support or lower (note the channel from AB and parallel blue trend line). IF either of these fail, then there is a chance for more significant lift: to the middle blue dashed s/r of the larger blue channel and then back to the top of the channel itself.
It looks like the EURUSD is also near significant technicals, breaking or holding them could be the start of the next large move from the market.
USDJPY
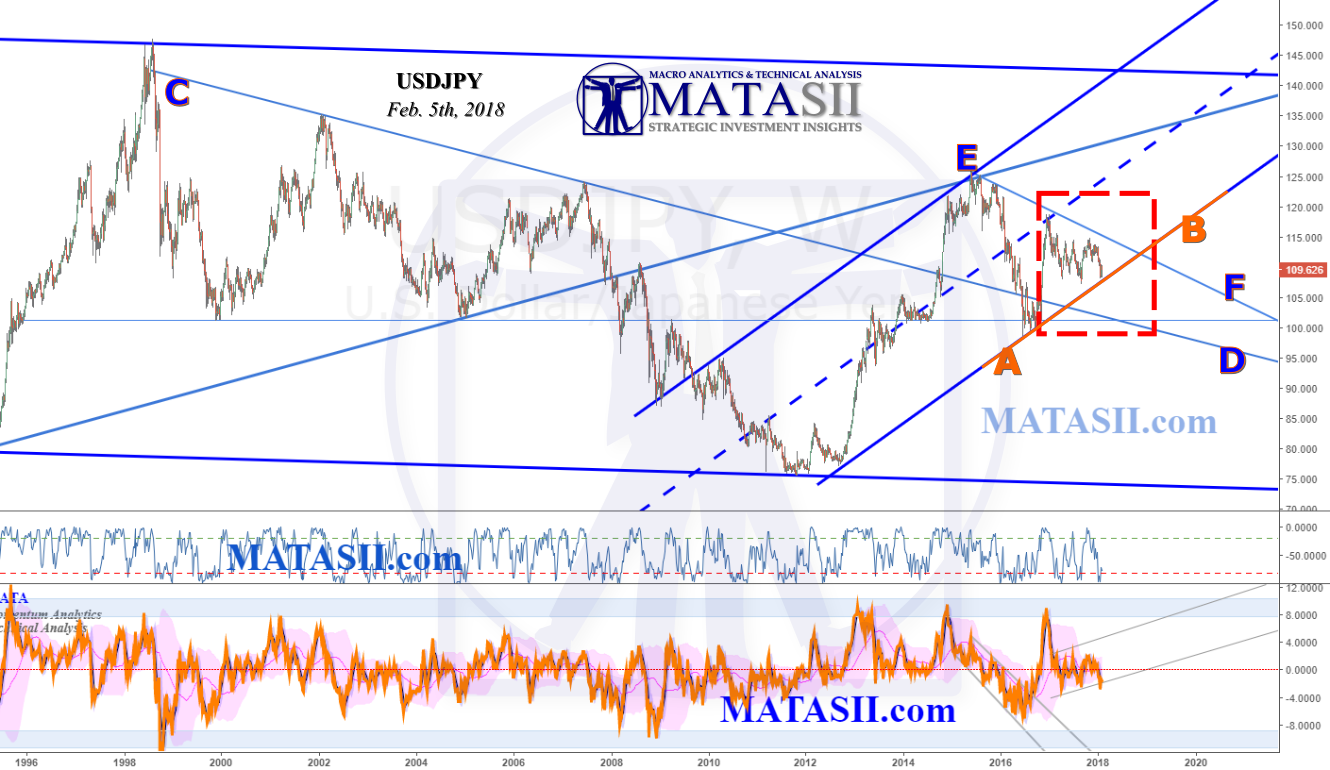
The long term weekly view of the USDJPY shows a large blue channel starting back in 1995. The 2017 drop from the USD can be seen as the last leg down that now almost touches highlighted s/r AB. Again we see a market at or near significant technicals, breaking or holding (AB) could result in the next move for the market.
USDCAD
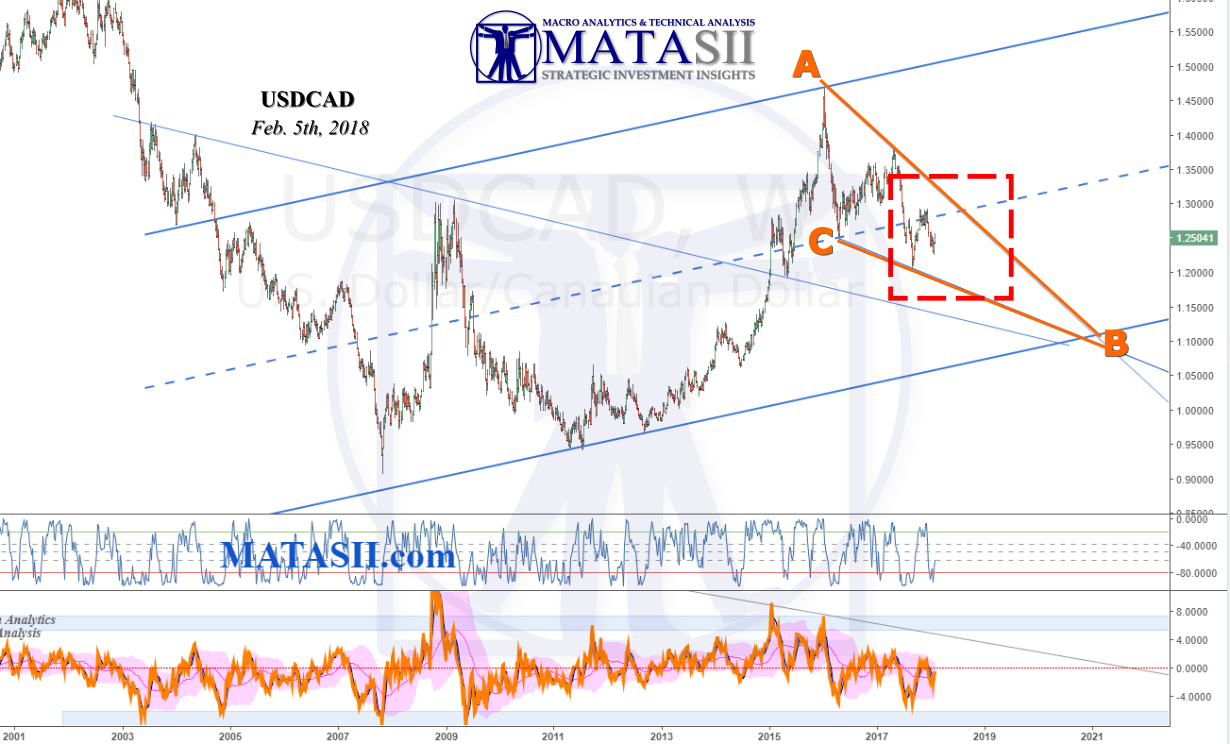
Trend s/r's AB:CB are forming a wedge, the current market is sitting about 1/2 way inside; the last drop inside the wedge starts around 2017. This market isn't sitting at the larger significant technicals as we have seen from other charts, however it suggest a little more movement (in either direction) would have the market at the wedges edge, looking for a break or reversal.
Pure speculation: a possible scenario could be for this wedge to play out with 5 waves, currently in the middle of wave 4 (or D) - the end of which could be the top AB s/r of the pattern; with another drop, wave 5 (E) to the lower s/r CB. Finishing the wedge pattern with an ABCDE and then lifting up and out, on its way to the top blue channel that can be seen from 2005. I go through this potential as it mirrors a similar possibility from the USD. We could still have a little more down to go from the USD (noted wave 5 or E above for the USDCAD) and then a significant lift (break up out of the wedge pattern given here).
EURJPY
So far the previous comparisons have been with USD crosses. How about one that isn't crossed with the USD?
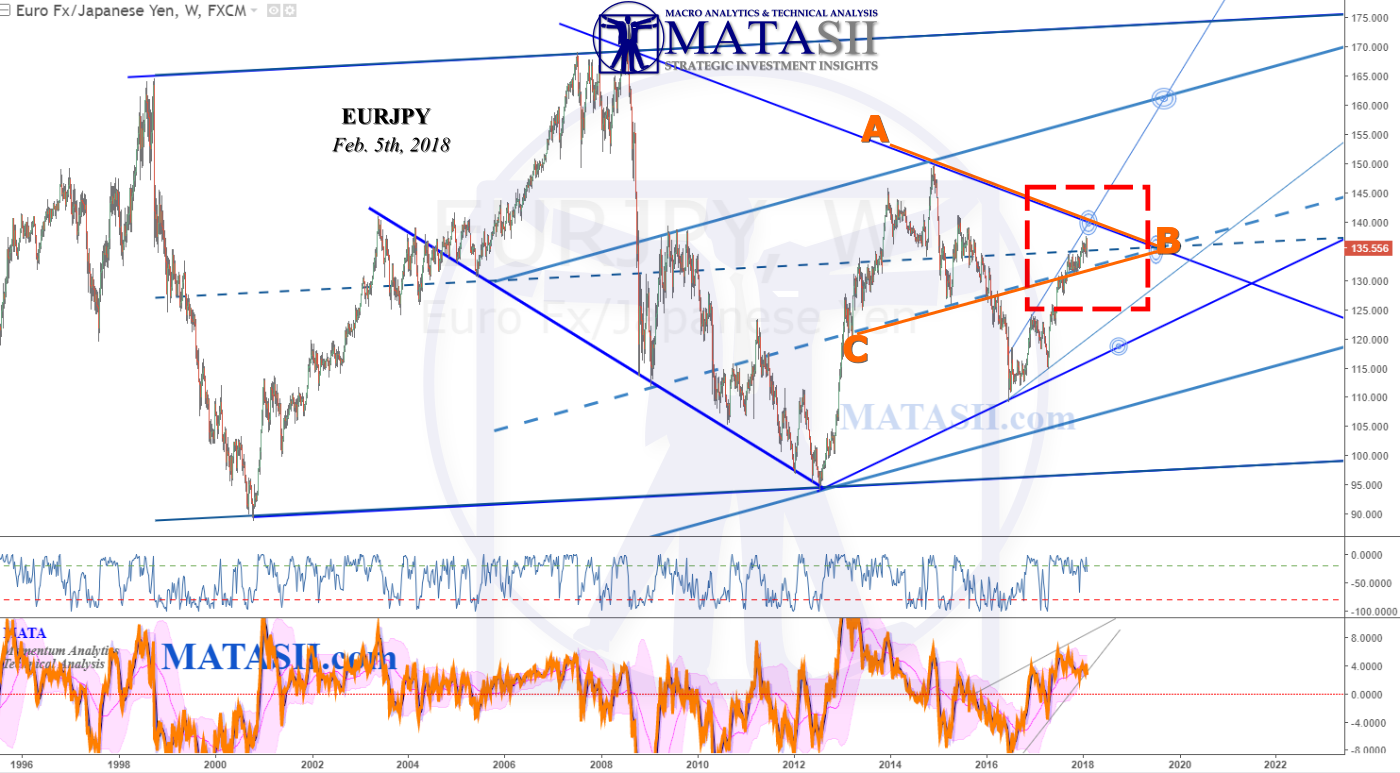
The 2017 USD drop can be see here as the last leg / lift in the EURJPY off a blue s/r. Note there is still a little more room left to break AB. Lifting up through AB or dropping off and falling through CB could then see the next significant move from the market. Again we see the market at or near significant technicals.
GOLD
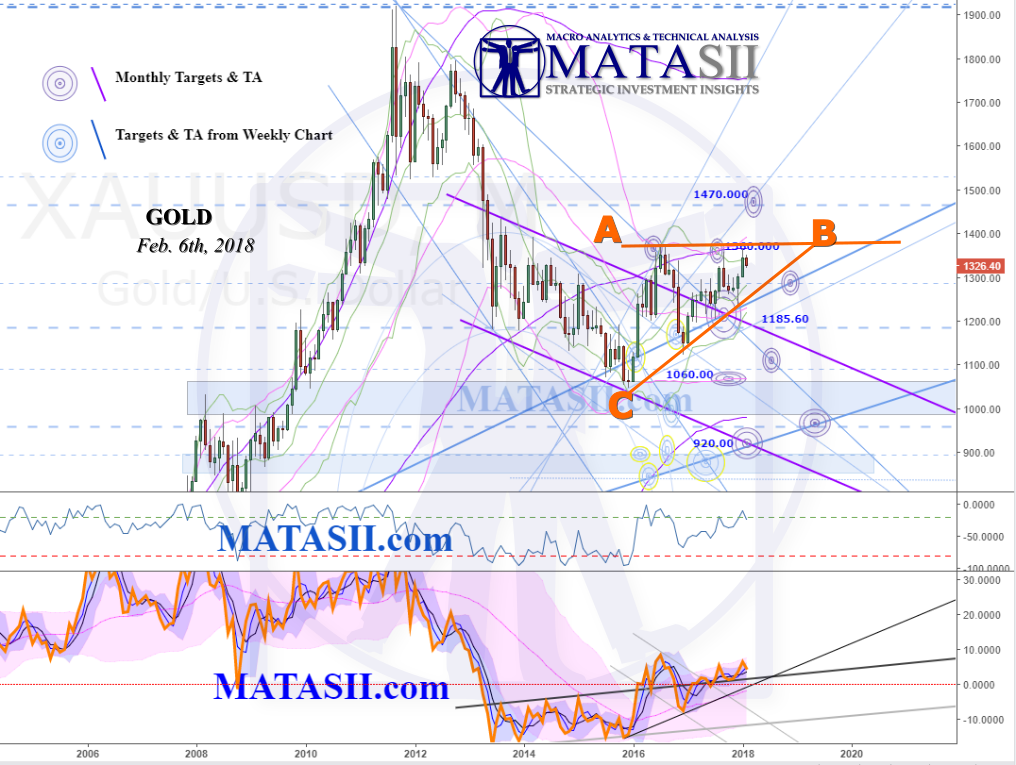
Hey another wedge! Room left in either direction, breaking AB or CB could see at least a $100 move or more. While I do have AB as the highlighted technical to watch, if the USD move a little lower still, we could see Gold move up to the 1470 target, then fall off again as the USD finds support and lifts. Just a possible consideration.
Conclusion:
Several different markets have been given here, with the idea to see if there is any correlation (technically) and if they in some fashion line up with what we are seeing in the USD. In all the examples given the markets are at or near significant technicals, similar to the USD.
This gives more supporting evidence that potential shifts or extreme market moves may be seen in the coming months.