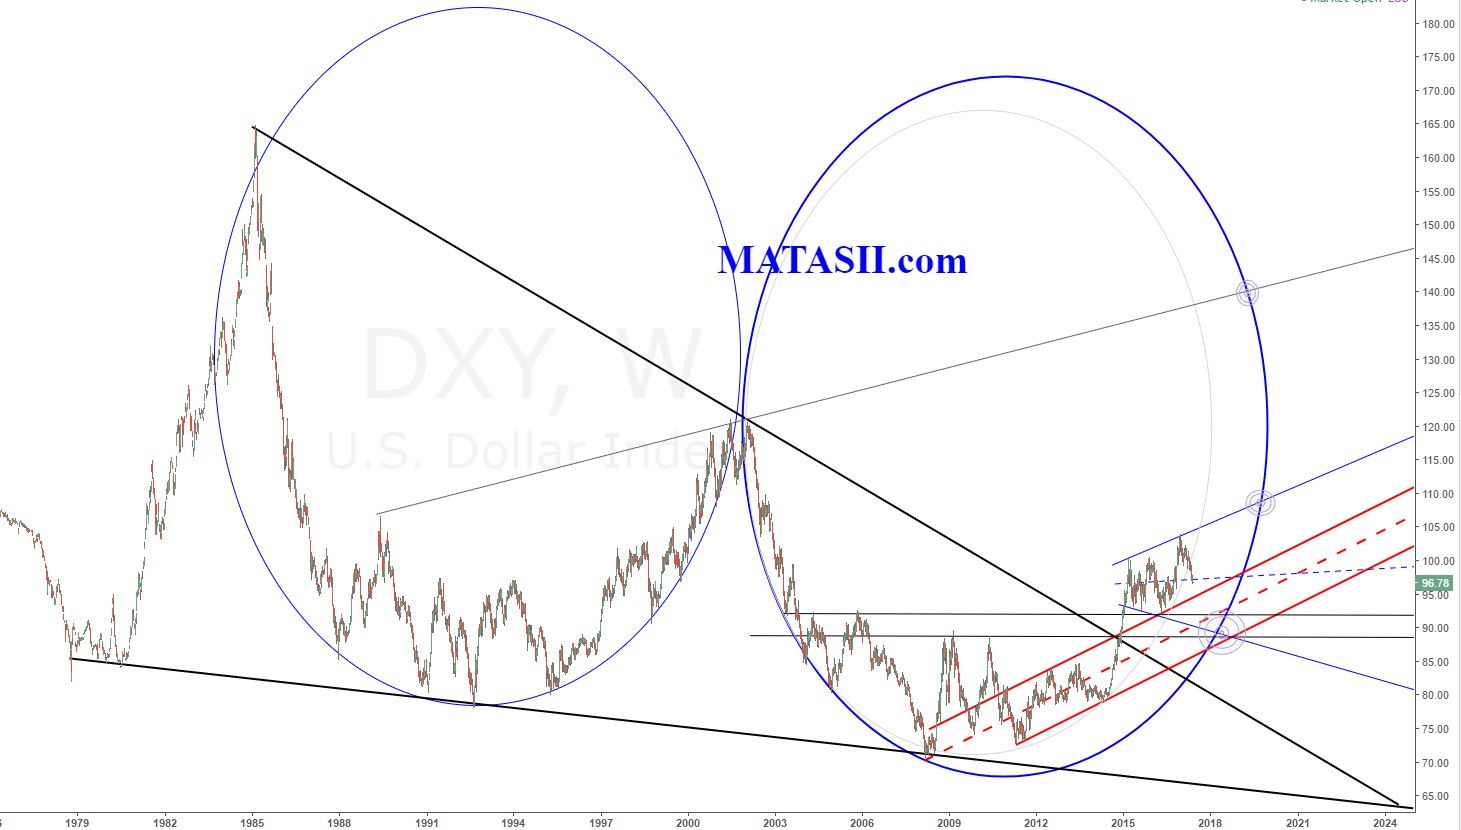
Long Term Weekly View
This is a perspective we have been following for a few years now. Both blue ellipses are identical, the second a copy & paste of the 1st, moved over and down slightly. Although the lift from 2009 is no longer riding the ellipse edge, this edge is still a significant technical and the market may be trying to get back and touch it again. Note that the lift from 2009 is curved and actually fits inside a smaller ellipse (grey). The market bounced from this several times - however it has now just broken. The current consolidation pattern that can be seen to have started in 2015 could be an expanding wedge - as shown in blue on the chart. IF this is occurring: the market has just come off the pattern resistance; a move back down to pattern support would be normal. We can see that move could drop the market significantly, where it would not only meet the bottom blue pattern support, but also several other technicals also converging at the same area, including the larger blue ellipse edge. IF this occurs, it will be a significant drop of the dollar over the next year, taking it down to around $89.00 by April 2018.
It must first however break down through the the next technical that can be see coming up: the top s/r of a red channel that started with the lift in 2009. The last drop from the market, inside the current sideways expanding wedge, touched this once already. Watching to see if it again makes it back to the top of the channel, and then how it behaves from there: we would expect to see another market reaction. This is a critical technical, if it breaks then the market is now back down inside the red channel from 2009 and a drop back to the channel support is not unreasonable. However, if the red channel holds and the market finds support from it, then we could see another significant lift from the market through to Sept 2019, potentially reaching$110.00 +. (There is also another extreme technical possibility that says the USD could see a drastic lift, potentially reaching $140.00 by April 2019. We would need to see a strong break up through the current wedge pattern for this to actually happen).
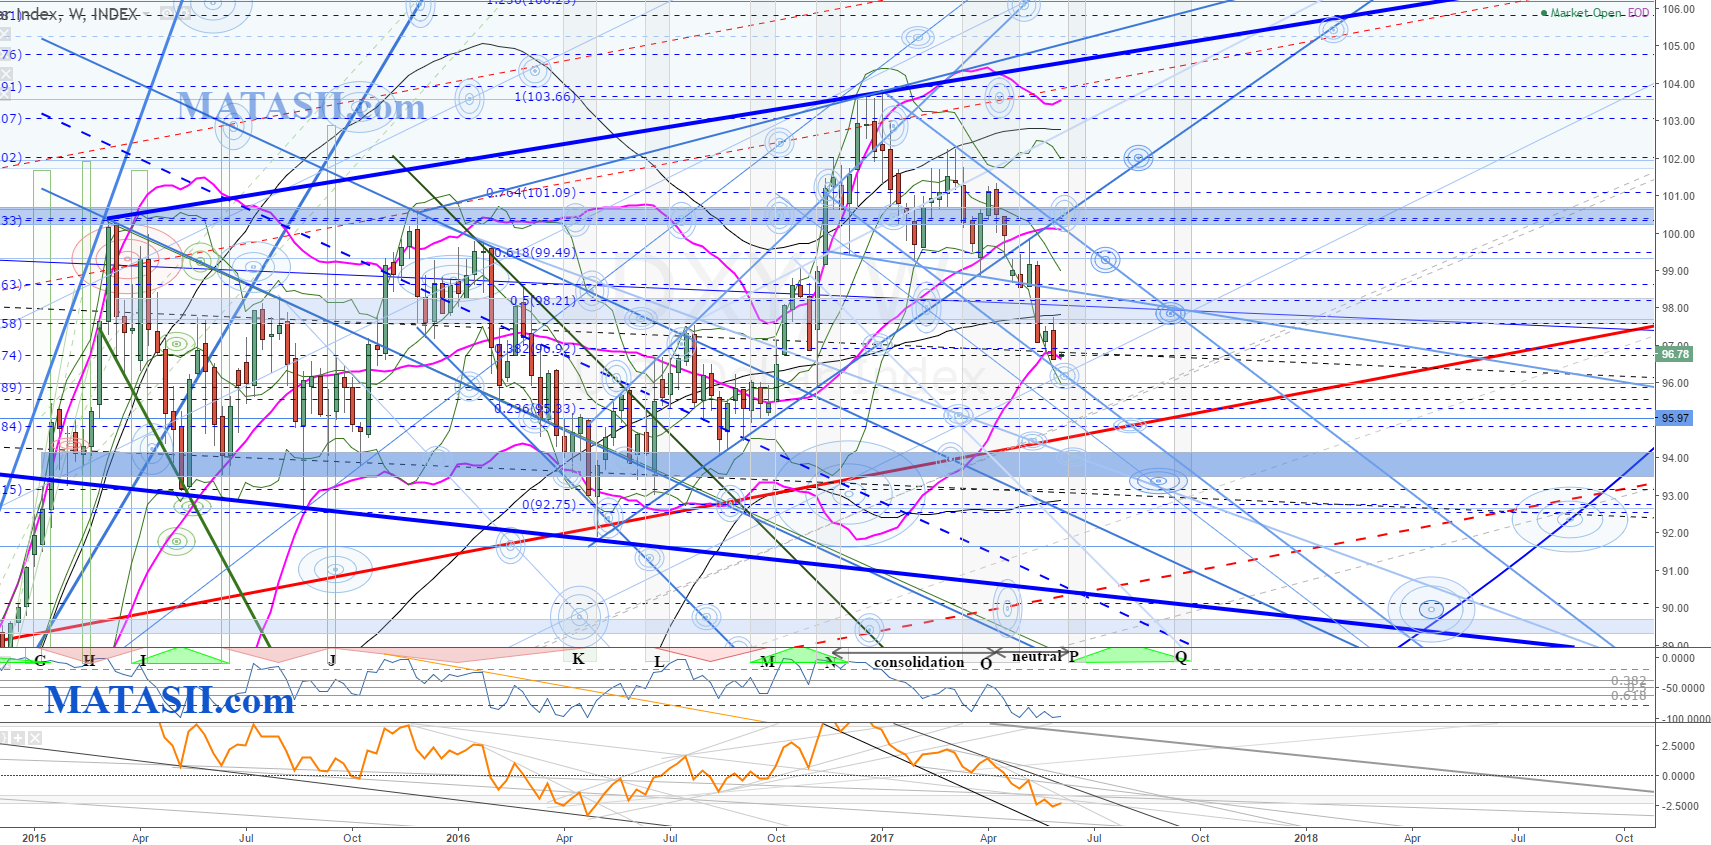
USD Weekly
Here we can see the current sideways consolidation that started around 2015, the bright blue s/r's showing an expanding wedge pattern. The red line is the previous red channel top from 2009 noted above. The drop from the highs have done so in a channel; the market is currently sitting at the channel support, as well as the LBB and several other technicals. We could see a potential bounce here as it continues to move within the channel. The last drop inside the channel has been steep, if we see the market break down through the channel support, then this would represent an increase in downward momentum and potentially lower levels to go. A break up thorough the channel the market has been dropping in is needed to consider a change of trend.
We are watching to see if the market reaches the red s/r again, and if it holds or breaks, as discussed above. In the bottom right of the chart you can see potential targets, these are along the ellipses edge mentioned above. We are potentially coming in to Positive MACRO Bias, and could see the market bounce around and consolidated at the red s/r for a while before it actually breaks (if it does).
Support at any time, and a break up through the current blue channel the market has been dropping in, could then see a lift back to retest previous technicals, potentially new highs, and the top bright blue pattern s/r. Note that the top of the blue wedge pattern s/r and the top of previous red channel create a potential channel.
(click charts for full size)
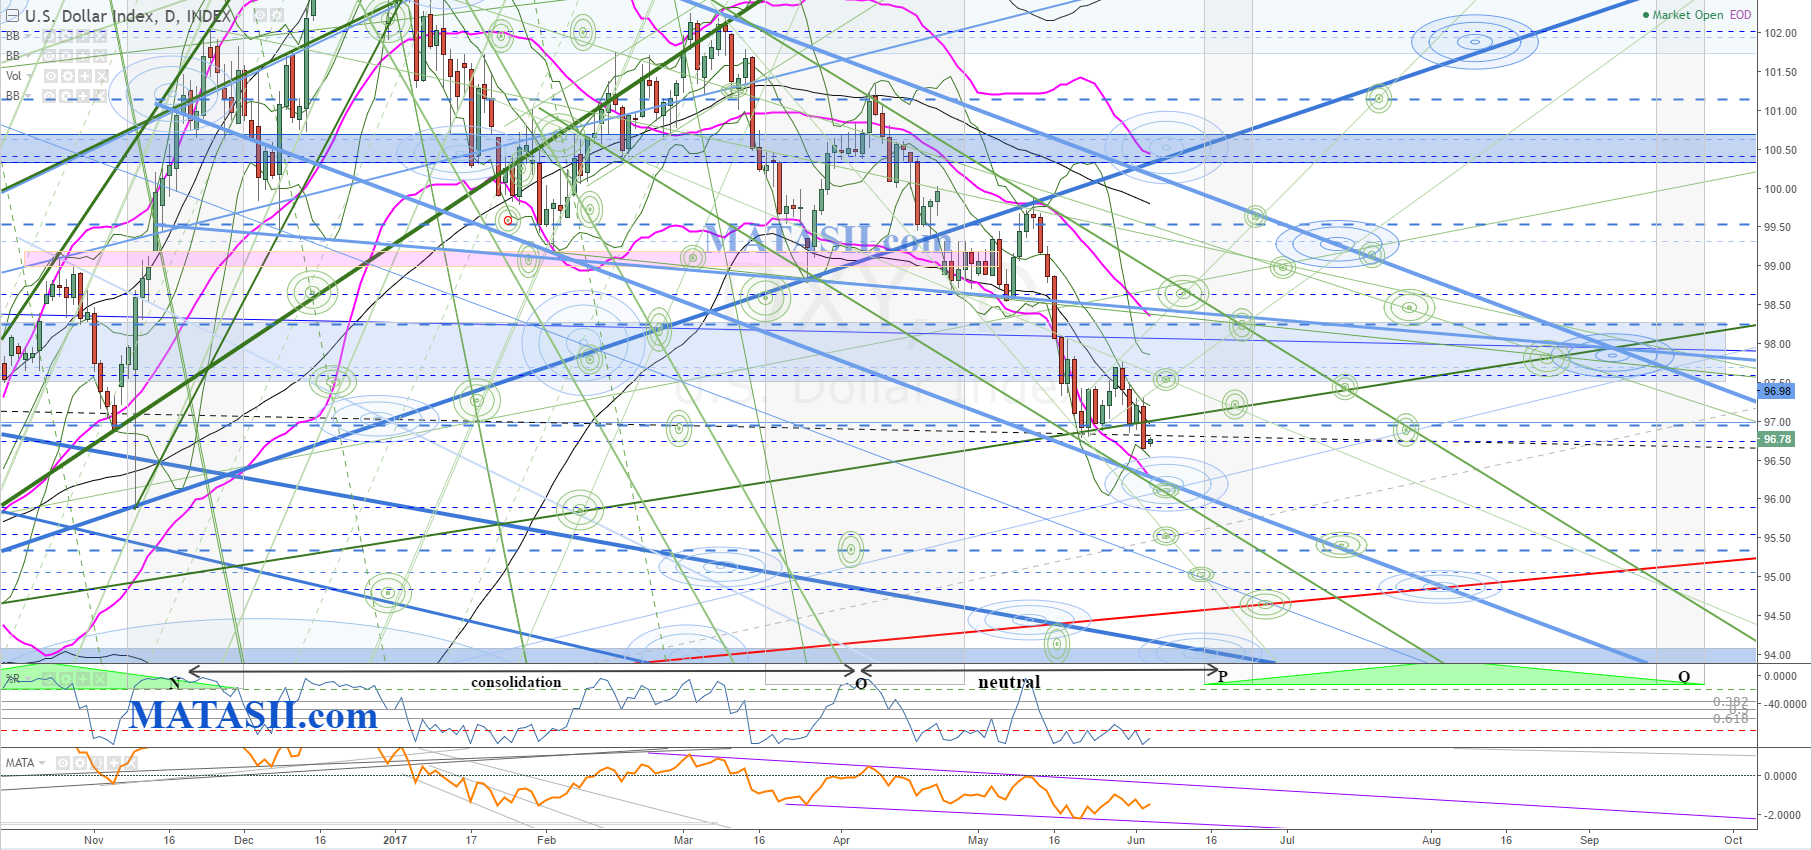
USD Daily
The daily gives us a closer look at the recent market drop and the blue channel it has been falling in. Note that the drop-off inside the channel appears curved - IF this continues it suggests a break down through the bottom of the blue channel could occur, and the market could have a quick drop. Otherwise we are looking back inside the channel to previous technicals for resistance and a continuation of the channel. Note the green channel inside the blue, breaking this would be our first warning, however the blue channel is also needed for a change in trend to have occurred.