Long Term View
Last update we reviewed a perspective we have been following for a number of years :
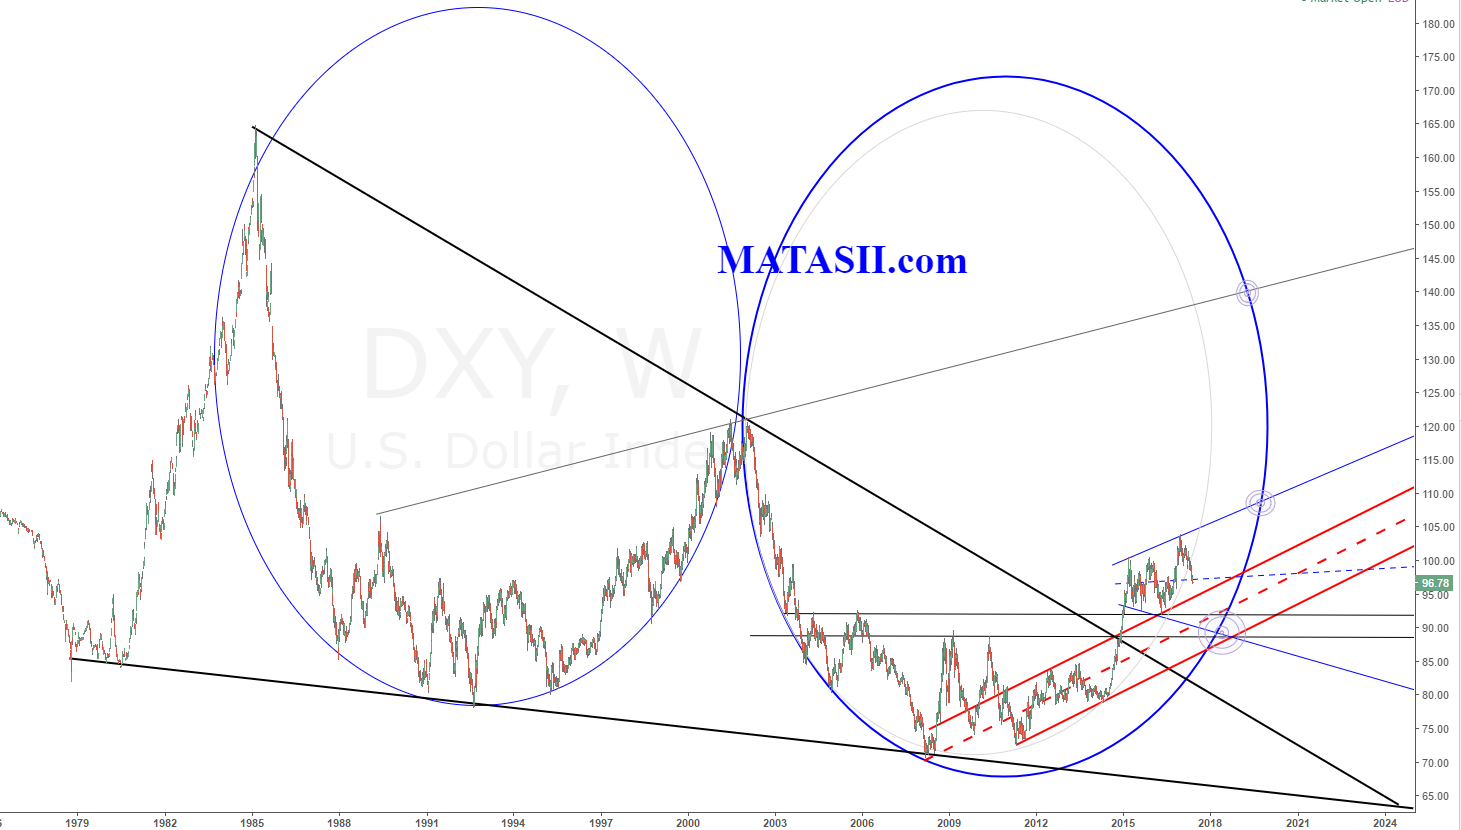
Of note are the two large ellipses: these are identical, with the ellipse on the right being a copy of the ellipse on the left, shifted over and moved down slightly. Also to note is the current market location and the technicals that can be seen around it. Last update we were watching for a potential break of the middle blue dashed s/r that is inside the expanding wedge structure and held the current market. Breaking this would have us looking to the lower support of the blue wedge, red channel, and ellipse.
Here is the current view of that chart:
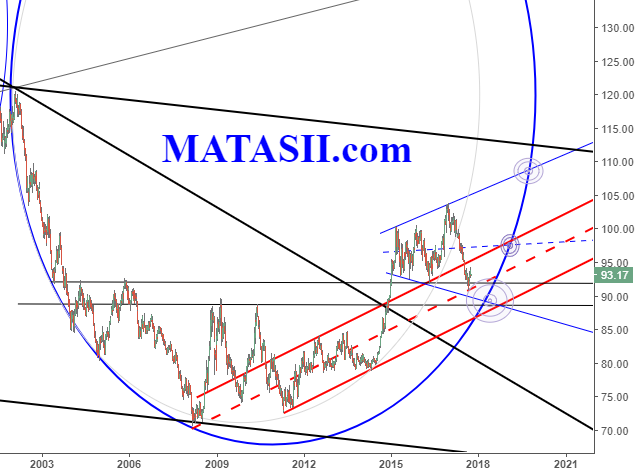
The USD has dropped to a previous s/r level (black), the red dashed s/r (middle of the red channel), and has bounced. This could be the bottom for the dollar, however there are some technical considerations that suggest the current bounce is just part of a corrective or normal market retracement and that there is still another potential drop to go. Since the lift that can be seen in 2015 I have been waiting for the dollar to move back and touch the ellipse edge - this continues to be what I am watching for. While the touch does not necessarily have to be lower than the current market, if we look at Elliott Wave theory it suggests another potential wave down to go (the 5th). The chart below is a zoomed in view of the current market location. The bounce we are in could be seen as the 4th corrective, with still another wave, the 5th, down to go.
USD Weekly
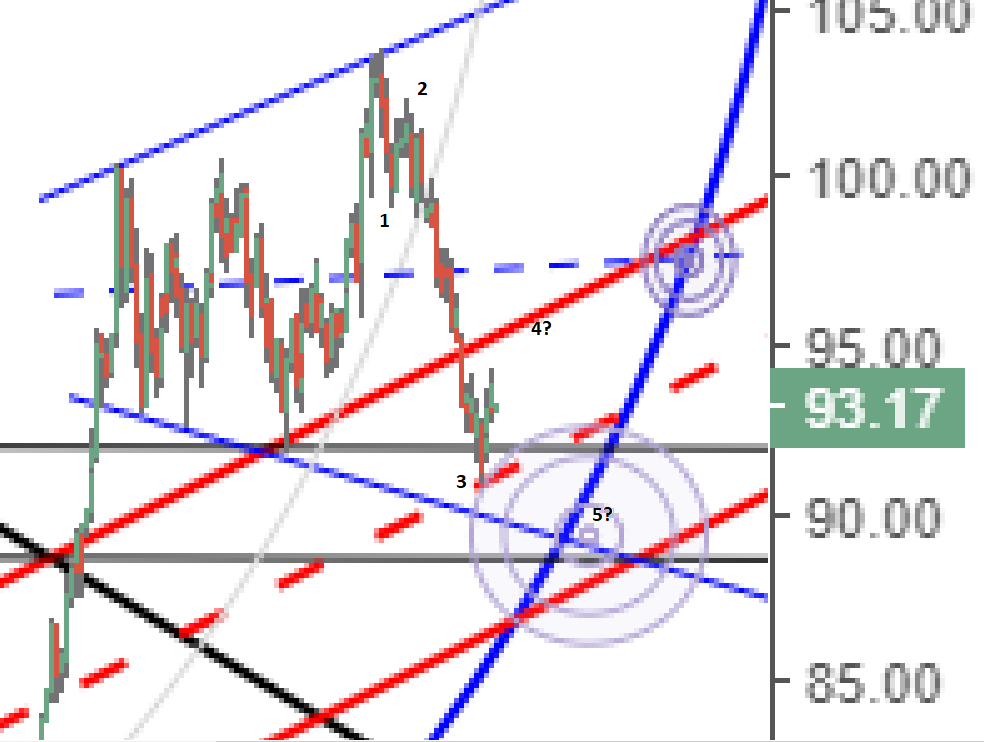
Weekly view of the corrective structure the market has been in since the lift in 2015.
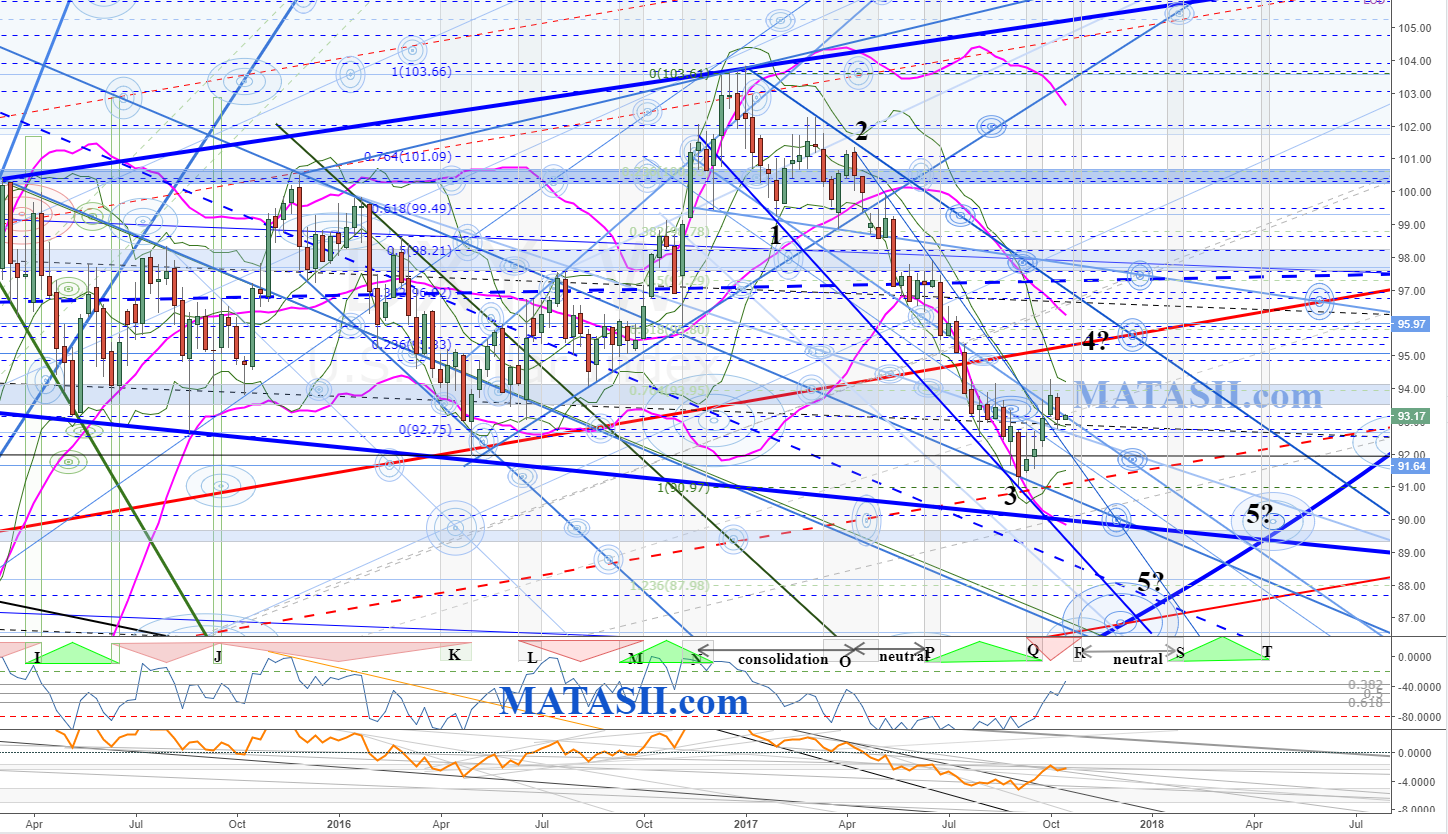
The drop since the end of 2016 can be seen as an expanding wedge and the potential EW count has been identified. The structure and other technicals suggest we could see more bounce / lift with a retest of the red channel top s/r. Also of note in the area is the falling 34ma (pink) and the wedge pattern's top resistance. IF wave 4 lifts somewhere in here, it would also fit EW's theory of alternation (from wave 2). IF the EW count is somewhat correct, we could then expect to see another drop, possibly severe, similar to the drop experienced in wave 3. There are a couple of likely or potential targets to look for wave 5 to end up: one continues the current down trend and breaks lower than the larger blue expanding wedge to touch the ellipse; the second touches the larger blue expanding wedge and the ellipse at the same time. Note the slightly curved blue line seen in the bottom right corner of the chart, cutting through the potential 5? targets, is the edge of the large blue ellipse from the previous charts.
IF the EW count is incorrect, or fails (as all technicals can), then we may already have the bottom of the market. This is not my bias, however we need to account for the possibility. With respect to EW theory, the market could technically go back as high as the lows of wave 1 and still be a valid count. This would allow a large lift from the market (potentially back to $98.85) and then the 5th drop. However, if we see the market lift past the technicals noted around 4?, then we need to start to consider the possibility of more than just a correction occurring. There is the middle blue dashed s/r of the large blue wedge structure as well as two blue weekly s/r zones that can be used as guides if the market starts to lift back to the top of the larger blue wedge pattern (to make new highs).
Daily View
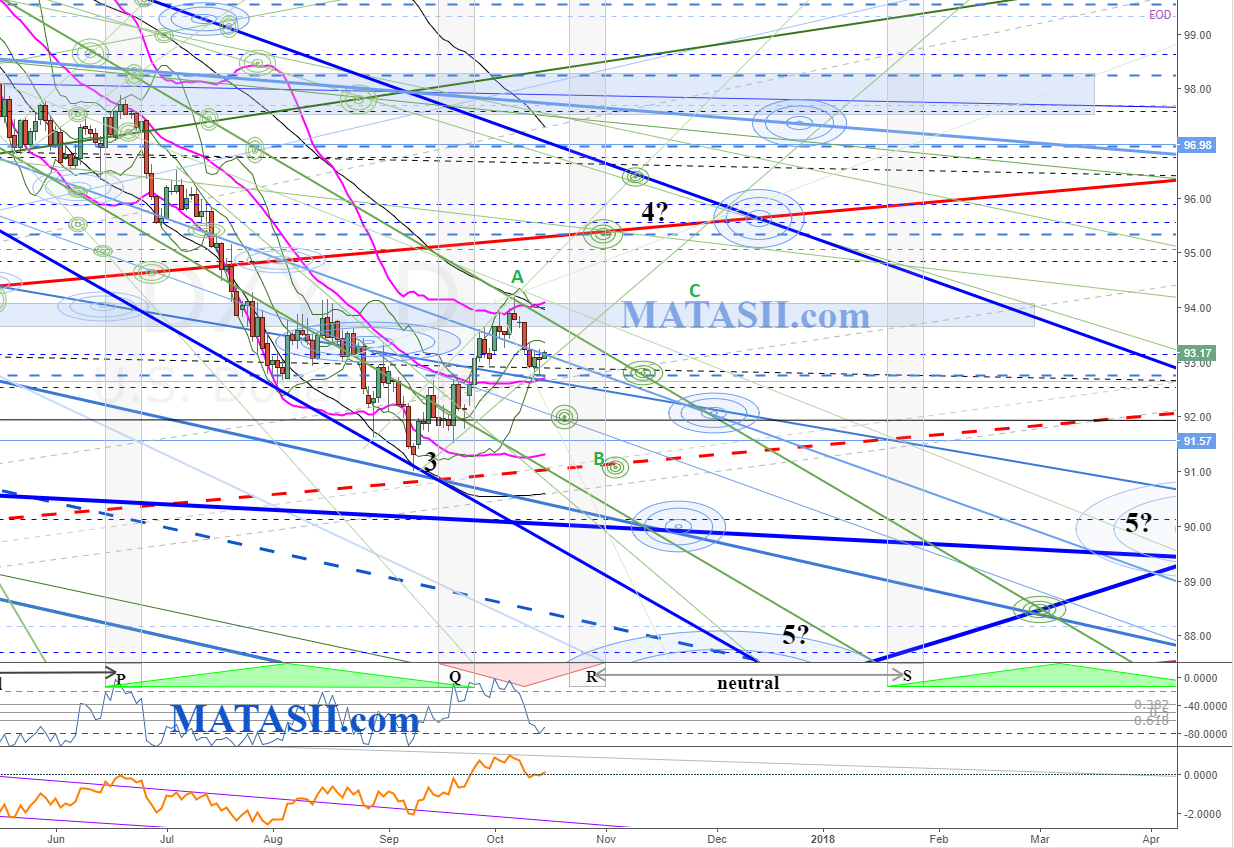
The longer term perspectives suggest we could see more lift from the USD in to 4? somewhere. The daily offers more perspectives, including an alternative to more lift. IF we don't see the lift to 4?, we could see the 4th wave unfold a little more sideways. The blue s/r zone (just bounced from), current green channel from the recent drop (just bounced off), and the UBB's all need to moved over for more lift to occur. IF these hold we could see a potnetial sideways ABC unfold (marked in green), where the red dashed s/r and the blue s/r zone become wave 4's boundaries. Wave 4 would end at the blue s/r zone and we could still see another good drop for wave 5.
MACRO BIAS
Note Gordons MACRO BIAS, we should be considering these to give the technicals some context. They appear to support a consolidation (neutral R-S), and then a lift in S-T. The 5th wave drop, although could be quick and significant, relative to the drop since the start of this year could fall in to the larger picture as part of the neutral. Remember that these zones are not absolute and reflect an overall general market pressure that is expected to occur.