WE ARE BELOW THE EVENT HORIZON!
NOTE: We are having technical problems with a number of missing graphics below
Temporarily see LINK for supporting graphics and/or read this post in a different format (recommended).
I first mentioned the concept of the US Economy being below its Event Horizon in the July Edition of the UnderTheLens video entitled “The Great Stagflation”. Unfortunately there was insufficient time to explore some critical concepts I felt required further discussion.
I believe the notion of a Black Hole, and the critical importance of its Event Horizon, are the clearest ways to identify with the box the central bankers have placed themselves and ourselves in. This has unwittingly been wrought through a protracted period of what can be best described as policy initiatives of “Kick-the-Can-Down-The Road” versus addressing the long term structural problems head on
|
Like anything that is repeatedly avoided, it typically only makes the problem worse, the solutions more intractable and the consequences more devastating.
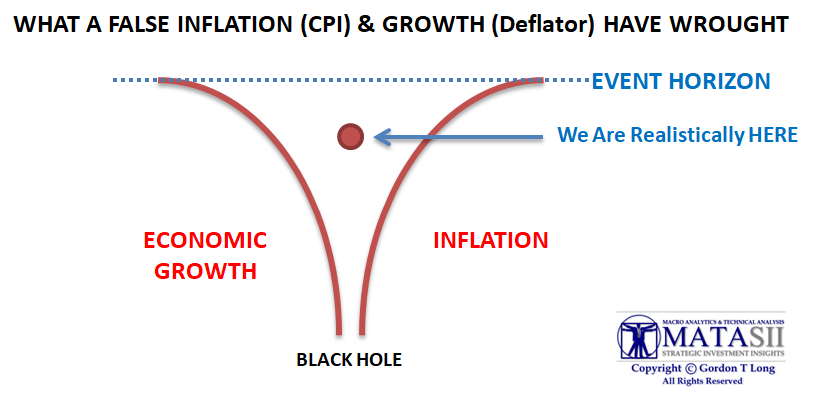
THE BLACK HOLE WE HAVE ENTERED
As we are all well aware the forces a Black Hole exerts are such that once entered it becomes increasingly impossible to exit, leading only to crushing pressures and annihilation. The Event Horizon is that critical point in time when going closer prevents escape and almost assuredly results in a predetermined outcome. Knowing where the Event Horizon Is and your position relative to it is central to determining your destiny.
But what if your positioning system is flawed by corrupted data? That is the hapless position we find ourselves in now!
WHAT ARE THE PRESSURES?
The pressures of the Black Hole we are referencing are those of Economic Growth and Inflation. These competing pressures work destructively, at odds with each other, as a result of traditional Monetary policy choices.
The alternatives being:
-
- Higher Economic Growth dictates easier available credit through lower interest rates,
- Lower Inflation dictates tighter credit availability through higher interest rates.
Such policy choices between the two is like an Event Horizon which is to avoided. This uncompromising Black Hole is the intractable economic problem of simultaneous high Inflation and low growth. It has been labeled as “Stagflation”. The last time the US experienced such a situation was in the 1970s, which resulted in then Federal Reserve Chairman Paul Volcker being compelled to raise rates to 19% to draw the Inflation genie back in the bottle! It was a wrenching time, but Chairman Volcker triumphantly liberated the US from the Stagflation Black Hole.
|
|
|
WHAT IS THE BAD POSITIONING DATA?
Bad positioning data is now central to our problem and grievously is of our own doing! We have distorted both our Inflation data and our Economic data in mistaken attempts to avoid major structural and secular changes requiring brave and insightful leadership.
As a consequence the situation is now dire because we are not taking the corrective actions now so urgently required.
I have talked extensively about the data flaws and I will refer new readers to the following two such sources:
|
|
| |
|
INFLATION IS MISREPRESENTED BY:
- Substitution,
- Hedonics,
- Imputation,
- Basket Used,
- and more as detailed in Shadowstats.com representation above .
RESULT:
INFLATION IS APPROACHING ~14% AS MEASURED BY 1980 GOVERNMENT METHODOLOGY
|
|
|
|
|
THESIS 2017: ILLUSION OF GROWTH — 111 Page PDF – – DOWNLOAD
ECONOMIC GROWTH IS MISREPRESENTED BY:
- A GDP Formula Based on Sound Money not Fiat Sovereign Currency,
- Double Accounting:
- Government Transfer Payments used for Consumption,
- Fiscal Deficits included in Foreign Investment
- Misrepresentation of Inflation Deflator
|
|
|
|
|
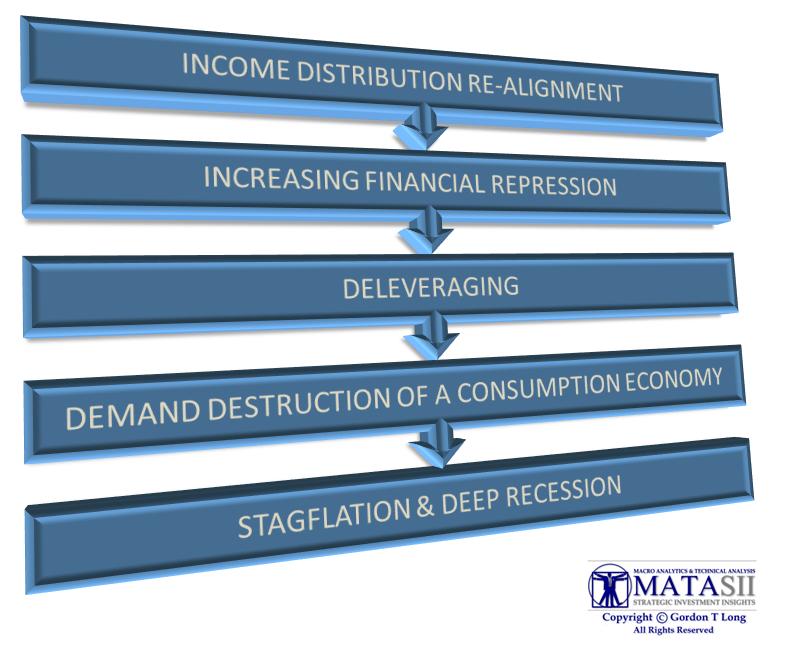
STAGES OF THE STAGFLATION ‘BLACK HOLE’
The stages ahead of us have a reasonable likelihood of occurring in the following sequence:
|
|
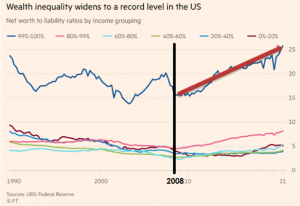 INCOME DISTRIBUTION RE-ALIGNMENT: INCOME DISTRIBUTION RE-ALIGNMENT:
- We should expect a Secular correction in Income Distribution to occur.
- This will be the result of:
- Historic Inequality,
- Fallout from the diminishing role of Unions in the US as a result of the offshoring of US manufacturing with the advent of global labor arbitrage and China’s entry into the WTO.
- A lack of a “Working Wage” or a “Family Wage”,
- Single parent income insufficient to support Child Care and reduced work hours for employers to avoid the payment of basic benefits. This is resulting in increased gangs and crime by increasingly younger teens,
- No realistic Cost of Living Increases for decades resulting in crippling disposable incomes,
- Young professionals increasingly expected to work 72 hour work weeks,
- Cost of higher Education creating Debt Slaves (however if you don’t work you get ‘forbearance’)
|
|
- INCREASING FINANCIAL REPRESSION:
- Financial Repression will be increasingly more restrictive with higher inflation-adjusted interest rates.(remembering inflation will continue to be increasingly reported lower than it actually is)
- Higher Inflation will allow higher inflation adjusted interest rates — which will raise the overall Inflation bar and further reduce government debt burden,
- However, higher nominal rates (though lower real rates) will increase public demand for sovereign debt. (The ‘slight of hand’: If yields were 5%, baby boomers would highly likely buy bonds even though real rates after inflation were negative)
|
|
- DELEVERAGING:
- A more restrictive monetary policy will then stabilize asset prices and wealth, forcing deleveraging.
- Falling markets will be slowed and halted by a devalued US dollar. (stocks become more expensive in US dollars when the dollar losses its relative value).
See the “Coming Deflationary Tsunami” video.
|
|
|
- DEMAND DESTRUCTION OF A CONSUMPTION ECONOMY:
- Deleveraging will lead to a recession due to the necessary fall in demand among households, companies and governments.
See the “Coming Deflationary Tsunami” video,
|
|
|
- DEEP RECESSION & STAGFLATION
- A deep recession and sustained US Stagflation (“The Great Stagflation”) will end the Ponzi scheme!!
See “The Great Stagflation” video
|
|
|
|
CONCLUSION
TIMELINE
The above sequence will unfold within the timeline we laid out in the May UnderTheLens video entitled: “The MATASII Macro Map“.
-
- A Double Dip Recession impacting the entire Global economy unfolds: 2022-2023
- The Great Stagflation Unfolds: 2024-2025
- Hyperinflation by 2028
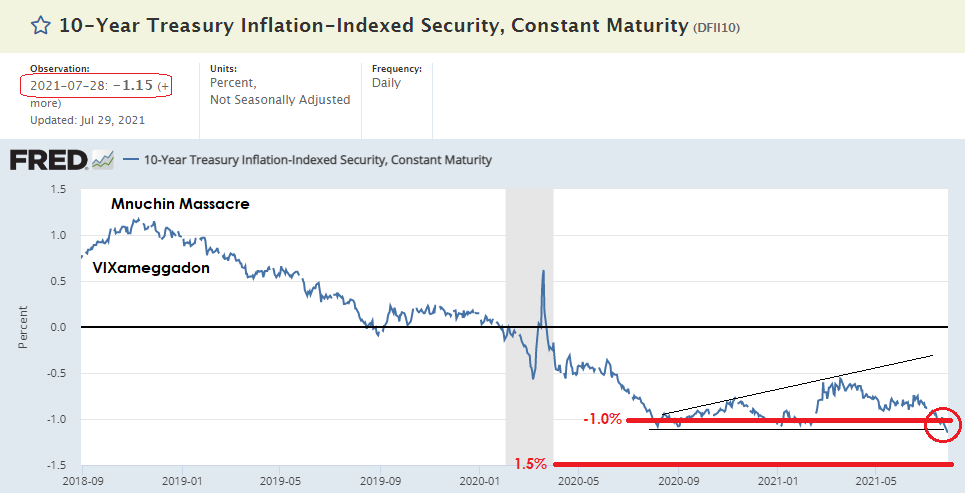
The critical focus today is whether nominal rates either rise or fall from the present economic point. Expectations are they will fall as prior QE tapering did.
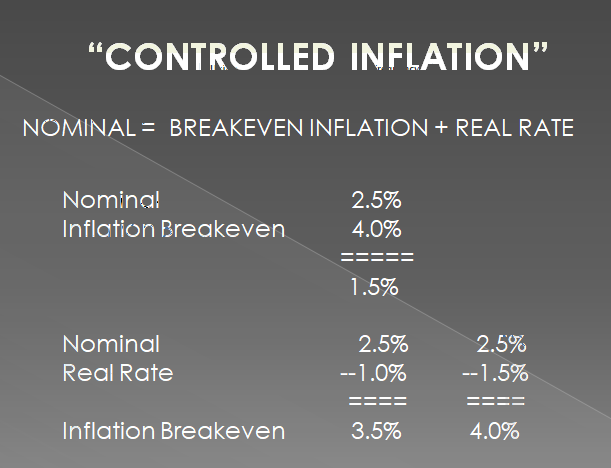
However, we have concluded rates will rise within a Fed Policy of “Controlled Inflation” where:
-
- Nominal 10Y UST rates will approximate 2.5%,
- Inflation Breakevens will approximate 4.0%, and
- Real reported rates will approximate 1.5%
(see chart directly below and the chart within the ‘Current Market Perspective’ section, also below).
When we consider we have $8.9T of negative yield debt in Europe with the German 10Y Bund trading at -0.5% (with inflation targeted at 2%) we already have competitive -2.5% real rates in Germany.
|
|
|
|
“Productivity growth is a purer measure of monetary policy impact than total real GDP growth. That’s because the latter is in part driven by long-run demographics and the annual growth of the labor supply. Productivity growth has exhibited an indisputable decline over the past 72 years, even as Fed policy has become dramatically and chronically more “stimulative.” …. At the end of the day, the only real policy “tool” the Fed possesses is its printing press. Namely, it cannot really move interest rates lower, implement QE, ease financial conditions on Wall Street or accommodate better economic performance on Main Street (to use its preferred nomenclature) except by expanding its balance sheet. Accordingly, the ratio of Fed balance sheet growth to money (nominal) GDP growth is a close quantitative proxy for its level of “stimulus.” And on that measure, the results are the opposite of the deteriorating productivity trend.”
David Stockman
|
|