WHAT ARE THE CENTRAL BANKERS SO AFRAID OF?
UNPRECEDENTED GLOBAL LIQUIDITY PUMPING
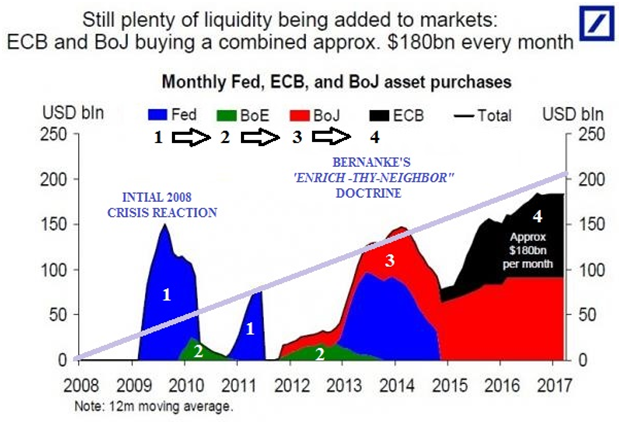
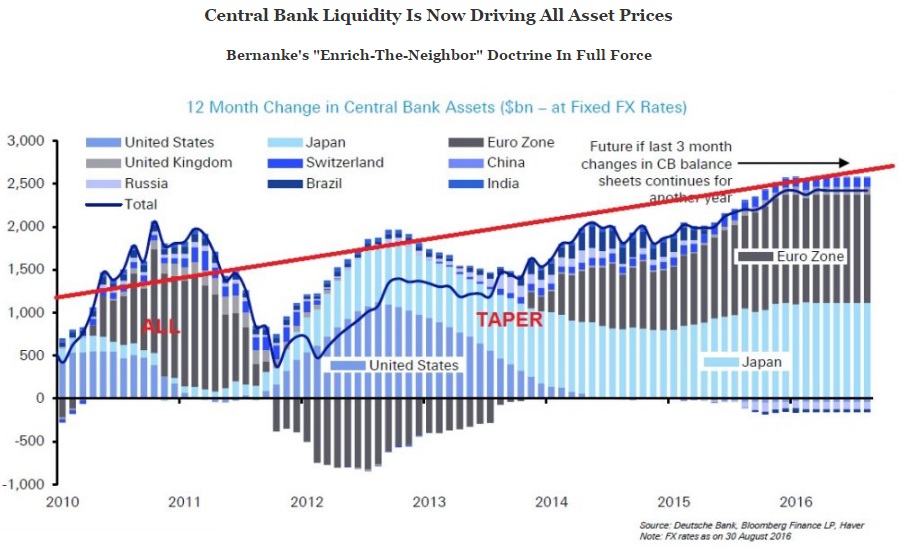
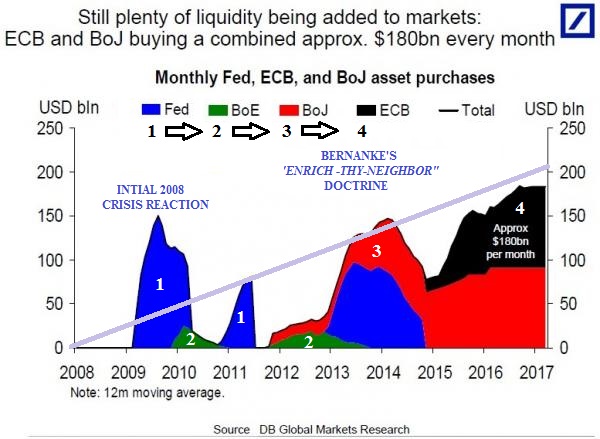
Global central bank liquidity injections have never been greater, and as of this moment, have surpassed all previous post-financial crisis central bank intervention. As a matter of fact we are now pumping over $200B / month.
THE FIAT CURRENCY CARTEL
This chart which was recently outdated as the UK's BOE announcements pushed it over $200B as part of Bernanke's "Enrich-Thy-Neighbor" Doctrine to keep asset prices elevated,
Collectively this means central bank liquidity is actually close to being as high as it’s been at any point post GFC even with the Fed’s QE program having been halted two years ago.
As Deutsche Bank's Jim Reid points out, "it’s difficult at the moment to fight the central bank in the credit market, especially in Europe and the UK where they are a non price sensitive buyer of the asset class. Even outside of these asset purchase programs it’s fair to say that global policy continues to be remarkably loose. Of the main central banks the Fed has been largely neutralized even if they manage to add a fresh hike in September or December, and the ECB and BoJ have increased and expanded the scope of their QE programs with the BoE recommencing theirs after a nearly four-year break."
The question is if we accept what we are told about the post 2008 financial crisis recovery, why after nearly 8 years do we still need such unprecedented programs. Monetary programs which only get more aggressive by the day?
THE RECOVERY IS AN ILLUSION
The simple truth is that the recovery is a statistical illusion. We buy it because our traditional "measures" of this like the stock and bond markets are suggesting this is the case. In actuality they are telling us the absolute opposite. The games that have been played to keep asset prices elevated have fooled us. Maybe we just wanted to be fooled? But as you will see in a moment there are 10's of millions of Americans who are not fooled as they face the realities of daily life. This is most evident in the political movements that have supported such unlikely Presidential candidates such as Bernie Sanders and Donald Trump.

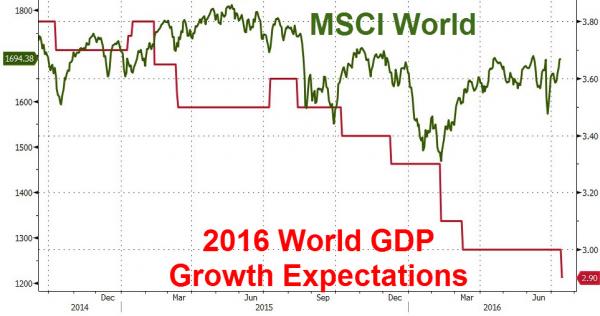
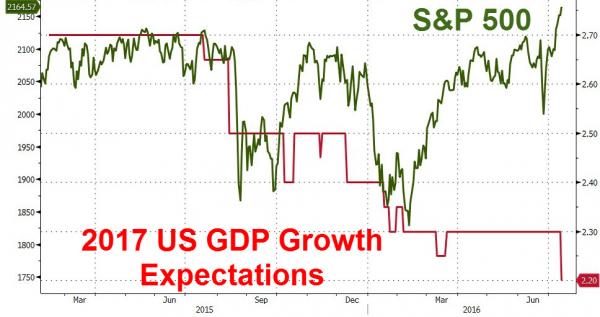
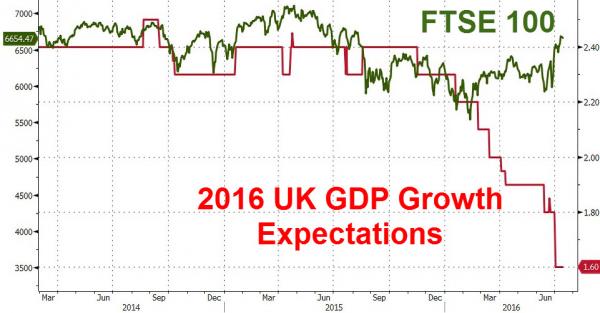
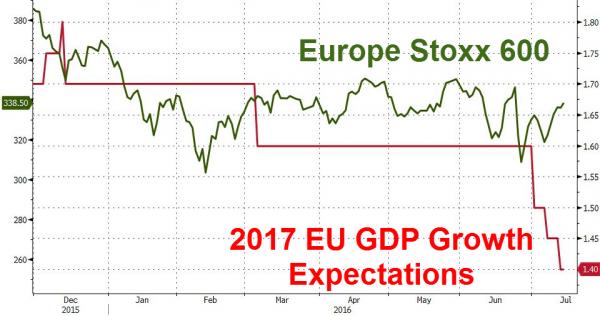
THE ILLUSION OF GROWTH
What we need to fully grasp is that the chief trend around us is an ongoing permanent worldwide economic slowing and when properly analysed with valid statistics is in fact a contraction.
The absence of this “growth,” is defined by the employment and productivity statistics which I will also discuss in a moment.
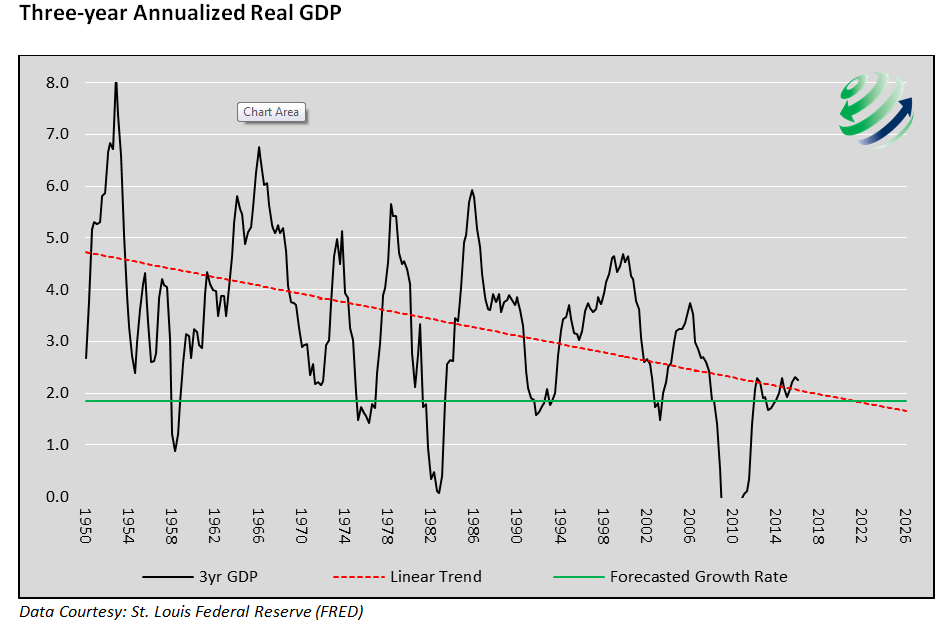
The charts I am showing here, as I talk are in fact much worse than they appear - as bad as they are!
As is usually the case with troubled, over extended and corrupted societies, governing officials have begun to resort to magic to prop up failing economic policies.
This is why the Federal Reserve, once an obscure institution deep in the background of normal life, has become front and center, holding the rest of us literally spellbound with its incantations against the intractable ravages of debt deflation.

The rackets and swindles unleashed in our futile quest to keep up appearances have disabled the financial operating system that the ruling regime depends on. It’s all an illusion sustained by accounting fraud to conceal promises that won’t be kept.
All the mighty efforts of central bank authorities to borrow “wealth” from the future in the form of “money” — to “paper over” the absence of growth — will not conceal the impossibility of paying that borrowed money back. The future’s revenge for these empty promises will be the disclosure that the supposed wealth is not really there — especially as represented in currencies, stock shares, bonds, and other ephemeral “instruments” designed to be storage vehicles for wealth.
 The stocks are not worth what they pretend. The bonds will never be paid off. The currencies will not store value.
Global debt is over $200T. At even a 2% annual yield that is a bleed of $4T on the global economy. The global economy is reputed to be approximately $72T with a growth rate below 2%. That is $1.4T in growth annually to pay the $4T. Seeing the problem?
However this is yet only another symptom. Lets work ourselves towards the cause.
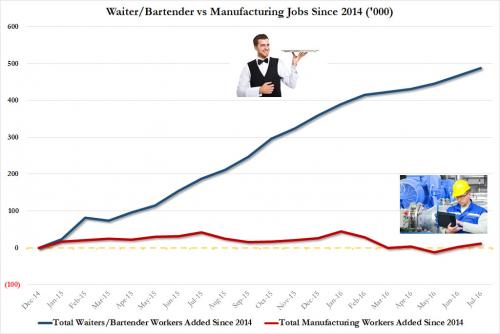
THE BAR-TENDER & WAITRESS ECONOMY
Since 2007 1.4 Million US Manufacturing Jobs were lost while 1.4 Million Waiter/Bartender Jobs were added. What we have is lost high paying jobs being substituted for low paying jobs. That is a reduced standard of living in everyone's eyes but the government statisticians!
Since the end of the financial crisis, economists, analysts, and the Federal Reserve have continued to point to the monthly employment reports as proof of the ongoing economic recovery. Even the White House has jumped on the bandwagon as the President has proudly latched onto the headlines of the “longest stretch of employment gains since the 1990’s.”
" ... in the past 65 months, or nearly five and a half years starting with March 2010, or when the jobs "recovery" really kicked in, jobs for waiters and bartenders (aka food service and drinking places) have declined just once. This is a statistically abnormal hit rate of nearly 99%, and one which we assume has everything to do with the BLS' charge of not so much reporting reality as finding loopholes in the goal seeked model to report that the US keeps adding over 200,000 jobs every month or bust.
Putting this number in context, the US has allegedly added 376K bartenders in the past year, and 3 million since March 2010.

And here is another, even more disturbing way of showing the "New Economy" - since December 2014, the US has lost 1.4 million manufacturing workers. These have been replaced almost one to one, with new waiters and bartenders. Win, win for everyone, especially the welfare state and of course, China.

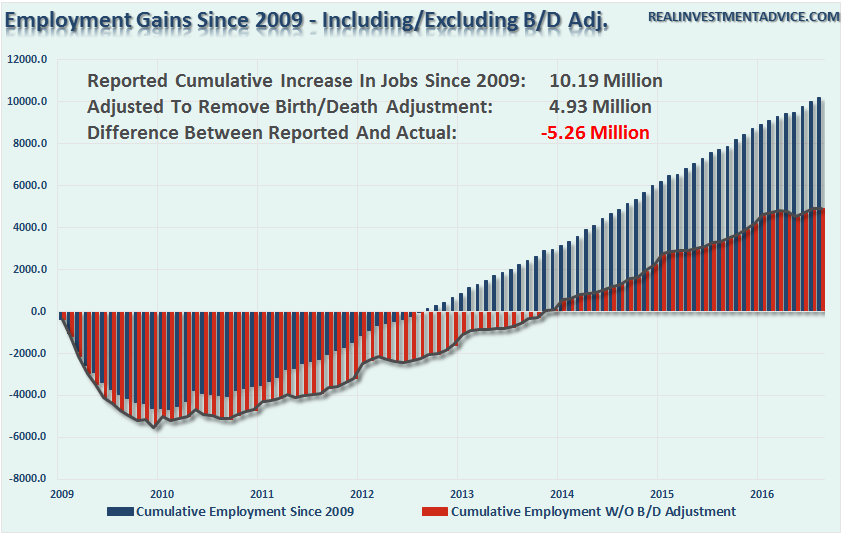
“This chart CLEARLY shows that the number of “Births & Deaths” of businesses since the financial crisis have been on the decline. Yet, each month, when the market gets the jobs report, we see roughly 180,000 plus jobs.
Included in those reports is an ‘ADJUSTMENT’ by the BEA to account for the number of new businesses (jobs) that were “birthed” (created) during the reporting period. This number has generally ‘added’ jobs to the employment report each month.
The chart shows the differential in employment gains since 2009 when removing the additions to the monthly employment number though the “Birth/Death” adjustment. Real employment gains would be roughly 5.26 million less if you actually accounted for the LOSS in jobs correctly"
SOME BASIC STATISTICS

Participation Rate Suggests a Problem (see notebook stats from Quinn - 9/4)
The percentage of Americans who say they are in the middle or upper-middle class has fallen 10 percentage points, from a 61% average between 2000 and 2008 to 51% today.

Ten percent of 250 million adults in the U.S. is 25 million people whose economic lives have crashed.
What the media is missing is that these 25 million people are invisible in the widely reported 4.9% official U.S. unemployment rate.
Let's say someone has a good middle-class job that pays $65,000 a year. That job goes away in a changing, disrupted world, and his new full-time job pays $14 per hour -- or about $28,000 per year. That devastated American remains counted as "full-time employed" because he still has full-time work -- although with drastically reduced pay and benefits. He has fallen out of the middle class and is invisible in current reporting.
More disastrous is the emotional toll on the person -- the sudden loss of household income can cause a crash of self-esteem and dignity, leading to an environment of desperation that we haven't seen since the Great Depression.
Millions of Americans, even if they themselves are gainfully employed in good jobs, are just one degree away from someone who is experiencing either unemployment, underemployment or falling wages. We know them all.
UNDERSTANDING THE GDP ILLUSION
Goldman's Peter Oppenheimer (summarized here), shows something stunning. The 10-year rolling nominal earnings growth rate has collapsed to -1.8% in Europe and has fallen to record lows for the global equity market.

The GDP number that is continuously touted to represent economic growth is absurd. It is a distorted formula that no longer makes sense.
Let me try and explain.
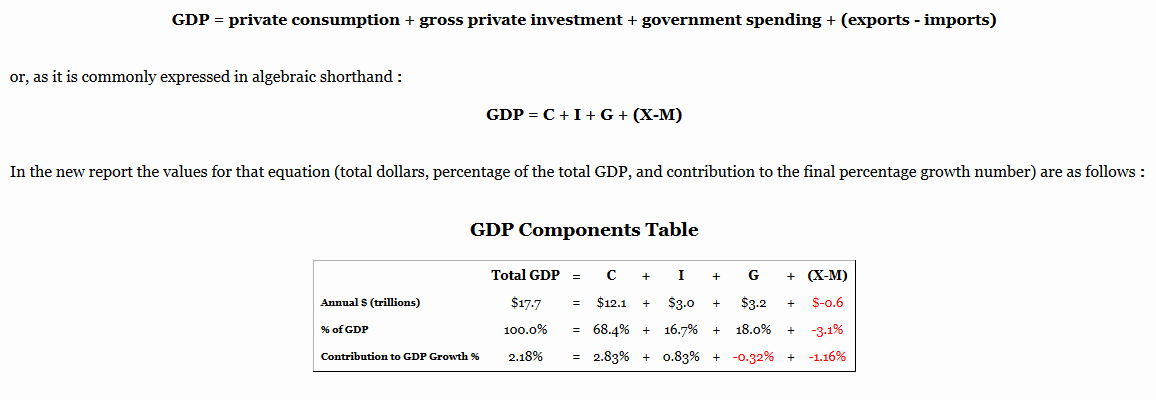
GDP Formula (end of 2014)
Nominal GDP was $18.4T at the end of Q2 2016. This compared to $15.5T five years previously at the end of Q2 2011. This is a $2.9T increase while entitlements or government transfer payments now total over $2.5T.
The "G" has become very large and is dominated by "Transfer Payments". These "Transfer Payments" are then added to the "C" as entitlement and welfare recipients spend for consumption. Its called double accounting or "double dipping". But who cares if it gives the impression that GDP has 1% growth
FURTHER RESEARCH YOU SHOULD CONSIDER READING:
Failed Transmission - Evidence on the Futility of Activist Fed Policy John P. Hussman, Ph.D.
The Matrix Exposed - Zero Hedge - TRADE AGREEMENTS A MAJOR CATALYST
PRODUCTIVITY EXPOSES THE MYTH
In a healthy capitalist environment we have this flow:
Savings > Productive Assets > Productivity > Rising Standard of Living
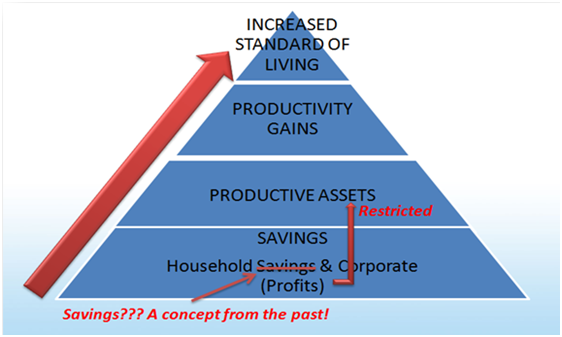
Unfortunately as I have written about previously, this is not what is presently occurring.
The key here is actually productivity. We actually have savings when we consider corporate profits being at record levels. It is about how this profit is being used.
Productivity has been steadily falling in most developed economies for some time now

When you understand that the GDP Growth Potential is the addition of the change in productivity plus the change in the labor force you begin to see the compounding problem facing the developed economies.
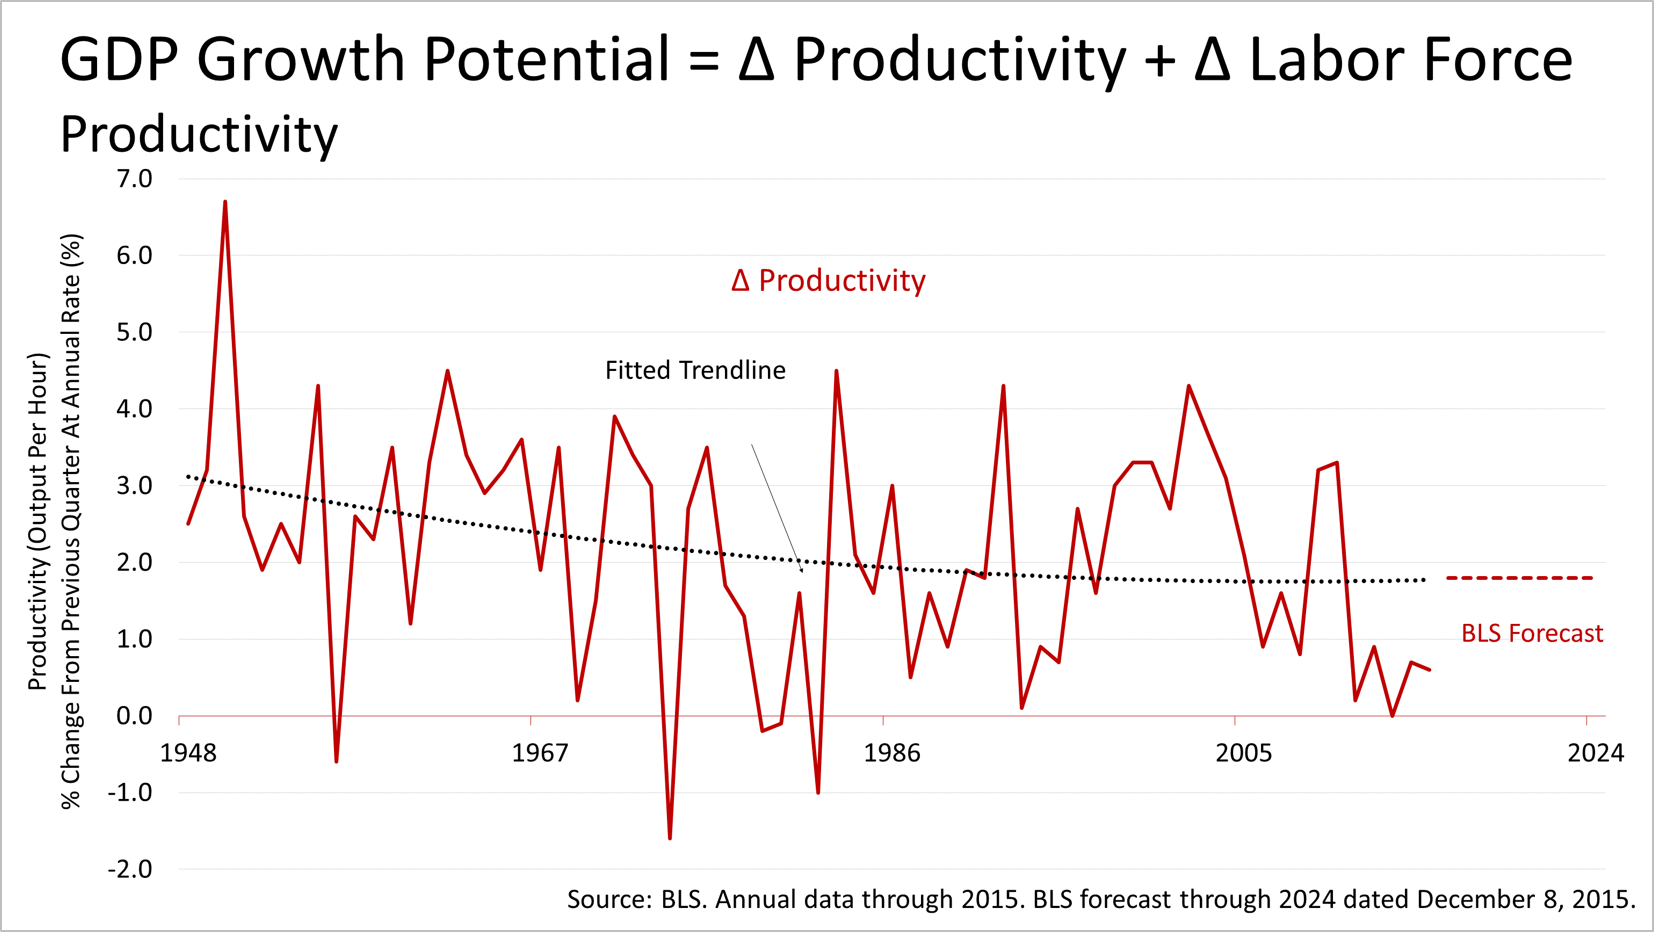
... and it is getting worse at an accelerating rate.
Though the previous charts were all longer term views on productivity we have witnessed an acceleration with the last three quarters all falling. The 3rd quarterly decline - the first instance since 1979...And the last 3 quarters are the biggest plunge in productivity since 1993 (thanks to a doubling of unit labor costs from expectations of +2.1% to +4.3%).


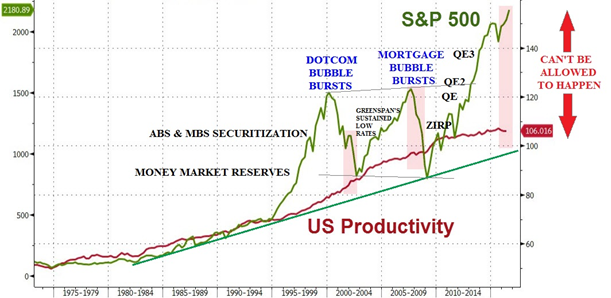
We are now seeing the results of the failed use by corporations to effectively increase productivity by the use of their profits and the dramatic increase in their debt loads. It has become a game of financial engineering versus productive use of capital.

This has led us to the point where in fact the central bankers are no being forced to prop up the financial markets because any draw down would be devastating. We effectively created a giant Ponzi scheme either intentionally through greed, or unwittingly due to lack of regulatory vigilance and governing neglect.
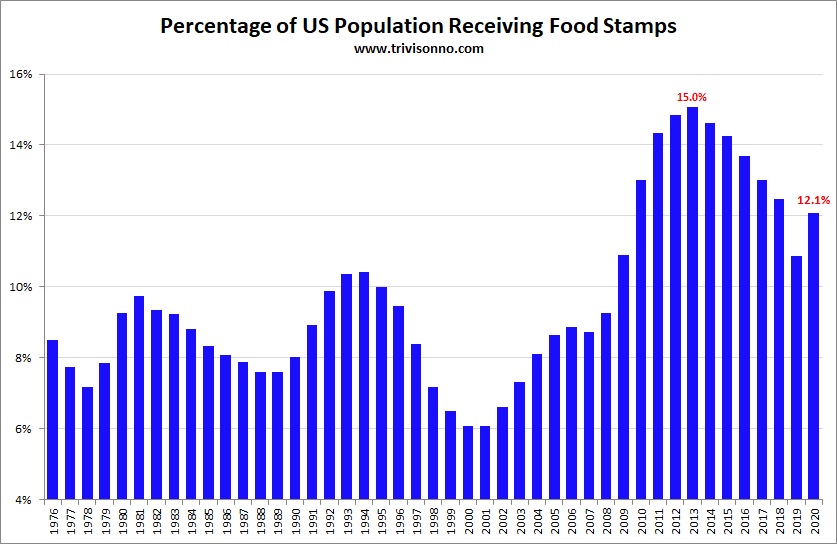
As I said initially, if the world and US specifically has actually been experiencing an economic recovery for the last seven years, why would 14% to 15% of all Americans be dependent on food stamps to survive? When the economy is actually growing and employment is really below 5%, the percentage of Americans on food stamps is below 8%. If the government economic data was truthful, there would not be 43.5 million people living in 21.4 households (17% of all households) dependent on food stamps.
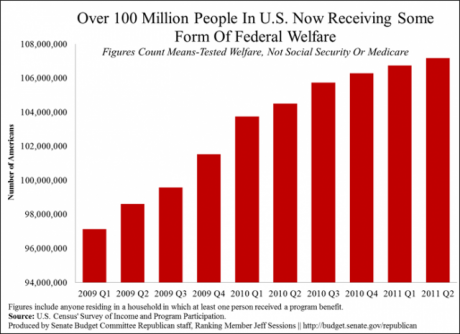
More than 100 million Americans are now dependent on some form of federal welfare (not including Social Security or Medicare). If the economy came out of recession in the second half of 2009, why would 6 million more Americans need to go on welfare over the next two years?
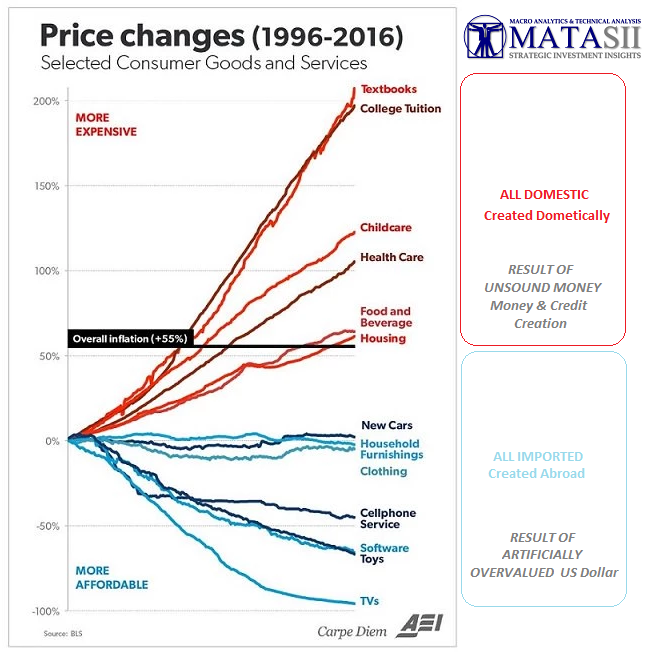
CREATING WEALTH - Creating & Producing 'Things'
This graphic starts to get to real cause. We have massive global economic imbalance. It is evident when you consider we have dramatic inflation in the US on products and services we create. it isn't because Americans are smart or aren't working hard - because they are. It is the result of Unsound Money practices regarding Money and Credit Creation.
The products we buy or import are actually falling in this graphic and this is a result of a dramatically and artificially over valued US dollar!
My Macro Analytics guest Michael Snyder writes in a paper From An Industrial Economy To A Paper Economy - The Stunning Decline Of Manufacturing In America:
"In order to have a sustainable economy, you have got to have people creating and producing things of value. A debt-based paper economy may seem to work for a while, but eventually the whole thing inevitably comes crashing down when faith in the paper is lost.
The total number of government employees in the United States exceeds the total number of manufacturing employees by almost 10 million…
Government employees in the United States outnumber manufacturing employees by 9,932,000, according to data released today by the Bureau of Labor Statistics.Federal, state and local government employed 22,213,000 people in August, while the manufacturing sector employed 12,281,000.
The BLS has published seasonally-adjusted month-by-month employment data for both government and manufacturing going back to 1939. For half a century—from January 1939 through July 1989—manufacturing employment always exceeded government employment in the United States, according to these numbers.
You might be thinking that government jobs are “good jobs”, but the truth is that they don’t produce wealth.

Government employees are really good at pushing paper around and telling other people what to do, but in most instances they don’t actually make anything.
Back in 1960, 24 percent of all American workers worked in manufacturing. Today, that number has shriveled all the way down to just 8 percent. CNN is calling it “the Great Shift”…
In 1960, about one in four American workers had a job in manufacturing. Today fewer than one in 10 are employed in the sector, according to government data.Call it the Great Shift. Workers transitioned from the fields to the factories. Now they are moving from factories to service counters and health care centers. The fastest growing jobs in America now are nurses, personal care aides, cooks, waiters, retail salespersons and operations managers.
No wonder the middle class is shrinking so rapidly. There aren’t too many cooks, waiters or retail salespersons that can ANY LONGER support a middle class family.
Since the turn of the century, we have lost more than 50,000 manufacturing facilities. Meanwhile, tens of thousands of gleaming new factories have been erected in places like China, India, Mexico etc.
As Bridgewater's Ray Dalio said recently:
"We have reached the limits" of [central banks] "ability to stimulate" the economy " and raise global asset prices.....there's only so much you can squeeze out of a debt cycle... we are there... you can't lower interest rates materially, and you are also at the limit on QE (because spreads are limited)..... Globally, those forces that were behind us are no longer there... we are at the end of a debt cycle... and everybody will have a lower growth rate than we are used to..... What I am contending is that there are limits to spending growth financed by a combination of debt and money. When these limits are reached, it marks the end of the upward phase of the long-term debt cycle.
In 1935, this scenario was dubbed “pushing on a string”. This scenario reflects the reduced ability of the world’s reserve currency central banks to be effective at easing when both interest can’t be lowered and risk premia are too low to have quantitative easing be effective."

OBSERVATIONS
- Consuming More than We Produce versus Producing More than We Consume,
- We are Getting Less for More versus Getting More for Less,
- We have Skewed Innovation - Targeted Primarily at Cost Savings versus New Industries,
- We have a Lack of Corporate Risk Taking - Professional Managers versus Visionaries Franchises versus Small Business
- Chains versus "Ma & Pa" Small Business,
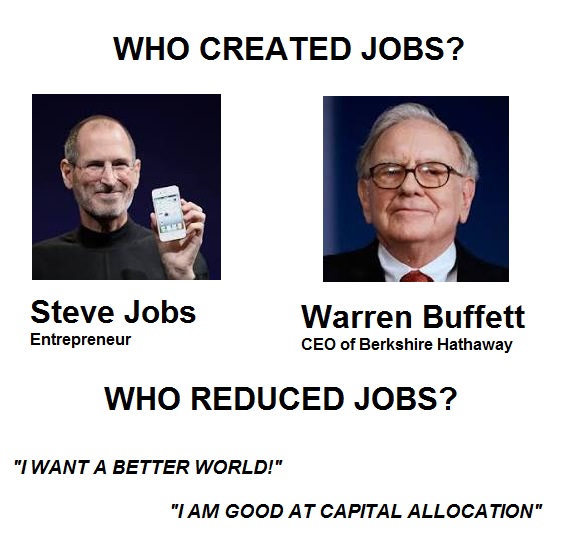
- The Steve Jobs (Genius) versus Warren Buffett (VaR)
There are three serious metrics that need to be turned around or we'll lose the whole US middle class.
- According to the U.S. Bureau of Labor Statistics, the percentage of the total U.S. adult population that has a full-time job has been hovering around 48% since 2010 -- this is the lowest full-time employment level since 1983.
- The number of publicly listed companies trading on U.S. exchanges has been cut almost in half in the past 20 years -- from about 7,300 to 3,700. Because firms can't grow organically -- that is, build more business from new and existing customers -- they give up and pay high prices to acquire their competitors, thus drastically shrinking the number of U.S. public companies. This seriously contributes to the massive loss of U.S. middle-class jobs.
- New business startups are at historical lows. Americans have stopped starting businesses. And the businesses that do start are growing at historically slow rates.
Free enterprise is in free fall -- but it is fixable. Small business can save America and restore the middle class.
Gallup finds that small businesses -- startups plus "shootups," those that grow big -- are the engine of new economic energy. According to the U.S. Small Business Administration, 65% of all new jobs are created by small businesses, not large ones.
Here's the crisis: The deaths of small businesses recently outnumbered the births of small businesses. The U.S. Census Bureau reports that the total number of business startups and business closures per year crossed for the first time in 2008. In the nearly 30 years before that, the U.S. consistently averaged a surplus of almost 120,000 more business births than deaths each year. But from 2008 to 2011, an average of 420,000 businesses were born annually, while an average of 450,000 per year were dying.
Bob Bryan via Business Insider explains the primary problem:
“Both the formation of firms and establishments, have dropped off precipitously since the financial crisis and remained low.
This is important because new businesses typically hire faster and produce higher levels of productivity than firms that have been around for a while. Thus the decline in business formation can explain some of the labor market’s post-recession problems, and is at least part of the reason for the steep drop in productivity.”

THE ANSWER TO OUR QUESTION
So, what are the central bankers so afraid of?
I surmise they see that the global economic system is going to collapse under its own weight and there is nothing they can do about it except to try desperately to "kick the can down the road" by continuing with policies grounded in "extend and pretend"! Our political leaders have failed us which is quite clear if you have had the stomach to follow the 2016 US Presidential race.