Gordon T Long

Gordon T Long

Global Macro Research | Macro-Technical Analysis 

STRATEGIC INVESTMENT INITIATIVES

COMMODITIES – HARD ASSETS


WHAT DO REAL YIELDS TELL US ABOUT YELLOW & BLACK GOLD?

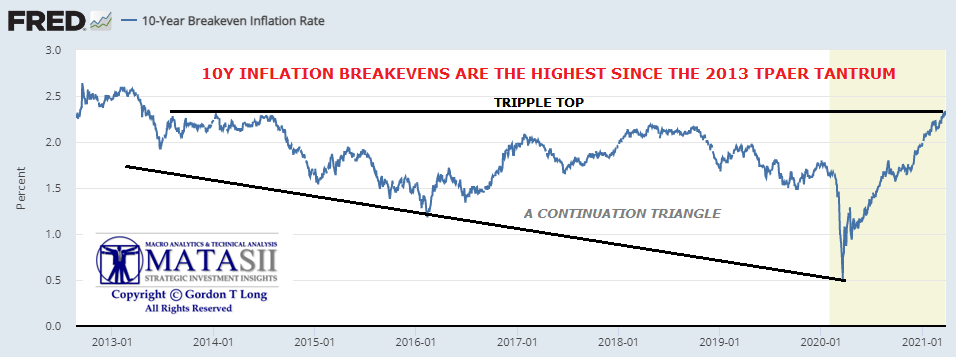
Today, official Inflation Breakeven is the forecast that is derived from the difference between the yields on inflation-linked and fixed bonds of a given maturity or as a matter of current practice; the Treasury Inflation Protected Securities (TIPS). There are many problems with this but one is that the government’s CPI is the inflation link used. Any retiree will frustratingly tell you it doesn’t even come close to inflation nor does its twin, the “COLA” indexing used for annual Social Security adjustments. However, despite even this distortion, inflation Breakevens are presently at their highest since 2013. That is quite a paradox when you consider the world is still in the grip of a pandemic!

UnderTheLens - 03-24-21 - APRIL - Current Global Macro - Part III


WEST TEXAS CRUDE (WTIC) v INFLATION BREAKEVENS

Another well-known flaw in the Treasury inflation-protected securities, or TIPS market, is that it sees the 10-year Breakeven move in the same direction as the oil price. This is caused by the widespread use of TIPS for hedging moves in oil futures.

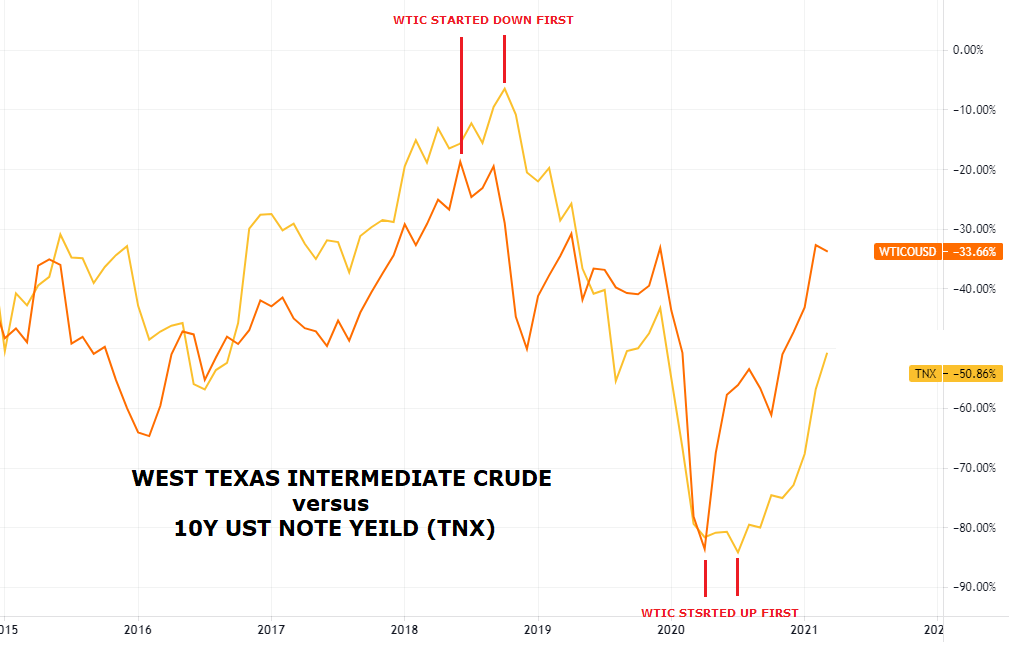
Since 2015 and particularly in 2019 WTIC has been closely mirroring 10Y US Treasury Yields. With an important tell: it leads by a few months as illustrated below. The March pullback from a high of $68/bl to a low of $57/bl we believe is signalling a corrective / consolidation pullback in both WTIC and the 10Y UST Note Yields.

Dhaval Joshi, European strategist at BCA Research Inc., suggests this is a major market inefficiency, as oil prices and inflation forecasts should be negatively rather than positively correlated. He shows that moves in the oil price do tend to have an impact on realized inflation over the next decade, but not in the direction we might expect. Higher oil prices mean lower subsequent inflation, and vice versa. There is some intuition for this.

  • First, higher oil prices act like a tax increase, and tend to dampen consumption. They should therefore be treated as similar to a mild tightening in fiscal policy.
  • Additionally, when the oil price starts high, all else equal, the odds increase that it will be lower 10 years hence. This in itself will bring down the rate of inflation.

A simple trading strategy that has worked over the last 20 years. When oil is above $50 (as now), that implies investors are overestimating future inflation, so you should get out of TIPS and buy conventional T-bonds instead. The reverse holds if the price goes below $50. Following this rule would have led you to buy TIPS when the oil price tanked a year ago, which would have worked out very well. And it would cause you now to buy Treasury bonds rather than TIPS.

The bottom line is that bond market inflation expectations are too high.

THE COPPER/GOLD v YIELD CORRELATION

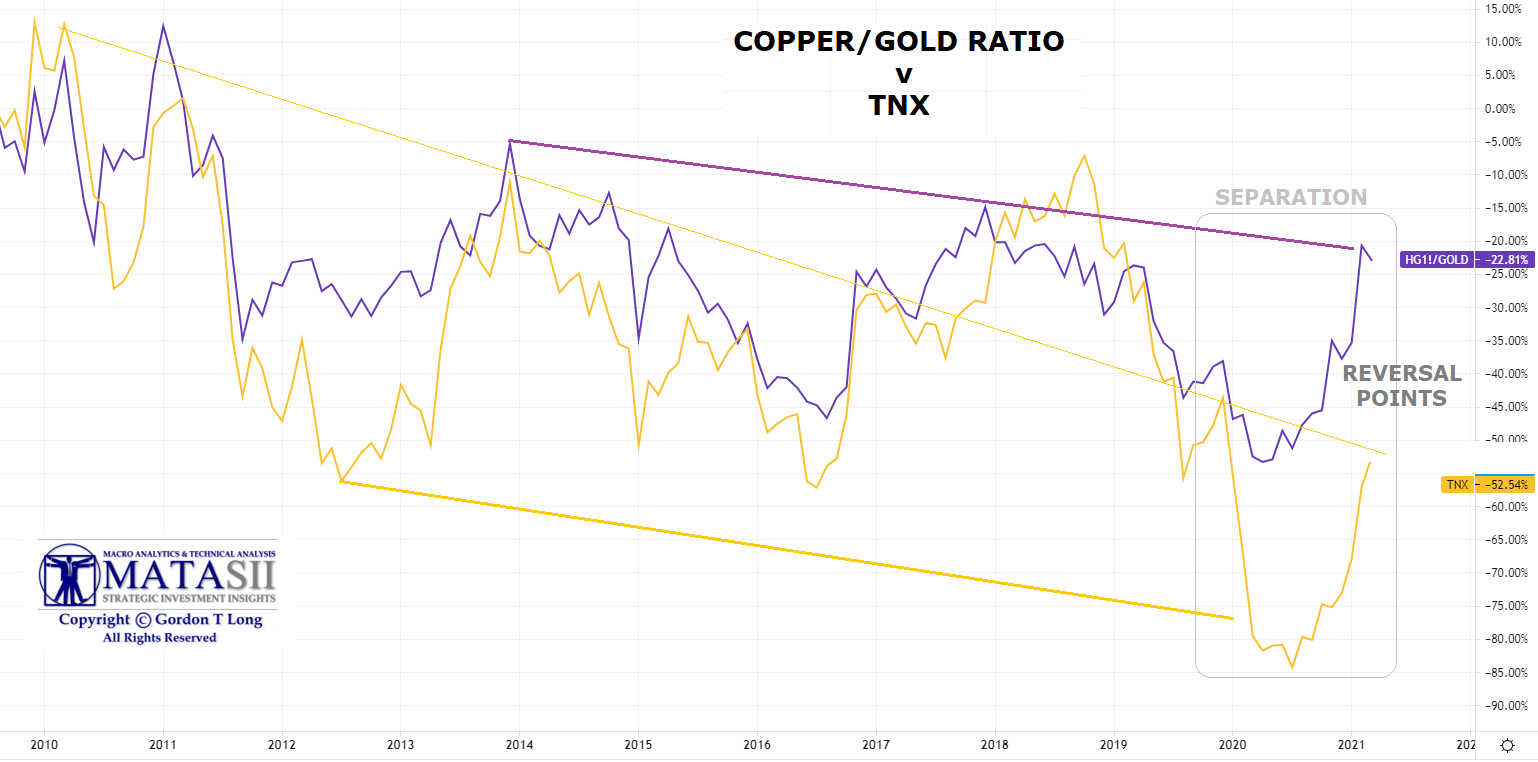
We have found that the Copper/Gold ratio is a good short term leading indicator of TNX yields.

There is a strong correlation between the Copper/Gold ratio and the 10Y UST Yield (TNX) as we illustrated in our last newsletter. If Copper does start to correct as we pointed out, it is likely that its’ mirror, the TNX will also begin to head lower.

10Y UST REAL YIELD

FISHER EQUATION

Nominal Yields = Breakeven Yield + Real Yield

We are also witnessing the 10Y Treasury Inflation Indexed Security Rate (the proxy for 10Y Real Rates) beginning to roll over. If bond yields do start to head lower there is a strong chance that the real rate will touch its support level of -1% by early summer.

WTIC MEASURED BY GOLD

As we see below, the correlation between WTIC as measured in Gold has very closely mirrored the 10Y UST Note Yield.


FOLLOWING DETAILED ANALYSIS IS SUBSCRIBER CONTENT ONLY

Subscribe to view full post content with supporting live charts
 

FAIR USE NOTICE  This site contains copyrighted material the use of which has not always been specifically authorized by the copyright owner. We are making such material available in our efforts to advance understanding of environmental, political, human rights, economic, democracy, scientific, and social justice issues, etc. We believe this constitutes a ‘fair use’ of any such copyrighted material as provided for in section 107 of the US Copyright Law. In accordance with Title 17 U.S.C. Section 107, the material on this site is distributed without profit to those who have expressed a prior interest in receiving the included information for research and educational purposes.  If you wish to use copyrighted material from this site for purposes of your own that go beyond ‘fair use’, you must obtain permission from the copyright owner.


NOTICE  Information on these pages contains forward-looking statements that involve risks and uncertainties. Markets and instruments profiled on this page are for informational purposes only and should not in any way come across as a recommendation to buy or sell in these assets. You should do your own thorough research before making any investment decisions. MATASII.com does not in any way guarantee that this information is free from mistakes, errors, or material misstatements. It also does not guarantee that this information is of a timely nature. Investing in Open Markets involves a great deal of risk, including the loss of all or a portion of your investment, as well as emotional distress. All risks, losses and costs associated with investing, including total loss of principal, are your responsibility.