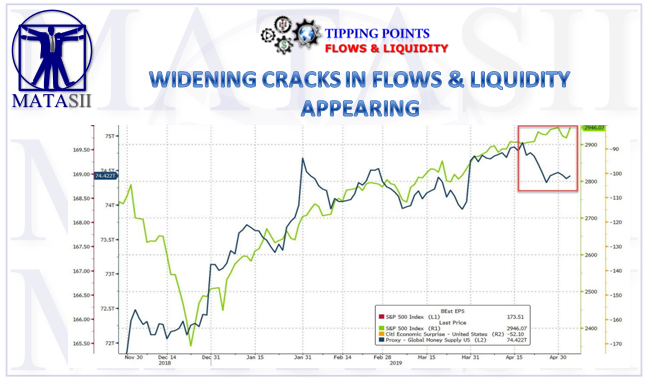
WIDENING CRACKS IN FLOWS & LIQUIDITY APPEARING
I am becoming increasingly concerned about Flows & Liquidity. The Fed's sustained QT measures are still occurring and the cumulative effect is now reverberating through the financial markets.
Money Supply as the primary driver of the market has recently begun to diverge from the equity markets.

It appears that:
- The brief rebound in domestic US money supply growth triggered by repatriation of funds from the euro-dollar market in the wake of last year's tax cuts has by now dissipated,
- Preliminary data indicate that the slowdown in TMS-2 growth continues so far in April - currently the y/y growth rate stands at just 1.7%.
- The continuing slowdown in money supply growth represents a palpable threat to the bubble in asset prices.
Pater Tenebrarum (Acting Man) concludes that the liquidity drought is getting worse:
The continuing slowdown in money supply growth represents a palpable threat to the bubble in asset prices. A fairly sharp decline in the US economic surprise index in recent months indicates that the lagged effect of slowing money supply growth on economic activity has already become noticeable.
At the same time it seems likely that spending from the Treasury's general account has bought a temporary reprieve and inter alia helped egg on the recent rebound in stock prices by improving financial market liquidity in February/March. Investors generally pay little attention to this data point, but we believe the account has become too big to be ignored.
Now that the Treasury's spending spree appears to be over, it may be time to become cautious toward risk assets again, not least in light of other warning signs beginning to proliferate again (intra-market divergences between different stock market indexes, price/momentum divergences, overly bullish sentiment and positioning, etc.).
Apart from these short-term considerations it should be clear that the current rate of money supply expansion is generally not conducive to a continuation of the asset bubble. Eventually, there will be a more sticky and painful downturn in the prices of stocks and corporate bonds.
He lays out his proof as follows:
Money Supply Growth Continues to Falter
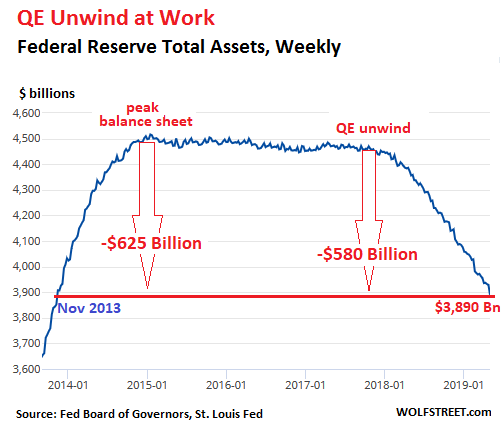
Ostensibly the stock market has rallied because the Fed promised to maintain an easy monetary policy. To be sure, interest rate hikes have been put on hold for the time being and the balance sheet contraction (a.k.a."quantitative tightening") will be terminated much earlier than originally envisaged. And yet, the year-on-year growth rate of the true broad money supply keeps declining noticeably.
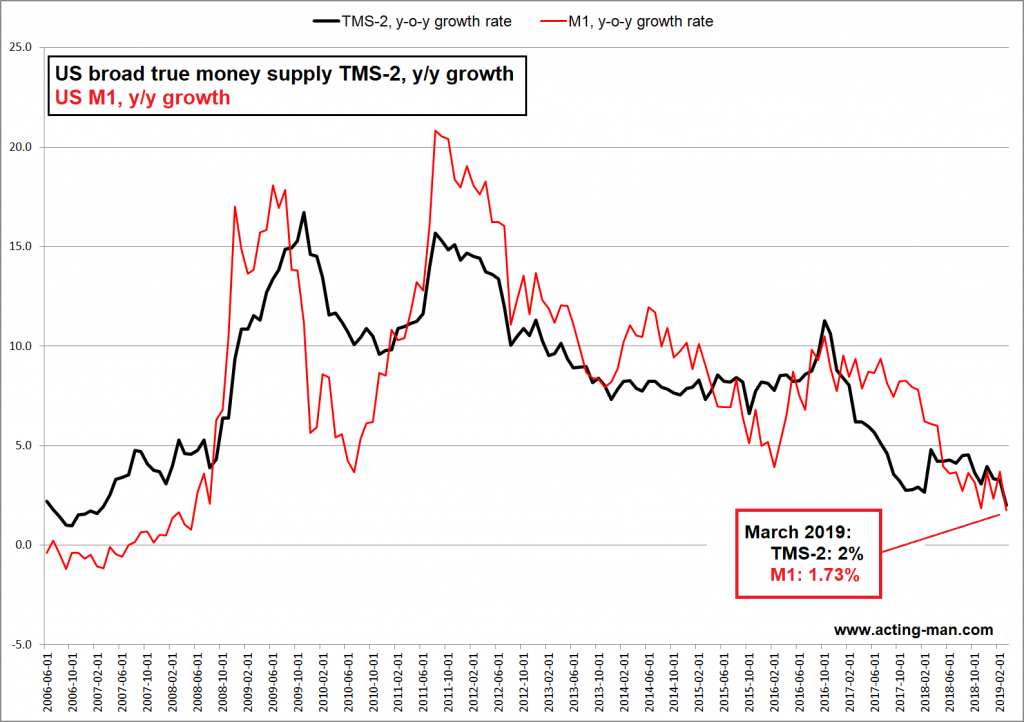
The year-on-year growth rates of US TMS-2 (broad true money supply) and the narrow money aggregate M1. Y/y growth of TMS-2 has declined to a new 12-year low as of March 2019. For some background on the calculation of TMS-2 see Michael Pollaro's excellent summary at Forbes.
It certainly seems as though the brief rebound in domestic US money supply growth triggered by repatriation of funds from the euro-dollar market in the wake of last year's tax cuts has by now dissipated. Preliminary data indicate that the slowdown in TMS-2 growth continues so far in April - currently the y/y growth rate stands at just 1.7% (h/t Michael Pollaro). Meanwhile, the contraction in outstanding Fed credit has accelerated to a quite hefty 11% y/y.
The next chart shows the most recent data on G3 (US, euro area and Japan) TMS growth rates. In the euro area, TMS growth has moderately accelerated compared to the previous three months. At 6.9% as of February, it remains below the 7% threshold though. TMS growth in Japan stands at just 5.4%. Both readings are substantially below their respective 2015-2016 peaks.
TMS-2 growth in the G3, via Michael Pollaro - while money supply growth rates in Europe and Japan remain significantly higher than in the US, they are probably no longer strong enough to effectively offset the slowdown in US money supply growth.
The Treasury Account Yo-Yo
"Austrian" money supply measures such as TMS-1 and TMS-2 differ in a number of aspects from official money supply aggregates, based on a very strict and straightforward definition of money (see Michael's article for the details). One of the differences is that certain memorandum items on the Fed's balance sheet are included in money TMS, for the simple reason that they do indeed represent money.
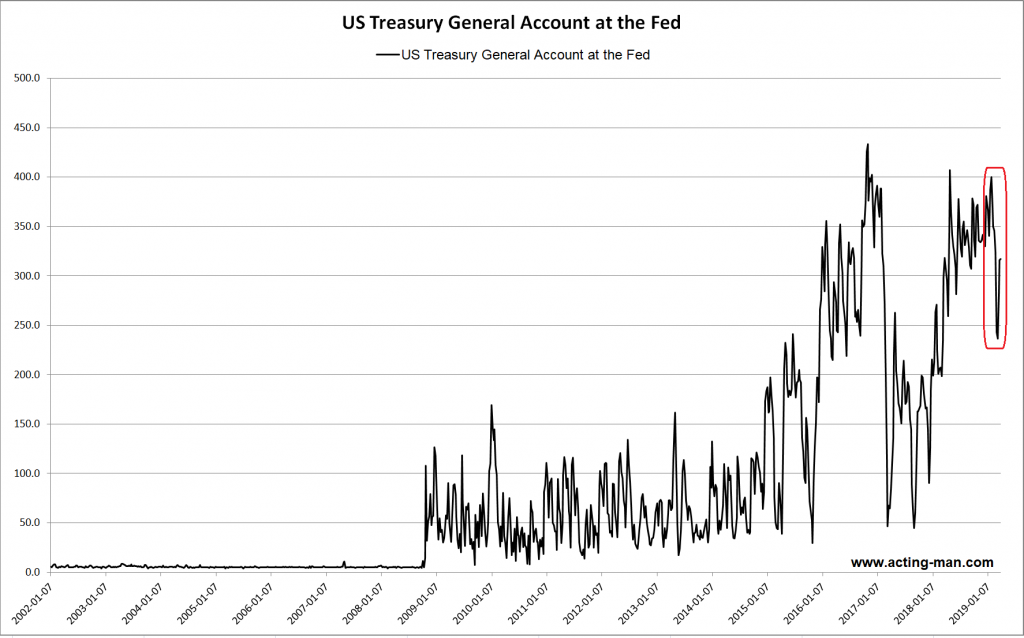
Before the 2008 crisis, these memorandum items made almost no difference to the total money stock and its growth rates, as the amounts involved were very small and changed only very little over time. This has changed since the crisis. In particular, the US Treasury's general account at the Fed has become a factor that occasionally affects both TMS growth and economic and financial market activity. Below is a long term chart - we have highlighted the recent activity in the account:
US Treasury general account at the Fed since 2002. The two large spikes in 2016 and 2018 both occurred in the context of the repatriation of US dollars from the euro-dollar market. In 2016, money market funds redirected their investments into t-bills to comply with new regulations, and in the wake of the tax reform in 2018, a number of US companies repatriated cash previously held overseas. The US Treasury in both cases issued t-bills to accommodate these funds, as the sudden surge in demand for t-bills would otherwise have interfered with the Fed's monetary policy. Normally, (i.e., absent such inflows of dollars previously held abroad) changes in the Treasury's general account balance should be by and large neutral with respect to the growth rate of TMS, as the money accumulating in the general account would come from the bank deposits of investors buying t-bills.
Take a close look at the most recent gyrations in the Treasury's account. Between late January and mid-March, the account was drawn down from a peak of $400 billion to a trough of $236 billion. In other words, the Treasury started to spend the money. It is unknowable how exactly it was spent, but presumably quite a bit was used to redeem t-bills coming due.
Ceteris paribus this should be neutral in terms of TMS growth, as the decline in the amount of money held in the Treasury's account will be offset by an equally large increase in deposit money held by the recipients of the money.
However, before the Treasury embarked on this recent spending spree, the money in its account was "idle", i.e., it had no immediate effect on market and economic activity. It seems likely to us that financial market liquidity benefited substantially from this sudden $160 billion influx, even if it didn't alter the total stock of money. It is worth noting in this context that funds in the account have in the meantime begun to grow again (level as of April 01: $317 billion).
Charts by Michael Pollaro and acting-man.com based on data by St. Louis Fed, ECB and BoJ.

[SITE INDEX -- TIPPING POINTS - FLOWS & LIQUIDITY]
A PUBLIC SOURCED ARTICLE FOR MATASII
READERS REFERENCE: (SUBSCRIBERS & PUBLIC ACCESS)

MATASII RESEARCH ANALYSIS & SYNTHESIS WAS SOURCED FROM:
SOURCE: 04-19-19 - - "The Liquidity Drought Gets Worse"
FAIR USE NOTICE This site contains copyrighted material the use of which has not always been specifically authorized by the copyright owner. We are making such material available in our efforts to advance understanding of environmental, political, human rights, economic, democracy, scientific, and social justice issues, etc. We believe this constitutes a 'fair use' of any such copyrighted material as provided for in section 107 of the US Copyright Law. In accordance with Title 17 U.S.C. Section 107, the material on this site is distributed without profit to those who have expressed a prior interest in receiving the included information for research and educational purposes. If you wish to use copyrighted material from this site for purposes of your own that go beyond 'fair use', you must obtain permission from the copyright owner.
NOTICE Information on these pages contains forward-looking statements that involve risks and uncertainties. Markets and instruments profiled on this page are for informational purposes only and should not in any way come across as a recommendation to buy or sell in these assets. You should do your own thorough research before making any investment decisions. MATASII.com does not in any way guarantee that this information is free from mistakes, errors, or material misstatements. It also does not guarantee that this information is of a timely nature. Investing in Open Markets involves a great deal of risk, including the loss of all or a portion of your investment, as well as emotional distress. All risks, losses and costs associated with investing, including total loss of principal, are your responsibility.