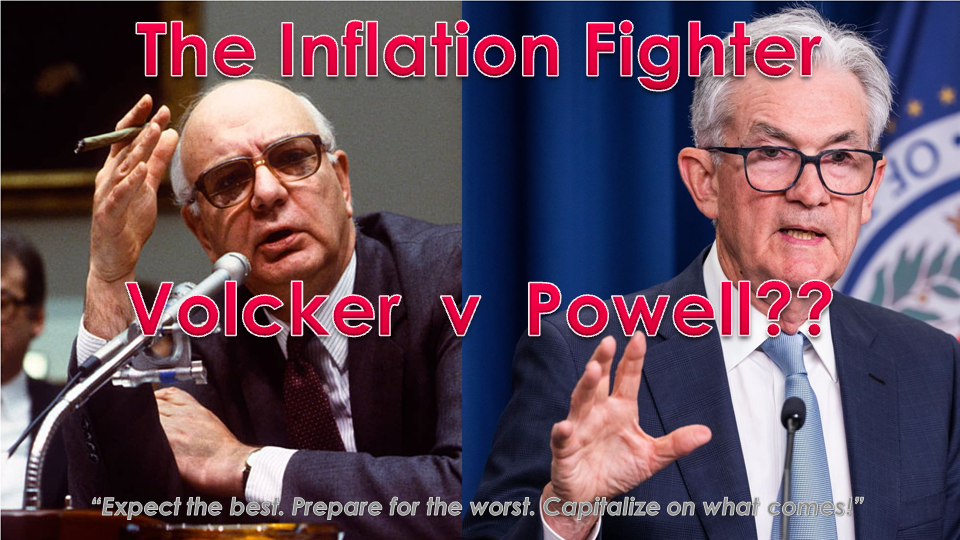
IN-DEPTH: TRANSCRIPTION - LONGWave - 08-09-23 - AUGUST - The Inflation Fighter -- Volcker v Powell??
SLIDE DECK
TRANSCRIPTION
SLIDE 2
Thank you for joining me. I'm Gord Long.
A REMINDER BEFORE WE BEGIN: DO NO NOT TRADE FROM ANY OF THESE SLIDES - they are COMMENTARY for educational and discussions purposes ONLY.
Always consult a professional financial advisor before making any investment decisions.
SLIDE 3
Despite three recessions in nine years, double-digit unemployment and two stock market crashes, the mid-to-late 1970s and early 1980s witnessed the highest inflation since the end of World War II. By 1981, inflation had reached 15% and interest rates were raised to 20% to combat the inflation.
SLIDE 4 – AGENDA
When Paul Volcker was appointed Fed chair in 1979, he immediately set about ending the worst inflation the U.S. had seen since the end of World War II by raising rates.
Then, the U.S. was hit with a recession in January 1980, and Volcker was under intense pressure to cut rates in the face of a recession and layoffs.
He blinked. Volcker lowered the fed funds target rate by seven percentage points.
The recession was over by July 1980, but inflation was not. The Fed and Volcker had damaged their credibility as inflation fighters.
This became known as the infamous Volcker Mistake.
Powell does not want to repeat the Volcker Mistake. He knows how that turned out and doesn’t want to end up in the history books for making the same mistake!
However, Powell is on exactly the same path Volcker was on before he saw the light. Can we trust that Powell is seeing the same light and maybe just as importantly, has he the will and fortitude Volcker had when it was called upon?
SLIDE 5 – HISTORY DOESN’T REPEAT BUT IT OFTEN RYHMES!
As I am sure you have often heard: “History Doesn’t Repeat Itself, but it often Rhymes!”
Having started my professional career in the early 70’s, it was a decade I clearly remember! I joined IBM right out of university and was engaged in marketing sales and installation of computer systems to a world only beginning to adopt computer technology. I was involved in endless consulting selling sessions trying to convince corporations to adopt the new technology in their fight against relentless rising costs.
Every presentation talked about inflation in some way or the other! That focus lasted for a decade and went through differing stages but was always nevertheless ever-present.
SLIDE 6 – THE THREE INFLATION WAVES OF THE 70’S
There were three waves of Inflation. Waves that were as much about learning how to handle it as fiscal policies and geo-political events.
The first stage actually began in the late 60’s, as shown here. It was about the US using its “credit card” for the first time to finance major social changes and a war.
President Johnson’s Great Society did not dramatically raise taxes to finance it nor did the Vietnam War ask taxpayer to buy War Bonds as it had always previously done.
Rather, the US just printed the money without the requisite gold backing to support it.
SLIDE 7
This led to the inflation spike that took inflation to an eventual high of 9.2%.
The only way to stop it was to raise rates through increasing the Fed Funds Rate.
SLIDE 8
The Fed Funds Rate was steadily increased to halt inflation until it reached 6.2%
Rates at that level drove the economy into the recession of 1970. Dis-inflation and deflation took control and the Fed followed by immediately lowering the Fed Funds Rate. The Fed Funds Rate as you can see actually led the drop in inflation, but failed to halt the economy from worsening until inflation was 1/3 of what it had been.
Subsequently in August 1971 President Lyndon took the US officially off the gold standard as he tried desperately to fiscally revive the economy.
SLIDE 9
The US then experienced a second round of inflation from 1972-1975, as the official inflation measure, the Consumer Price Index or CPI, rose from 3.3% to 11.1%. This was nearly twice the peak experienced in the first wave.
The oil embargo of 1973-74, pushed prices of petroleum from $15 to $45 a barrel (in 2010 dollars) almost overnight. This certainly contributed to the renewed inflationary measures during this period, taking a larger share of incomes (an "oil tax" if you would) at a time of falling consumer spending.
SLIDE 10
During this period, the Fed now chaired by Arthur Burns, once again attempted to rein in inflation by aggressively hiking the Fed Fund Rate. This time rates were taken into the 12% range before once again taking the US into yet another recession.
Again this forced the Fed to take rates down quickly to fight the recession of 1975-1977.
SLIDE 11A
The CPI only fell to 5.7% in 1976 before rebounding and eventually peaking at 13% in 1980.
Burns was replaced William Miller as Fed Chair in 1978, but Miller only lasted a year, as his efforts to end inflation proved similarly futile. The Fed again raised rates from 6.75% to 10.5% during Miller’s tenure, but inflation continued to rise from 7.6% to 11.3%
SLIDE 11B
As I mentioned earlier, When Paul Volcker was appointed Fed chair in 1979, he immediately set about ending the worst inflation the U.S. had seen since the end of World War II by also raising rates.
Once again the U.S. was hit with a recession in January 1980, and Volcker was under intense pressure to cut rates in the face of a recession and layoffs.
Volcker capitulated and lowered the fed funds target rate by a staggering seven percentage points.
The recession was over by July 1980, but inflation was not.
The Fed and Volcker had damaged their credibility as inflation fighters.
This became known as the infamous Volcker Mistake.
SLIDE 12
In many ways it was an unfortunate label because Volcker had actually realized that he needed to both drain excess reserves and liquidity from the financial system and raise rates. It was only by doing both concurrently would he get any sustainable traction.
Volcker had been President of the all powerful NY Fed prior to assuming the Fed Chair position so he was already engaged in attempting to remove the froth from the financial system, while letting rates move in a wider range in order to tighten policy to the point that inflation finally disappeared.
The effect was a severe recession (from July 1981-November 1982), but CPI also came down, eventually falling to ~3% in 1983. From that Volcker assumed the stellar and enviable reputation he has today.
SLIDE 13
It is clear from the CPI in the 1970s that rate hikes didn’t end inflation… but only by also draining excess reserves did it.
SLIDE 14
Volcker no doubt had serious challenges to contend with, but compared to what Jerome Powell faces today they look rather straight forward.
Chairman Jerome Powell finds himself on a precipices edge and in many ways in a “Catch 22”.
A Catch 22 on multiple dimensions which would be described by most as simply another way of describing a ‘TRAP’!
SLIDE 15
The Fed’s total Assets as a share of Gross National Product never approached those that Paul Volcker faced until the 2008 Great Financial Crisis. After four decades of the Great Moderation we were suddenly and abruptly brought into the hard reality of what we call the “Great Fiat Gamble”. We were suddenly forced into Chairman Ben Bernanke’s era of Quantitative Easing and “Enrich-Thy-Neighbor” doctrine of the coordinated “ring around the daisy’ game of fiat currency debasement.
The gamble bought us another decade but took the US and Global debt levels well passed the 90% of GDP so well documented by Reinhardt, Reinhardt & Rogoff as the level at which GDP can be expected to start contracting because servicing of the debt historically has then been shown to restrict investment growth.
This is a problem since that is when you must start squeezing liquidity to get inflation under control.
As this chart shows (in the upper right) this is what the Fed’s Quantitative Tightening or QT was initially aimed at. To reduce the Fed’s balance sheet and rein in liquidity.
SLIDE 16
Unfortunately it didn’t take long for the Fed Funds Rate to break something again. This time it was the Banking System in March which was temporarily contained to give the Fed more time to fight inflation.
The Fed Fund Rate now trades around ~5.5%. More breakage is to be expected as the US Commercial Real Estate market is currently under heavy assault.
SLIDE 17
The Fed isn’t going to get the rate much higher for much longer before a recession takes the bottom out from under it. Our prior charts of the 1970’s conclusively show us that.
As well, everyone is front running the expectations of a Fed pivot with rates anticipated as heading lower. But Oh, if it was only that simple!
The world has come to totally depend on the US Consumer and a its’ 70% consumption economy financed by deficit spending. Fiscal deficits by which Current Account and Balance of Payments accounting drive global growth and the Eurodollar system. It is called the Triffin Paradox.
A sick US can quickly become a pandemic for the rest of the world
SLIDE 18
- Lowering Rates doesn’t fight inflation.
- A growing Fed Balance Sheet doesn’t reduce liquidity!
- Too much growth in the Fed’s Balance Sheet and the Dollar comes under attack and import inflation hits.
- Too slow a change in either and the recession leads to unemployment and attacks social entitlement funding.
SLIDE 19
Both together creates even a greater debt burden load
SLIDE 20
Too fast a reduction in the Fed Funds Rate and the recession becomes deeper and longer!
SLIDE 21
Too fast a reduction in the Fed Funds Rate and real rates come under attack which makes attracting foreign debt financing more difficult and more expensive.
SLIDE 22
If anything breaks while this balancing act is attempted, would be like a strong gust of wind occurring while doing a high wire act. Your chances of a survival are slim to none!
A position the US and world has never been in before!
SLIDE 23
This unexpected gust of wind can take many forms but are all POTENTIAL Powell Poison!
SLIDE 24
Unfortunately Powell must worry as much about the global economy as the US.
This chart from December 22 shows the combined total assets of the Fed, ECB and BOJ.
The Monetary actions of these three countries shows in the upper right corner as the Fed began Quantitative Tightening or QT.
As the consolidated balance sheets were taken down the markets contracted from the removal of liquidity and tightening bank and lending credit standards. This was as needed to fight Inflation
SLIDE 25
But something happened at the beginning of the year and accelerated in March?
This year they stopped moving together? Liquidity has gone down YTD but the S&P 500 has gone up => way up!
SLIDE 26
From December 2022 to June 2023 the combined total assets fell by $840B or by 4%. Whereas between December 2022and July 25th 2023 the S&P 500 rose by 730 points or 19%!
SLIDE 27
This divergence from the normal pattern could be:
- A warning signal that the stock market has gotten ahead of itself and is at risk of a great tumble … or
- The surge in the S&P 500 could simply reflect a great improvement in expectations for fundamentals resulting from the AI Revolution which we identified in January when Avidia and the “Magnificent Seven” began taking the markets higher. … or
SLIDE 28
- The stealth liquidity pumping that came from the Bidenomics Stealth Liquidity Pump. I have described this pump in our weekly newsletter. It basically used the Banking Crisis and it BTFP to stabilize banks against deposit withdrawals which were invested in Money Market Funds which reduced their RRP holdings at the Fed to buy Treasury Bills needed to fund the Treasury General Account (TGA).
This created a spike in liquidity initially seen in a temporary surge in the Fed Balance sheet before stabilizing with the resolution of the Debt Ceiling increase and replenishment of the TGA.
Bidenomics is pumping liquidity in the form of MMT through this approach, student loan forbearance extensions, income tax deferrals and direct green energy subsidies that places money directly in the hands of the consumer without being lent into existence.
Bidenomics is about getting re-elected and is completely devoid of a full appreciation or caring about what Volcker so painfully learned and Powell is very much cognizant of!
SLIDE 29
Bidenomics in the short term is manipulating the system for political advantage. This is to be expected if this was business as usual and not the situation we find ourselves presently in. Joe Biden is playing the well rehearsed script he has learned over the past 40 years. But is completely the wrong script for today’s environment.
SLIDE 30
Fiat currencies are in serious trouble as China, Russia, Saudi Arabia and the various BRICS alliances gain power to combat the Weaponization of the US dollar as a political weapon as the US takes full advantage of the “exorbitant privilege” of the US dollar to take on debt at the world’s expense.
SLIDE 31
Though this chart is dated and doesn’t reflect the massive increase since Covid and $7T of Bidenomics, it does illustrate that debt is now overpowering global economies abilities to sustain it with real economic growth
SLIDE 32
The reality is that all Fiat Currencies have historically failed and we are well on that road as global debt levels become unsustainable and inextinguishable. The evidence is all around us if we care to actually look.
As we move towards the next block in the upper right corner of “Failure” …
SLIDE 33
… We will likely go through the stages outlined here. We laid these out in this year’s Thesis paper available on our site.
SLIDE 34
The red box is the area we are currently operating in as we move towards Hyperinflation in the bottom right of this representative schematic.
SLIDE 35
The coming inflation will bring further dis-inflation but we will see continued Inflation in the things we need and need cash to pay for with Deflation in assets we borrow to finance
The big Tsunami wave of Inflation is still in front of us!
SLIDE 36
The conclusions are pretty clear.
SLIDE 37
We are highly likely going to repeat the 1970’s unless we alter coarse quickly.
SLIDE 38
The waves are going to be driven slightly differently and are highly likely going to be much more dramatic and impactful.
Chairman Jerome Powell will do all he can but he needs a White House that isn’t just setting him up for failure. The one thing that is a given about Bidenomics is that it always immediately blames someone else for its policy blunders.
Powell and the Federal Reserve is being set up to be a fall guy as the administration reaches for more power during the inevitable crisis ahead. It is all right out of the Marist manual for revolution.
As President Barack Obama & vice President Joe Biden so well practiced – “never let a crisis go without taking full political advantage of it!”
SLIDE 39
As I always remind you in these videos, remember politicians and Central Banks will print the money to solve any and all problems, until such time as no one will take the money or it is of no value.
That day is still in the future so take advantage of the opportunities as they currently exist.
Investing is always easier when you know with relative certainty how the powers to be will react. Your chances of success go up dramatically.
The powers to be are now effectively trapped by policies of fiat currencies, unsound money, political polarization and global policy paralysis.
SLIDE 40
I would like take a moment as a reminder
DO NO NOT TRADE FROM ANY OF THESE SLIDES - they are for educational and discussions purposes ONLY.
As negative as these comments often are, there has seldom been a better time for investing. However, it requires careful analysis and not following what have traditionally been the true and tried approaches.
Do your reading and make sure you have a knowledgeable and well informed financial advisor.
So until we talk again, may 2023 turn out to be an outstanding investment year for you and your family?
I sincerely thank you for listening!


