Gordon T Long
Global Macro Research | Macro-Technical Analysis
TIPPING POINTS
CONSUMER CONFIDENCE
CRACKING CONFIDENCE & CRUMBLING COLLATERAL
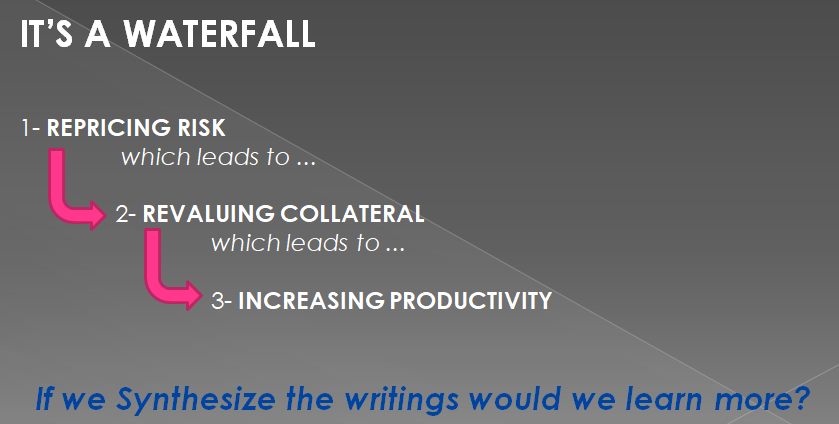
In our latest Macro Analytics video, Charles Hugh Smith and I review the “Waterfall” that is presently underway in the area of:
-
- The Repricing of Risk
- The Revaluing of Collateral, and
- A Forced Increase in Productivity
Small Business Confidence leads Recessions and the Waterfall!. This is because they see and experience the impacts first. Small Business has their hands on the “pulse” of the economy. The media consistently only parrots the lagging data points.
Crippled Consumer Confidence and financing is at the root of current Small Business problems. Fear crimps their confidence and willingness to take risk. Fear of losing jobs and not paying bills because of inflation and possible layoffs crimps the consumer.This is what small business is feeling and seeing in sales activity. We discuss Business and Consumer Confidence in this newsletter below.
We have seen the beginning of a Banking Crisis and mounting concerns about Commercial Office Real Estate … the next will be problems within Corporate Debt! We feature this development in the “Current Market Perspectives” section below.
=========
WHAT YOU NEED TO KNOW
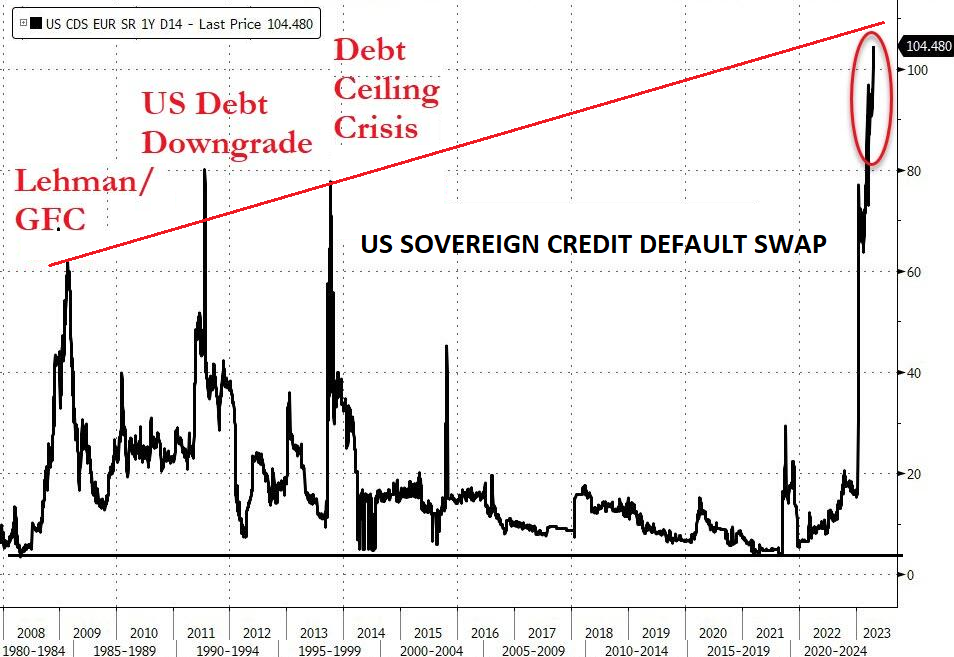 US SOVEREIGN CREDIT RISK GOING PARABOLIC?
US Sovereign credit risk protection has never cost so much as it currently does with anxieties going parabolic. The US Sovereign risk has now reached a record high. This is more than simply the ongoing worries about a potential US Debt ceiling default. This is now more about concerns regarding the US dollar weakening and with it dollar denominated assets on a global basis! It is about:
i) Repricing of US Risk
ii) Revaluing of US Collateral and
iii) Continuingly Falling US Productivity
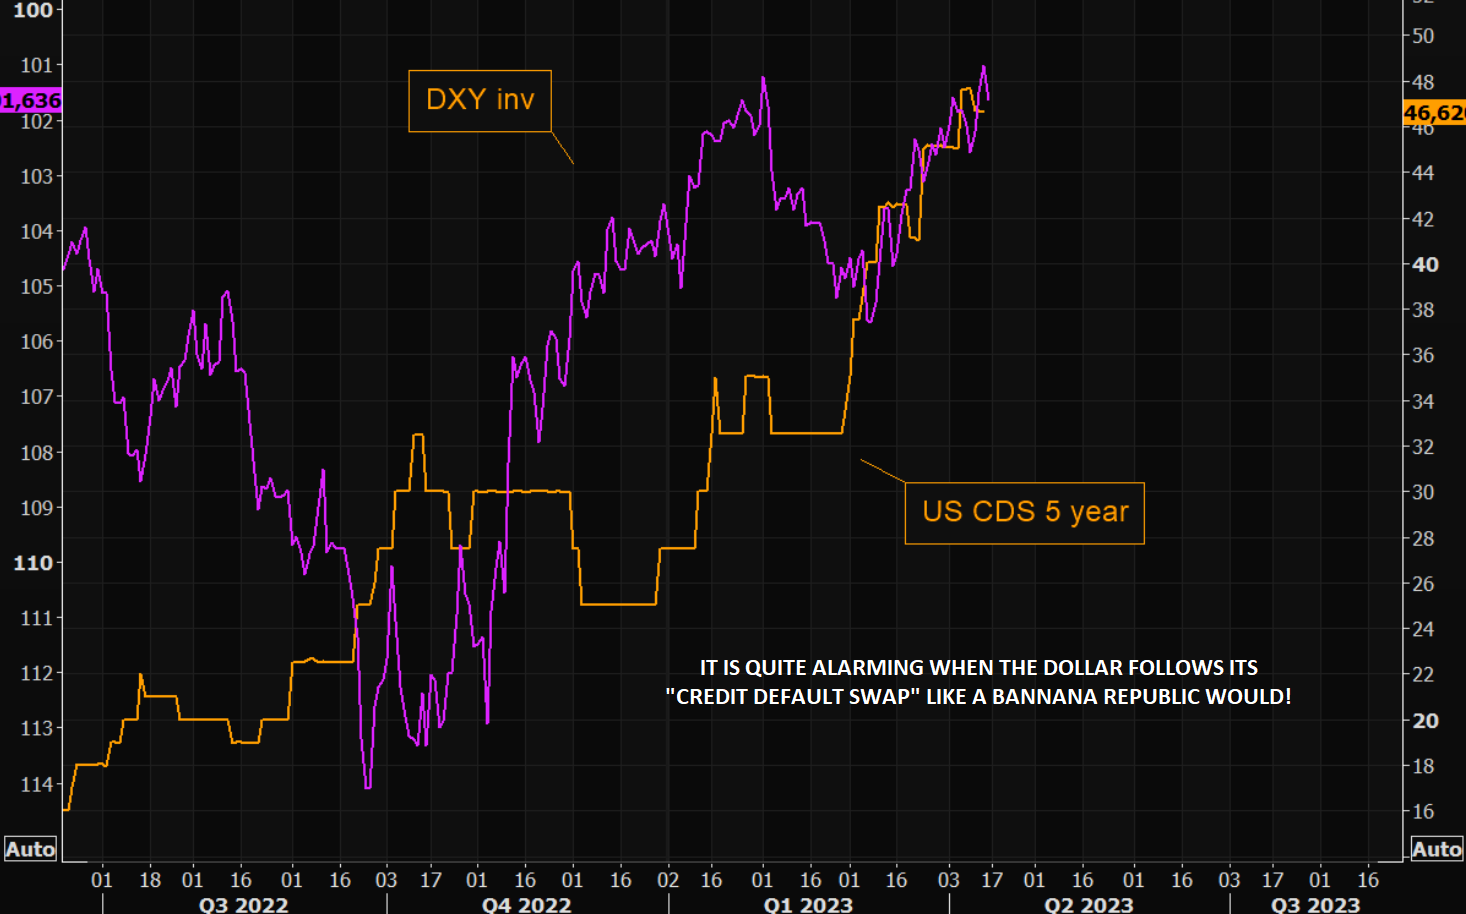
US DOLLAR v CREDIT RISK: It Is Alarming When the US Dollar follows US Sovereign Credit Default Risk!!
-
- There is a very real possibility of a US Credit Downgrade occurring during the ongoing Congressional negotiations to increase the current debt ceiling of $31.4T.
- The US debt has doubled since the last downgrade in 2011 (from AAA to AA+), while US Sovereign Debt has since generally become less attractive (or shunned) by foreign sovereign buyers for official Currency Reserve purposes.
IT’S A “WATERFALL”: A Cascading Effect!
-
- We have entered a Waterfall with: i) Repricing of US Risk, ii) Revaluing of US Collateral and iii) Continuingly Falling US Productivity.
- My Co-Host of Macro Analytics, Charles Hugh Smith writes a post video article summarizing “It’s a Waterfall” Over the Falls: Credit, Collateral, Risk, Asset Valuations.
SMALL BUSINESS CONFIDENCE: Small Business Confidence Leads the Way!
-
- The NFIB Small Business Optimism Index has been steadily falling since Covid-19 struck and has not relented in its weakening since. We have written about concerns with Small Business landing in prior newsletters.
- Historically, when the NFIB Small Business Confidence Index falls below the mid 90’s, we soon enter a US Recession! At 90.1 and rapidly falling, it will take some major developments to reverse what lies ahead.
CONSUMER SENTIMENT & CONFIDENCE: The Driver of a 70% US Consumption Economy!
-
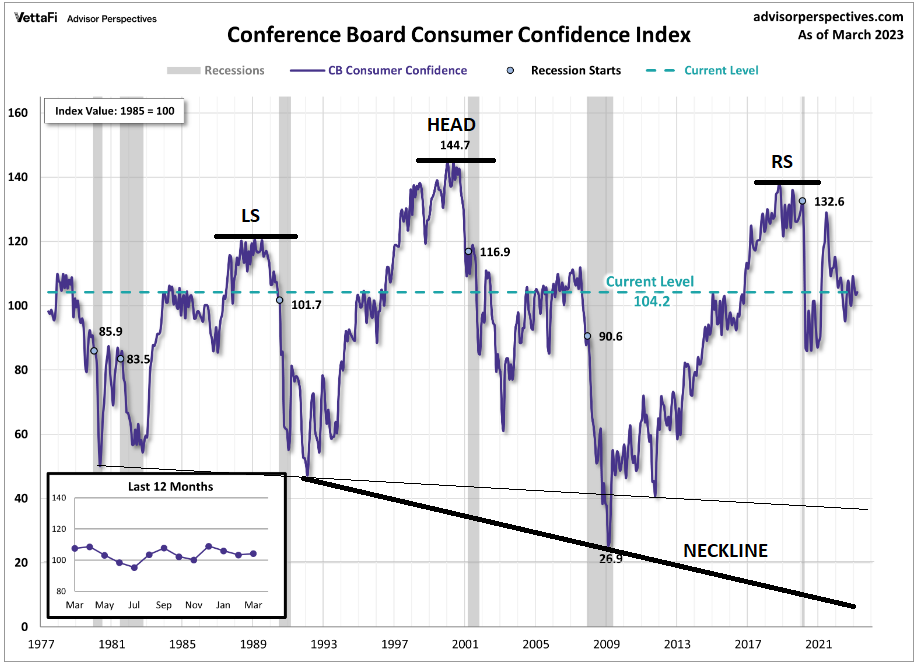
- In addition to the NFIB Small Business Optimism Index exhibiting a Head & Shoulders Pattern, we additionally have major Head & Shoulders patterns appearing across both Consumer Confidence Board’s Index and U. of Michigan’s Consumer Sentiment Index as well as the S&P 500.
- This is particularly alarming in a 70% Consumption Economy like the US, driven historically by Small Business and Consumer Confidence and fed by market confidence in S&P 500 for IRA/401K Retirement holdings!
- Watch “OEM” Traders for possible timing of a breakdown in market and consumer confidence.
CONCLUSION
 Q1 EARNINGS: The Conference Calls Tell The Story!
-
- It appears that negative earnings revisions are accelerating.
- Global earnings expectations are now trending lower again. The 1-month net global EPS revisions have fallen to -15.% from -7.2% last month, and the more significant 3-month net global revisions are now at -13.7%, down from -13.2% over recent weeks.
In this week’s “CURRENT MARKET PERSPECTIVES”
we focus on:
CORPORATE BOND MARKET: The “Zombie”
HY Bonds Are A Shoe About to Drop!
-
- Zombie lending and “rollover” refinancing is about to be amplified with the ongoing credit crunch, as banks weathering huge holes in their balance sheets, are now less willing to lend or will only do so at higher rates.
- Banks have tightened lending by the most they ever have and credit availability just saw its largest drop in 20 years, according to the most recent small business lending survey.
- The next six months to a year are going to be extremely challenging in terms of making sure that companies can service their debt. Expect many to face bankruptcy or takeovers!
We should all be alarmed when the US$ follows the movements in the US Credit Default Swap Rate!
=========
US DOLLAR v CREDIT RISK: It Is Extremely Alarming When the US Dollar follows US Sovereign Credit Default Risk!!
 Recently we have witnessed the US Dollar start to track quite closely to US Sovereign Debt Default Risk or CDS (Credit Default Swaps) pricing. This likely reflects both concerns with both a potential devaluation of the US Dollar, in addition to the very real possiblility of a US Debt Rating downgrade.
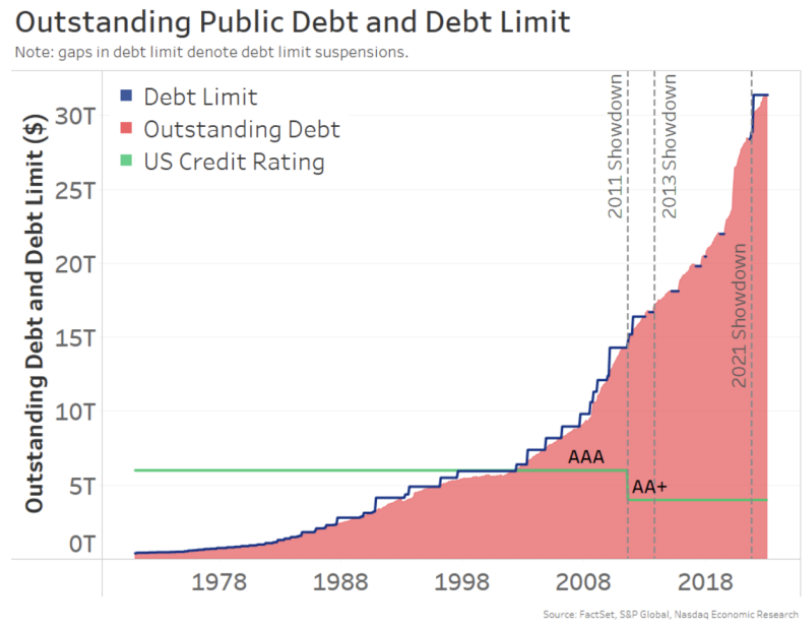
The worry now is of a Debt Rating downgrade, triggered by US Congressional fumbling of increasing the legal Debt Ceiling limit, in a timely manner.
The US debt has increased dramatically from ~15T to ~ 31.4T or double since the last downgrade in 2011. At that time US debt was downgraded from AAA to AA+, which was also during a period of Congressional Debt Ceiling negotiations!
IT’S A “WATERFALL”: It’s A Cascading Effect!
My Co-Host of Macro Analytics, Charles Hugh Smith writes a post video article summarizing “It’s a Waterfall”:
Over the Falls: Credit, Collateral, Risk, Asset Valuations
Together, these factors generate a self-reinforcing cycle of debt saturation, declining collateral and credit contraction.
 If we want to understand where the economy is going, credit and risk are good places to start. Credit/debt is how the system creates and distributes money: when a home buyer gets a mortgage to buy a house, that mortgage increases the money supply. When the mortgage is paid off, the money supply contracts.
The mortgage is secured by two things: the income of the buyer and the house, which is the collateral for the loan.
Risk is integral to credit. Should the income of the buyer or the value of the house decline sharply, the loan is at risk of default / loss. In the national/global economy, the cost of credit reflects trends and policies that raise or lower the risks which then influence the cost of credit: as risk rises, the cost of credit goes up.
As macro-risks rise, the cost of credit pushes mortgage rates higher, increasing the percentage of income the buyer must devote to service the mortgage. This leaves less income for additional debt or consumption.
Once their income is maxed out, the buyer reaches debt saturation: there is no more spare income to service additional debt. The workaround to debt saturation is to engineer lower interest rates, so the buyer can refinance debt at lower interest rates and reduce the monthly cost, freeing up more income for additional debt/consumption.
But when systemic risks rise, lowering interest rates is no longer possible. Rates rise to reflect the risk premium generated by uncertainty and the higher potential of defaults and losses.
Expanding credit is the lifeblood not just of consumption but of asset valuations. Home prices rise when the pool of buyers with sufficient income and creditworthiness to buy a house is larger than the inventory of available homes. When interest rates plummeted in the pandemic stimulus phase, house prices soared as buyers panic-bid for properties.
(The same mechanism supports stocks, as corporations borrow money and use it to buy back their own shares, boosting per-share valuations.)
Declining interest rates and rising asset valuations create a virtuous cycle in which higher asset prices provide more collateral to support bigger loans, loans which are easier to service as interest rates drop.
This self-reinforcing feedback of higher asset prices / increased collateral enabling more debt is clearly visible in the charts below of the Case-Shiller national Home price Index, which soared 43% in the two years from 2020 to mid-2022, and the Households Net Worth which increased by a staggering $44 trillion in the two years following the pandemic stimulus.
The risk profile of credit has changed both nationally and globally, and cost of credit cannot fall back to near-zero. I addressed this in Why Interest Rates Are Not Going Back to Zero.
At the same time, productivity and wages have stagnated, leaving less income to service additional debt. As I explained in Here’s How We’ll Have Labor Shortages and High Unemployment at the Same Time, workers with skills that are scarce and in demand will command higher wages, while those with skills that are not in demand will not be able to find work or maintain high earned incomes.
As risk and the cost of credit rise, the valuations of assets dependent on expanding credit decline. Not only do owners of assets such as houses feel less wealthy–the reverse wealth effect–the collateral available to secure additional credit drops.
Together, these factors generate a self-reinforcing cycle of debt saturation, declining collateral and credit contraction: risk rises, credit costs rise, incomes and collateral decline and all the consumption and asset valuations that are dependent on credit expansion go over the falls.
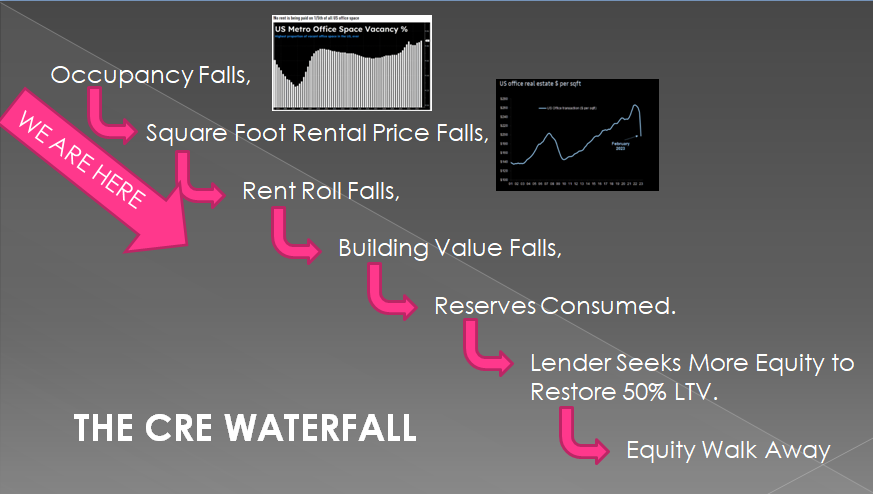
ABOVE: Pricing of Risk, Collateral and Credit are only in the early stages within the Commercial Office Real Estate (CRE) sector.
SMALL BUSINESS CONFIDENCE: Small Business Confidence Leads the Way!
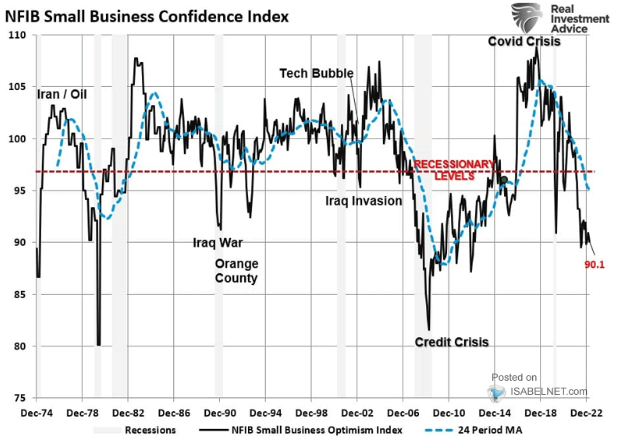 The NFIB Small Business Optimism Index has been steadily falling since Covid-19 struck and has not relented in its weakening since. We have written about concerns with Small Business landing in prior newsletters.
CHART RIGHT: NFIB Small Business Confidence Index below the ~97 Recessionary Trigger Level!
RECESSIONARY SIGNAL
Historically, when the NFIB Small Business Confidence Index falls below the mid 90’s we soon enter a US Recession!
At 90.1 and rapidly falling, it will take some major developments to reverse what lies ahead. In fact we may be facing something even worse than an approximately every decade “run-of-the-mill” recession!
The reason for this is that falling confidence is much broader than for just small buinsess owners!
CONSUMER SENTIMENT & CONFIDENCE: The Driver of a 70%
US Consumption Economy!
In addition to the NFIB Small Business Optimism Index exhibiting a Head & Shoulders Pattern, we additionally have major Head & Shoulders patterns appearing across both Consumer Confidence Board’s Index and U. of Michigan’s Consumer Sentiment Index. This is particularly alarming in a 70% Consumption Economy like the US, driven historically by Small Business!
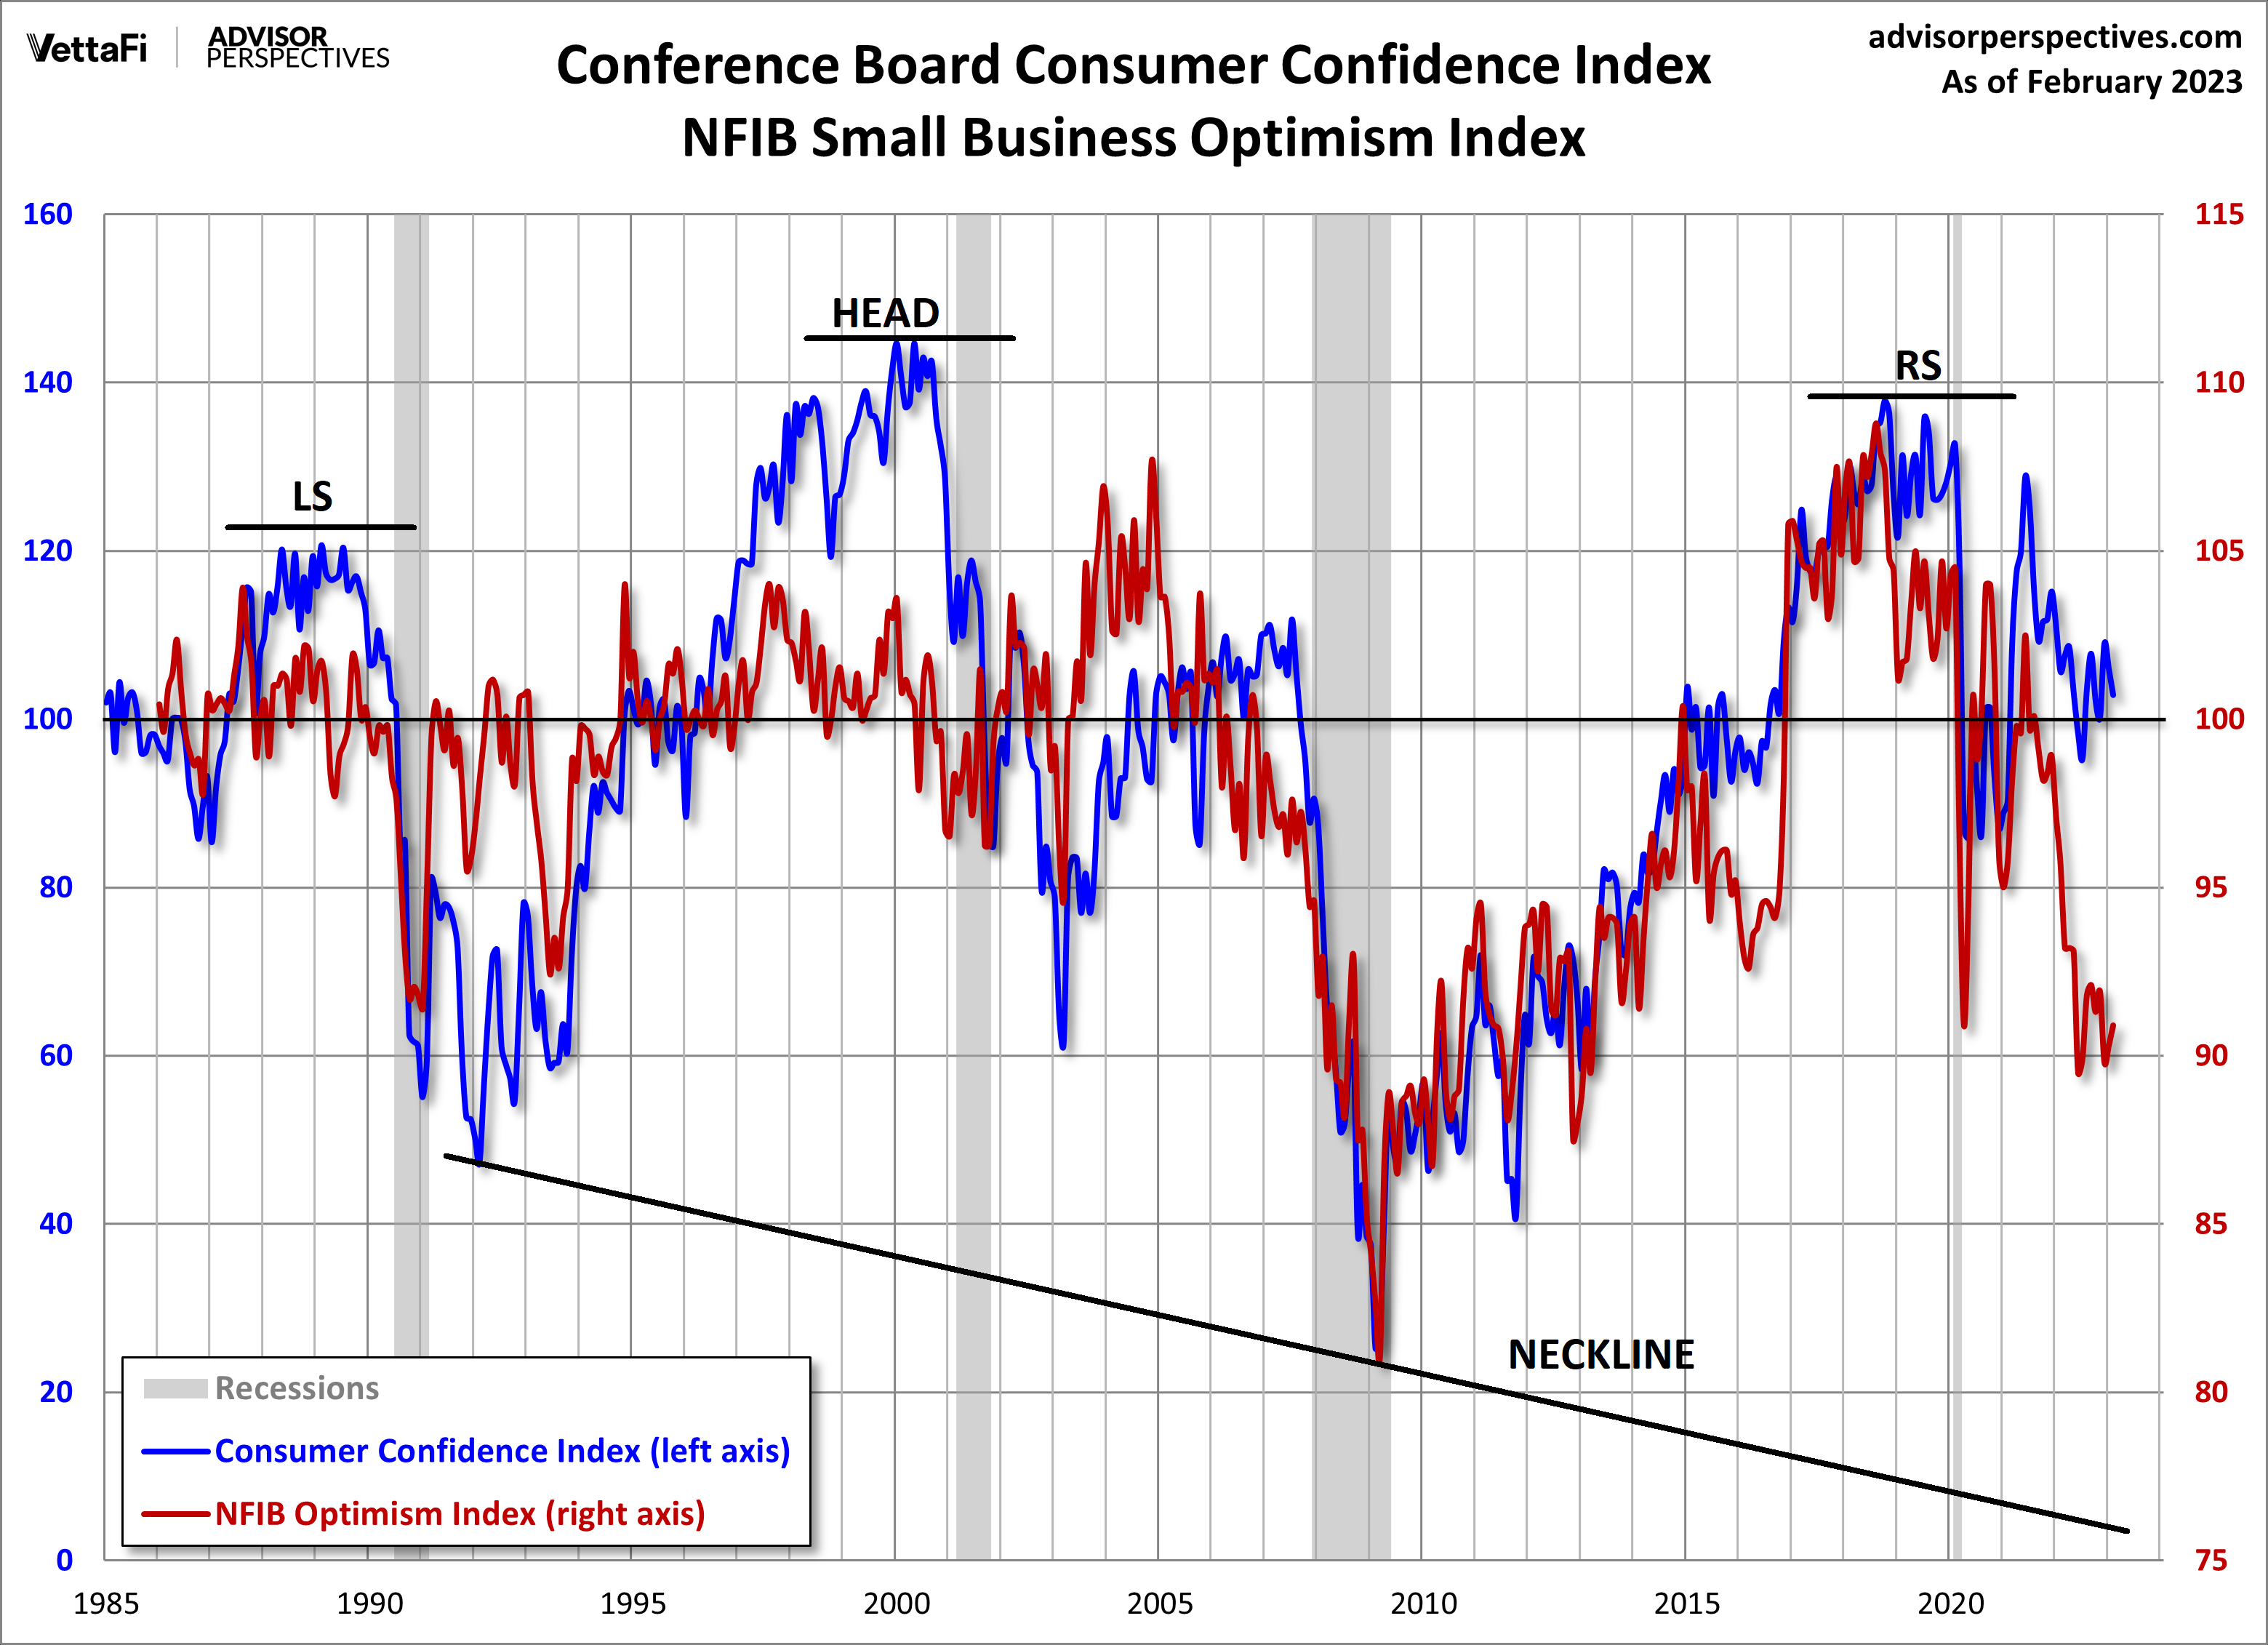
The University of Michigan’s Consumer Sentiment Index is now testing its long term “Neckline” which, if broken, would indicate a major further drop is to follow!
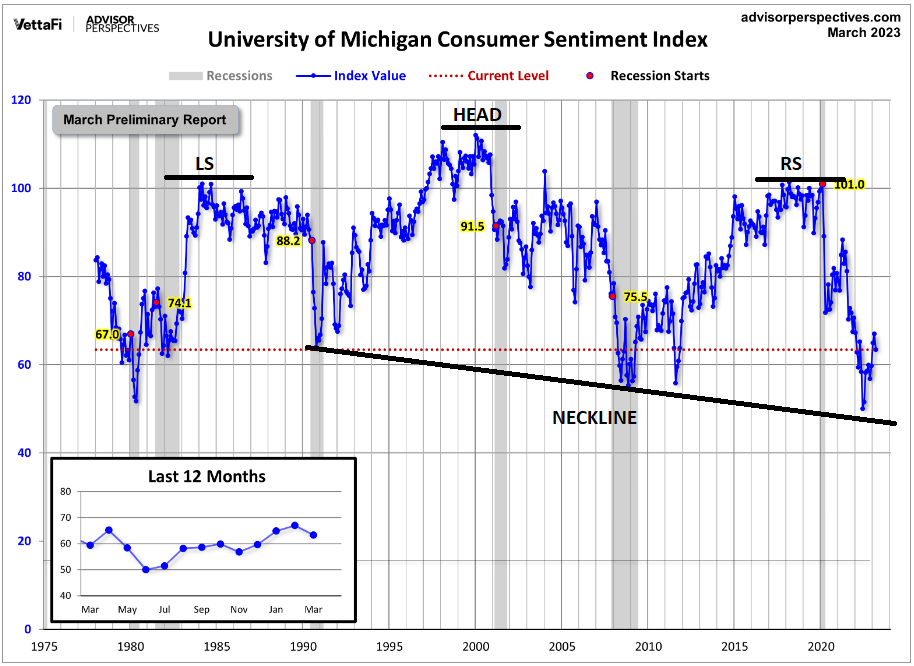
The politically influenced Conference Board’s data is not yet as negative as the non-political UofM’s data driven reporting.
S&P 500 – SUPPORTING HEAD & SHOULDERS PATTERN
We also have a long term H&S pattern in the S&P 500, which supports the above collapsing Consumer Confidence & Sentment as well as NFIB Small Business Confidence.
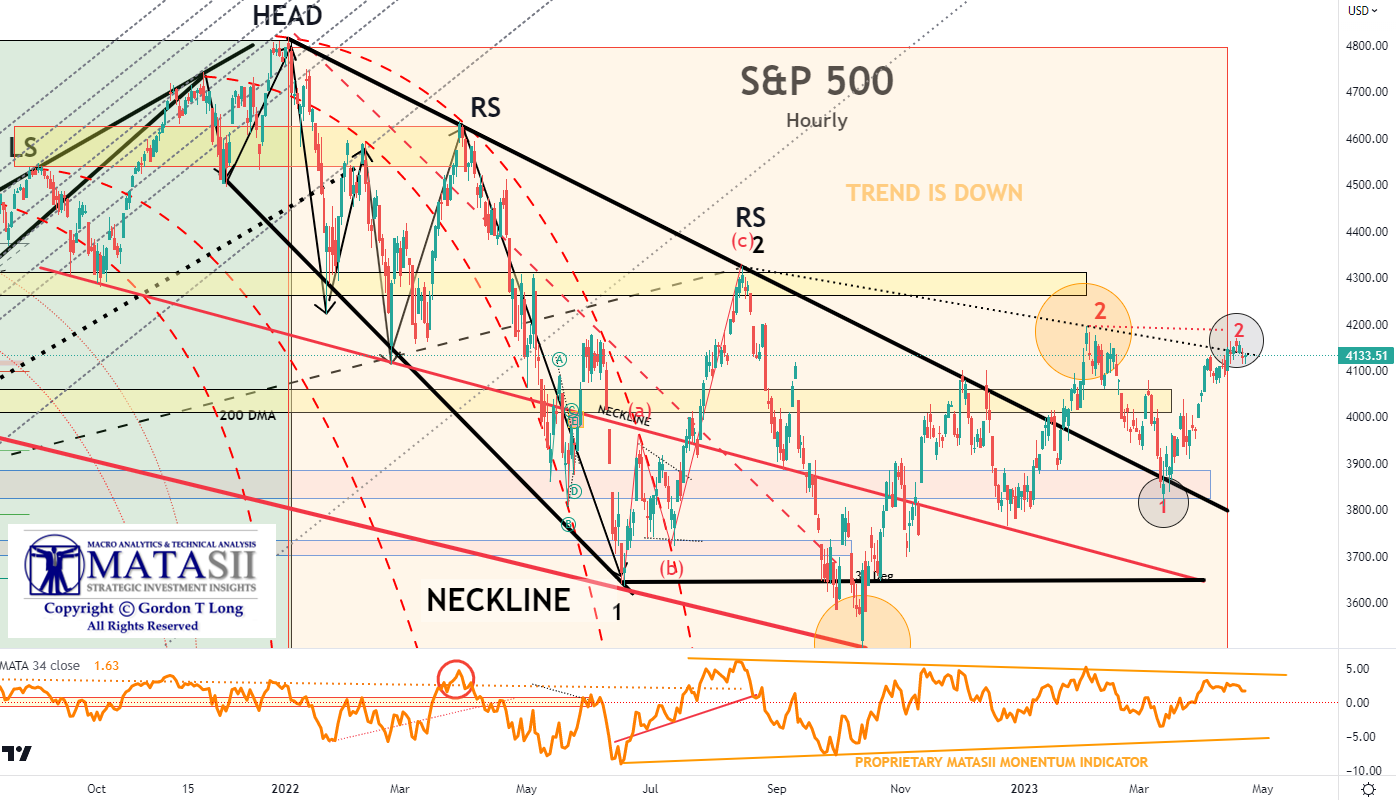
YOUR DESK TOP / TABLET / PHONE ANNOTATED CHART
Macro Analytics Chart Above: SUBSCRIBER LINK
SMART MONEY: Watch the Professional OEM Traders For Timing On the Right Shoulder
 Are we at the point of decisively breaking key Head & Shoulders Necklines?
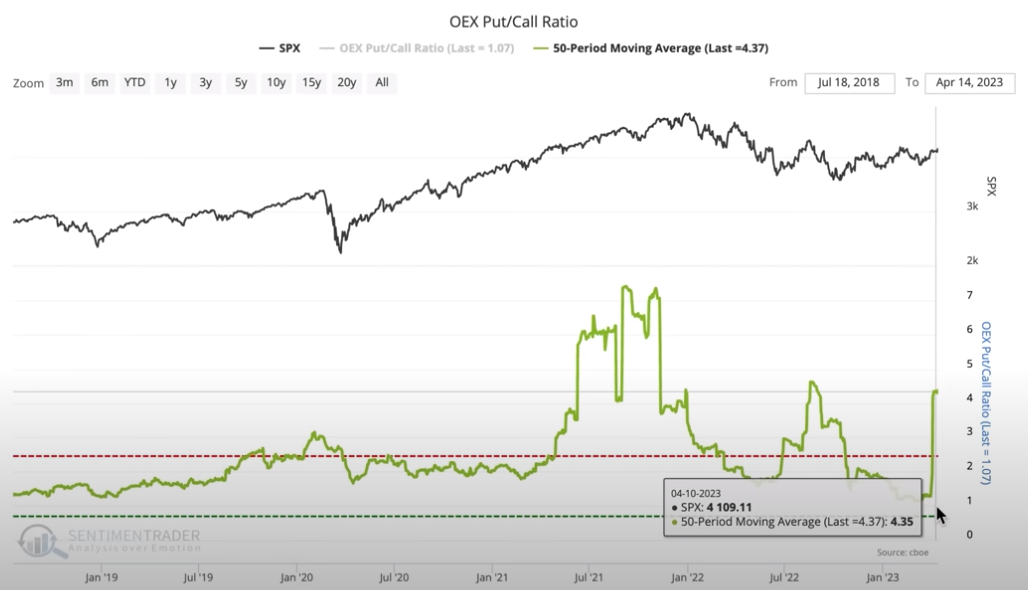
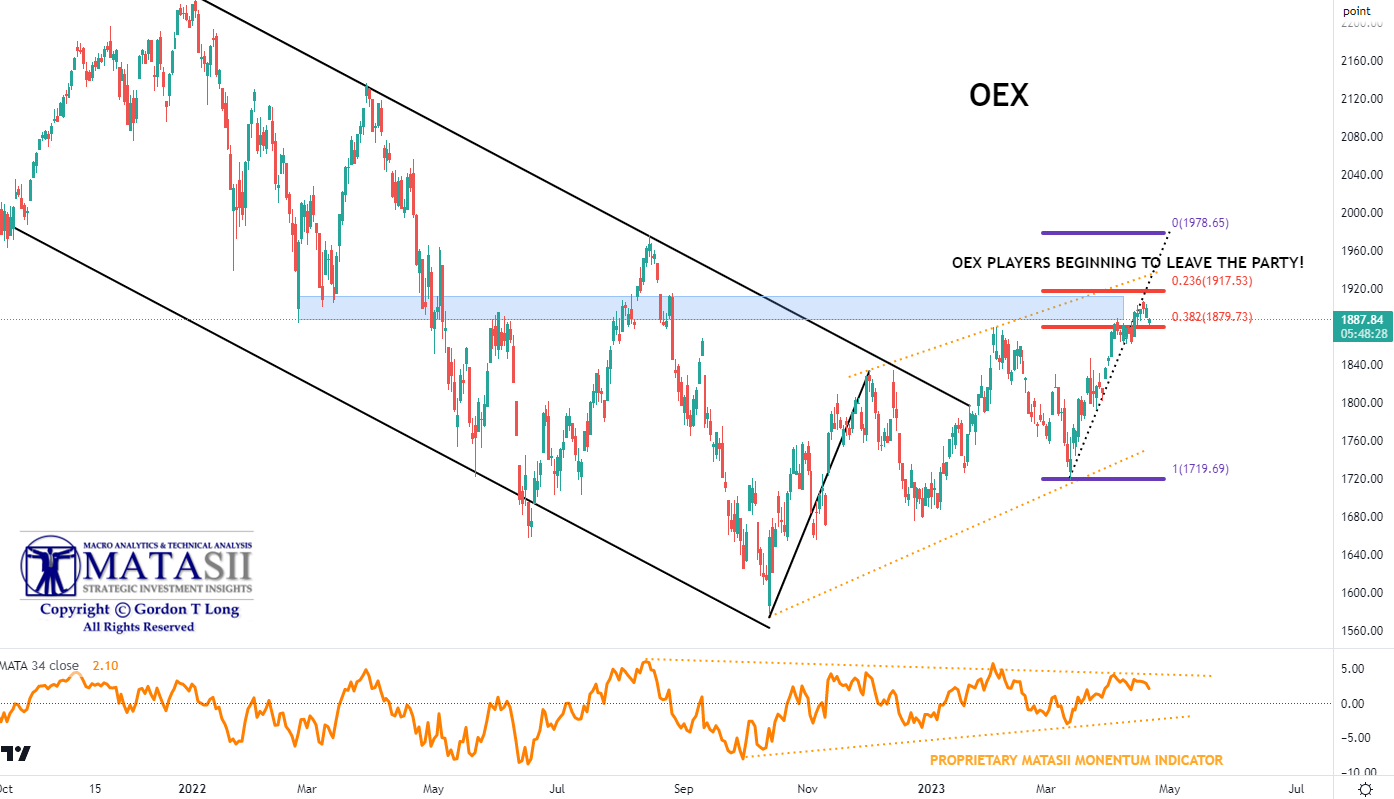
We have had a lot of success over the years watching how smart money trades the OEX. This is the Chicago Board Options Exchange ticker symbol used to identify Standard & Poor’s 100 index options.
When the buying reaches a high the smart money usually strongly shorts the market by intially shorting the OEX. This approach has had a strong record of preceeeding major market corrections.
The OEX Put/Call Ratio, shown to the right by Sentiment Trader, indicates an unusal high – normally a trigger point for Smart Money.
CHART BELOW: The OEX appears to be near overhead resistance with the proprietary MATSII Momentum Indicator also signalling overhead resistance.
YOUR DESK TOP / TABLET / PHONE ANNOTATED CHART
Macro Analytics Chart Above: SUBSCRIBER LINK
CONCLUSION
Few seem to remember that:
-
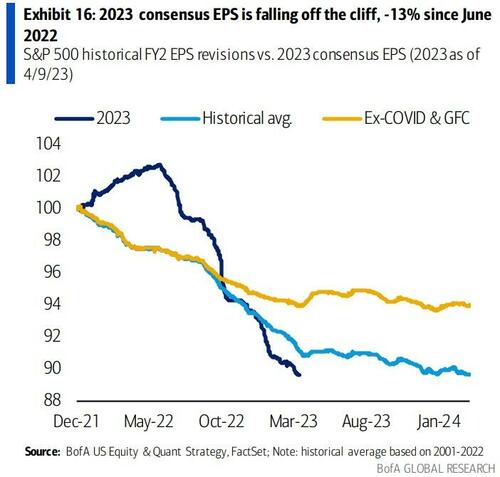
- Consensus earnings estimates for FY 2023 have already been cut more than usual over the past six months.
- Analysts have reduced estimates going forward by 4.5%.
- S&P 500 Q1 consensus EPS has been cut 6% YTD, more than the average 4% pre-season-cut.
- Since 1990, forward EPS estimates were revised down 19% on average during recession vs. just -2% into recession. The recession is still to be priced in.
GLOBAL PERSPECTIVE
It appears that negative earnings revisions are accelerating. Global earnings expectations are now trending lower again. The 1-month net global EPS revisions have fallen to -15.% from -7.2% last month, and the more significant 3-month net global revisions are now at -13.7%, down from -13.2% over recent weeks.
US EARNINGS CONFERENCE CALLS
-
- Tesla (TSLA) profit and revenue were broadly in-line with expectations but missed on gross margin and posted a 2yr low on the way with price cut weighing on the automaker. Net profit fell by nearly a quarter Y/Y, hurt by higher raw-materials, logistics and warranty costs.
- AT&T (T) fell short on revenue and wireless postpaid net additions, cashflow also missed expectations.
- IBM (IBM), beat on profit and signalled demand for IT services, was better than feared; but missed on revenue.
- American Express (AXP) missed on EPS, while revenue topped expectations, although it posted larger provisions than expected. Reaffirmed FY guidance.
- Zions Bancorporation (ZION) fell short on EPS, deposits, and NII with management noting EPS was impacted by 0.06 worth of headwinds.
- Lam Research (LRCX) surpassed Wall. St expectations on top and bottom line, but guidance for the next quarter was light.
- F5 (FFIV) topped expected on profit and revenue, but next quarter and FY guidance was very disappointing with downbeat commentary. Lowering its workforce by around 9% (620 employees).
- DR Horton (DHI) posted strong earnings, highlighted by a beat on EPS and revenue while next quarter revenue guide was strong.
- TSMC (TSM) profit rose in Q1 by 2%, but was the smallest quarterly profit growth in around four years as global economic conditions weighed on demand for chips. The next quarter revenue guide was light.
- Phillip Morris (PM) revenue disappointed, while FY and next quarter profit guide was also light.
- KeyCorp (KEY) missed on all major metrics with guidance for 2023 underwhelming.
- MercadoLibre (MELI) plan to add 13k jobs, bucking the trend of big tech layoffs, according to Bloomberg.
- Meta (META) plans to cut 10% of UK workforce in retreat from London, according to FT.
- Alphabet’s (GOOGL) Google merges AI research units Brain and DeepMind to accelerate AI progress, according to WSJ. US bankruptcy.
- Morgan Stanley (MS) beat on EPS and revenue, but provision for credit losses were greater-than-expected primarily due to CRE exposure and deterioration in the macroeconomic outlook from a year ago.
- Ally Financial (ALLY) missed on profit and revenue, while consumer deposits and strong liquidity profile served as a source of strength during a period of market volatility.
- Citizens Financial (CFG) missed on EPS, revenue, and deposits. Said Q1 brought unexpected challenges in environment and is hopeful that market turmoil continues to subside.
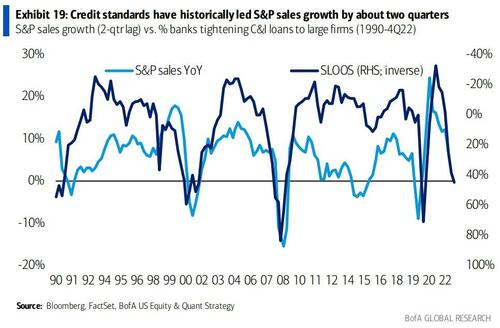
Historically credit standards have led S&P sales growth by about two quarters, suggesting further deceleration in sales growth ahead.
Earnings downturns usually begins with sales slowing (not declining) and margins getting squeezed as companies can’t cut costs fast enough, followed by a bigger earnings decline as sales fall.
LABOR COMMENTS FROM THE LATEST FED BEIGE BOOK:
“A small number of firms reported mass layoffs, and those were centered at a subset of the largest companies. Some other firms reportedly “opted to allow for natural attrition to occur, and to hire only for critically important roles.” As a result, Fed contacts reported the labor market becoming less tight as several Districts noted increases to the labor supply. Additionally, firms benefited from better employee retention, which allowed them to hire for open roles while not constantly trying to back-fill positions. And while wages have shown some moderation, they still remain elevated as several Districts reported declining needs for off-cycle wage increases compared to last year.”
It is quite alarming when the US$ follows the movements in the US Credit Default Swap Rate!
LAYOFF HEADLINES: The Likely Triggering Events Are Now Beginning.
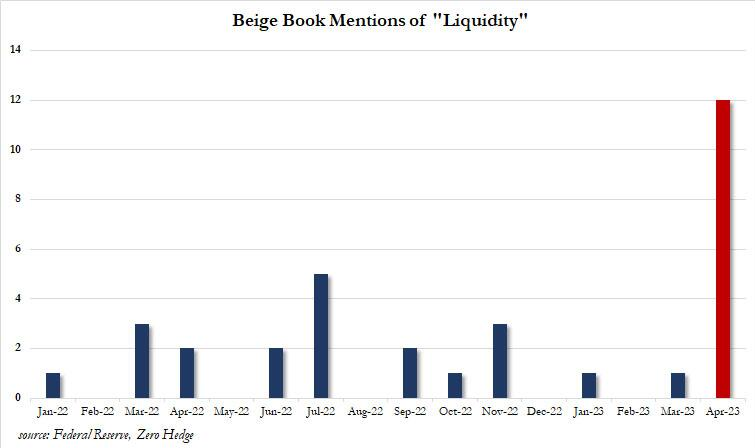
Liquidity Concerns Showing In the Latest Fed Beige book: The quite apparent cause of all the apprehension about loans, lending standards and tightening conditions in the latest Fed Beige Book can best be seen by one look at the chart to the right (developed by ZeroHedge). It points out the frequency of “mentions” of the key word “LIQUIDTY” in the recent Beige Books.
TIGHTEN YOUR SEAT BELT!
… it is soon going to get bumpy!
BE PREPARED FOR A HIGH PROBABILITY CORPORATE BOND DEBACLE
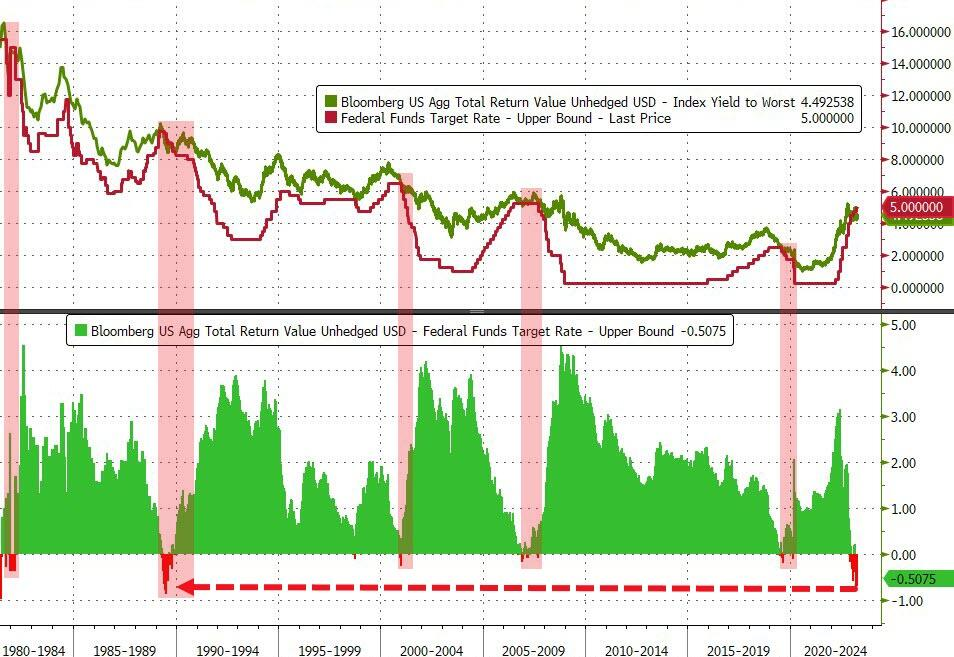 We are beginning to see the expected problems of tightening liquidity reach the corporate bond market, as the yield spread between Investment Grade (IG) bonds and Fed Funds has collapsed to near record lows.
The coming IG pain will likely be enough to force The Fed’s hand to pause or pivot sooner, (but the Fed won’t get there without the pain). We can expect that as IG bonds go, so will stocks!
CHART RIGHT: A reliable multi-decade Bond v Fed Funds Rate reversal signal is now at its proven point of reversal. Will its historic pattern prevail?
HIGH YIELD CORPORATE BONDS (HY) & ZOMBIE CORPORATIONS
The Bank of International Settlements (BIS) estimates Zombie corporations to be 20% of larger publicaly listed corporations and almost all of corporate bond issuers with CCC or lower ratings. Zombie corporations that overborrowed when interest rates were ultra-low but don’t earn enough to cover their debt-service costs or operating expenses – this is why they are called zombies -they’re living on borrowed time!
Zombie lending and “rollover” refinancing is about to be amplified with the ongoing credit crunch, as banks weathering huge holes in their balance sheets, are now less willing to lend or will only do so at higher rates. Banks have tightened lending by the most they ever have and credit availability just saw its largest drop in 20 years, according to the most recent small business lending survey. The next six months to a year are going to be extremely challenging in terms of making sure that companies can service their debt. Expect many to face bankruptcy or takeovers!
- $11.4B of Coporate Bonds downgrade to High Yield (Junk) in Q1
- Fallen Angels may hit $80B by the end of 2023
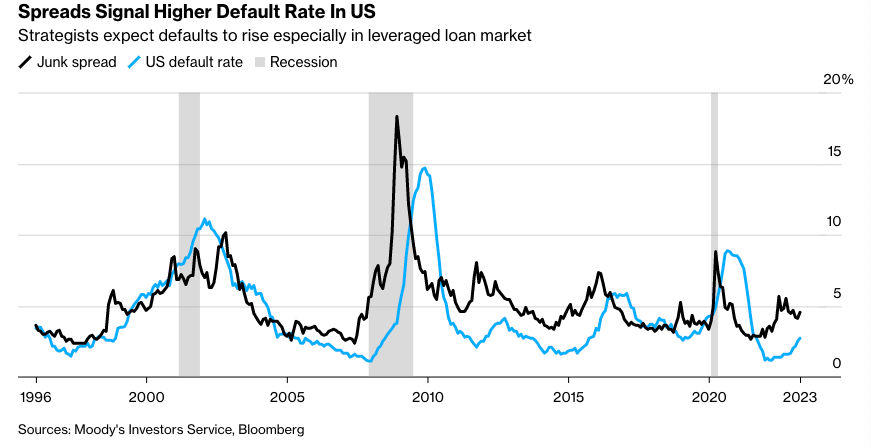 Junk bond spreads are set to widen. Bloomberg is reporting that the volume of US corporate debt trading at distressed levels — a risk premium of at least 10 percentage points over the benchmark for bonds, or a price of less than 80 cents on the dollar for loans — has surged some 28% since last month’s banking crisis to around $300 billion.
PitchBook data shows about a quarter of the $1.4 trillion leveraged loan market carries a B- credit rating, just one notch below CCC grade. Paul Marshall, of Marshall Wace, one of the world’s major hedge-fund firms, warned investors earlier this month that the credit crunch will be “fairly severe” and might spark a recession.
BARCLAYS HIGH YIELD BOND ETF: “JNK”
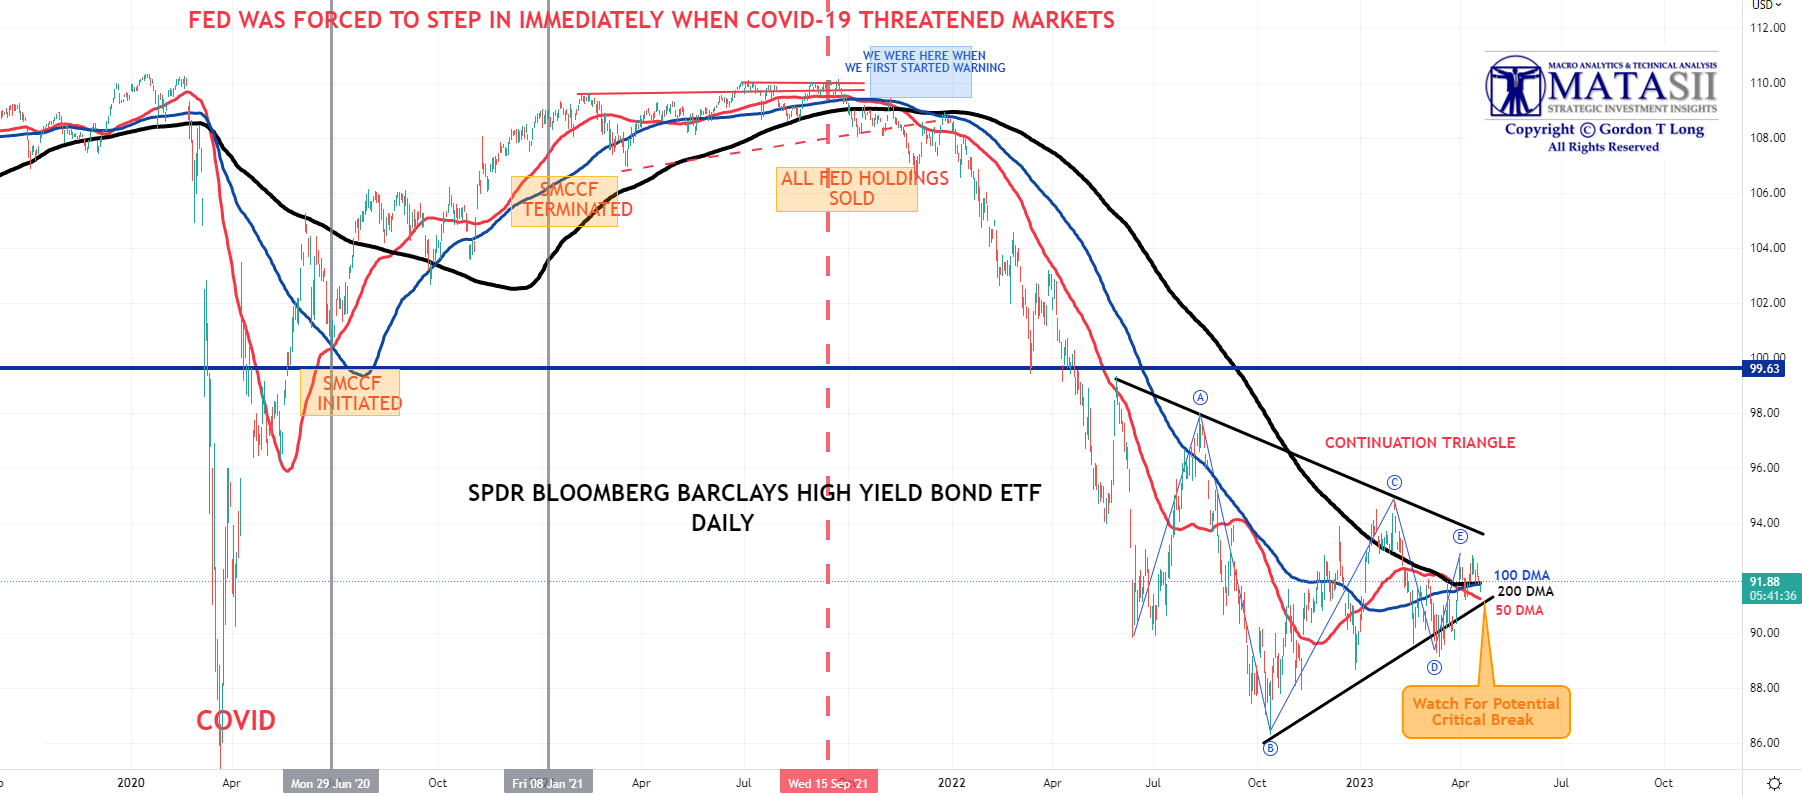
YOUR DESK TOP / TABLET / PHONE ANNOTATED CHART
Macro Analytics Chart Above: SUBSCRIBER LINK
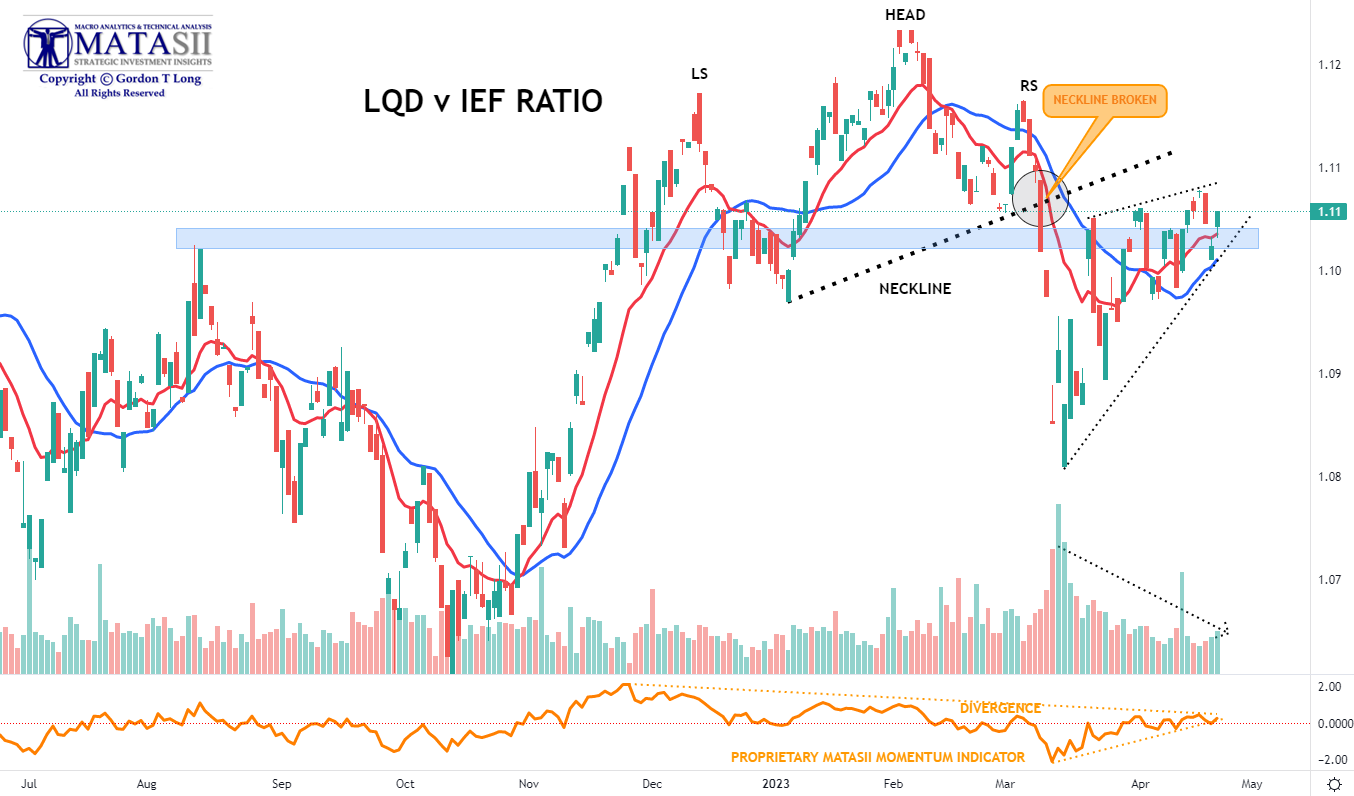
FURTHER SUPPORTING ANALYTICS: THE INSTITUTIONAL LQD v IEF RATIO
An insightful way to get a view into what may be about to happen is to compare the iShares iBoxx $ Inv Grade Corporate Bond ETF (LQD) versus the IEF: iShares 7-10 Year Treasury Bond ETF (IEF) and then overlay MATASII’s proprietary MATASII Cross.
-
- LQD: iShares iBoxx $ Inv Grade Corporate Bond ETF — The iShares iBoxx $ Investment Grade Corporate Bond ETF seeks to track the investment results of an index composed of U.S. dollar-denominated, investment grade corporate bonds — allowing exposure to a broad range of U.S. investment grade corporate bonds.
- IEF: iShares 7-10 Year Treasury Bond ETF — The iShares 7-10 Year Treasury Bond ETF (IEF) seeks to track the investment results of an index composed of U.S. Treasury bonds with remaining maturities between seven and ten years – allowing exposure to intermediate-term U.S. Treasury bonds.
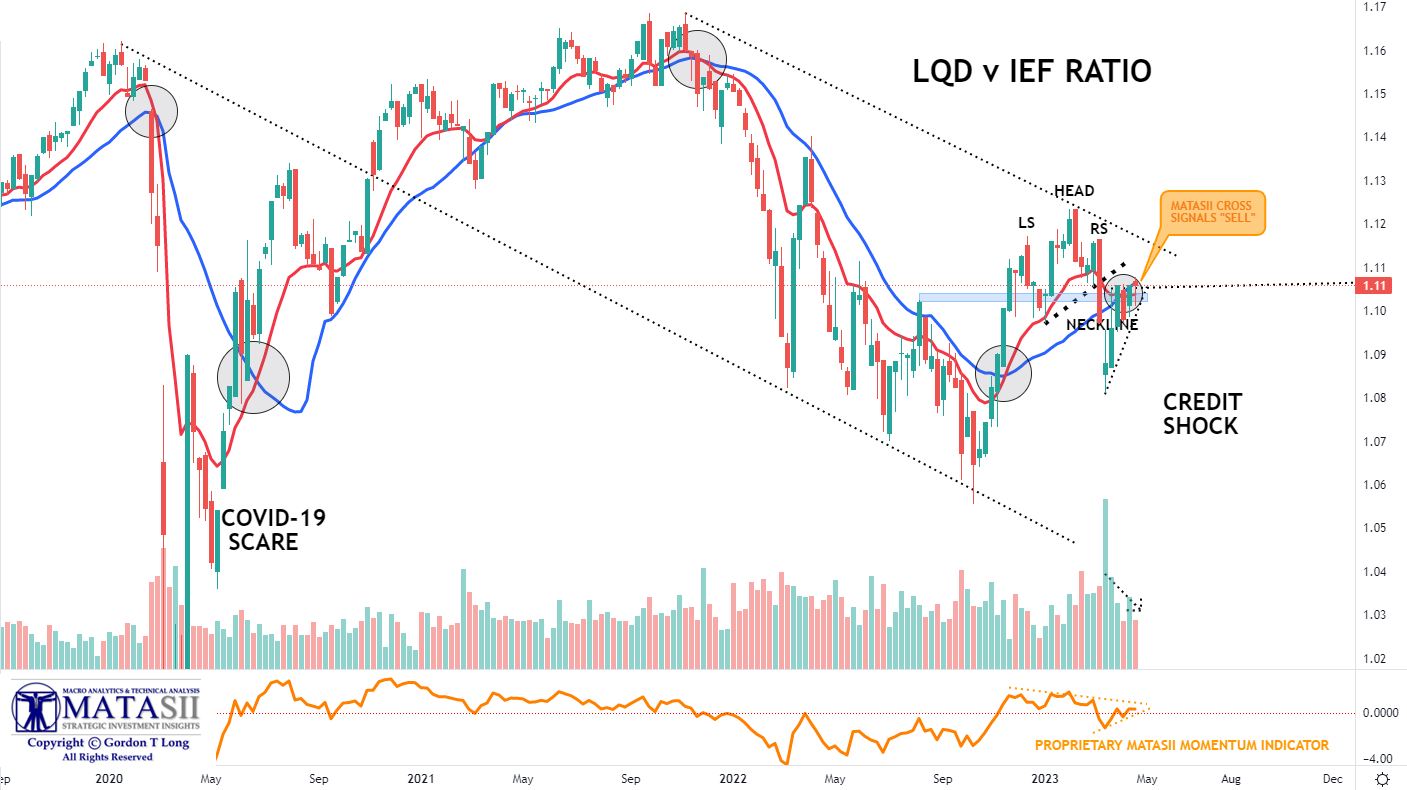
The LQD v IEF Ratio is widely used to measure downside risk exposure betwenn IG and UST’s. The ratio currently at ~1.11 is considered to be quite high. This indicates a strong positive relationship between their price movements. Having highly-correlated positions in a portfolio may signal a lack of diversification, potentially leading to increased risk during market downturns. This suggests bond traders are chasing higher levels of risk against suddent downside.
When we have a clear “Head & Shoulders” pattern coupled with a SELL signal on the proprietary MATASII Cross,
it is a strong indicator of troubles NEAR AT HAND!
Below we show first the Weekly, then the Daily Chart:
WEEKLY CHART
-
- Clear Head and Shoulders Pattern
- A Broken Neckline with underside retest
- MATASII Cross SELL signal
DAILY CHART
- MATASII Cross currrently on a near term BUY, but at overhead resistance which often results in a reversal
- MATASII proprietary Momentem Indicator (bottom indicator) nearing the completion of a consolidation breakout triangle
FAIR USE NOTICE This site contains copyrighted material the use of which has not always been specifically authorized by the copyright owner. We are making such material available in our efforts to advance understanding of environmental, political, human rights, economic, democracy, scientific, and social justice issues, etc. We believe this constitutes a ‘fair use’ of any such copyrighted material as provided for in section 107 of the US Copyright Law. In accordance with Title 17 U.S.C. Section 107, the material on this site is distributed without profit to those who have expressed a prior interest in receiving the included information for research and educational purposes. If you wish to use copyrighted material from this site for purposes of your own that go beyond ‘fair use’, you must obtain permission from the copyright owner.
NOTICE Information on these pages contains forward-looking statements that involve risks and uncertainties. Markets and instruments profiled on this page are for informational purposes only and should not in any way come across as a recommendation to buy or sell in these assets. You should do your own thorough research before making any investment decisions. MATASII.com does not in any way guarantee that this information is free from mistakes, errors, or material misstatements. It also does not guarantee that this information is of a timely nature. Investing in Open Markets involves a great deal of risk, including the loss of all or a portion of your investment, as well as emotional distress. All risks, losses and costs associated with investing, including total loss of principal, are your responsibility.