![]()
SII: Strategic Investment Insights

Strategic Investment Insights
Global Macro Research | Market Road Maps
Strategic Investment Insights are a product of Gordon’s MACRO Research and the HPTZ Methodology. MACRO identifies market sectors that are “in play” and likely to offer investment and trade opportunities. Specific securities are then marked up with Market Road Maps for technical timing considerations. Road Maps identify significant technical levels and structures, as well as offer potential target considerations (HPTZ’s).
PROCESS & PRODUCT


Extensive research from mainstream and alternative sources.
Organization & association of research.
Abstraction & Synthesis reveals new market themes and insights.
Numerous instruments associated with Insights given.
Master Lists scanned for best Technical set-ups.
WATCH LISTS
The most favorable prospects from Master Lists are used to create a Watch List.
Watch lists:
(1) link to each individual securities SII page with more information, research, charts, and trade / investment IDEAS;
(2) show current market price (as per Google finance, delayed);
(3) show potential technical entry levels, long & short
(4) dynamic: current price lights up when near technical entry level warning of possible action to be taken
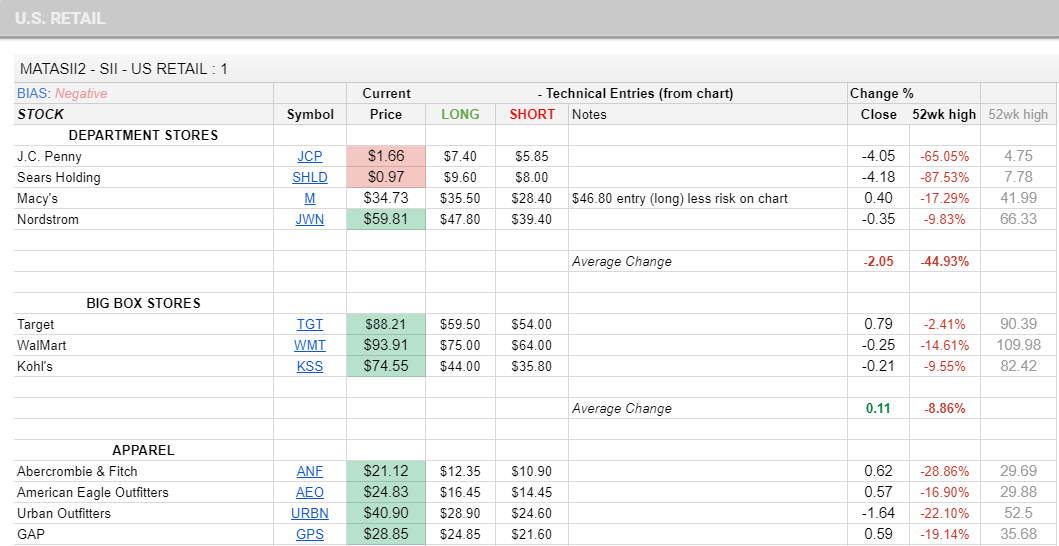
The SAMPLE (right) shows our previous US Retail Watch List. Note the red and green highlights of Current Price. These “illuminated” because the current price had neared or crossed a Long or Short potential Technical Consideration. These are not “Buy Now!” or “Sell Now!” indications, rather they warn of the market reaching significant technicals, and potential opportunities may exist. The symbols link to individual pages where the charts can be accessed.
SAMPLE
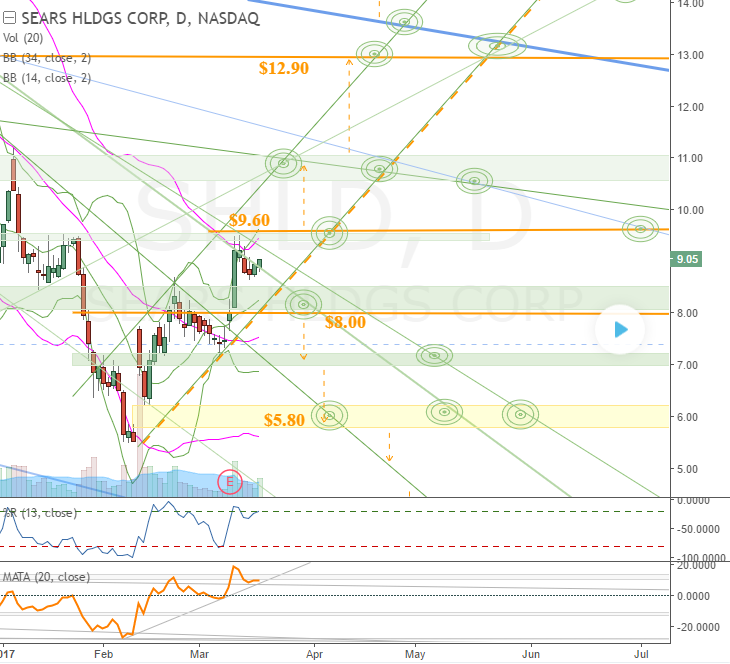
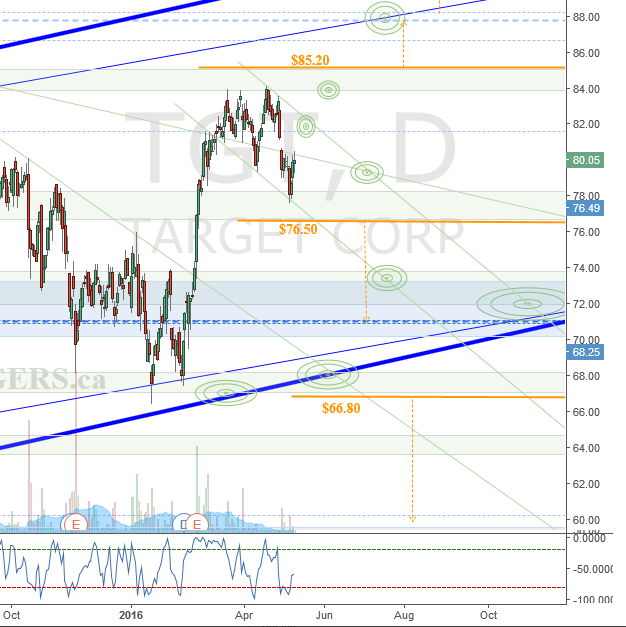
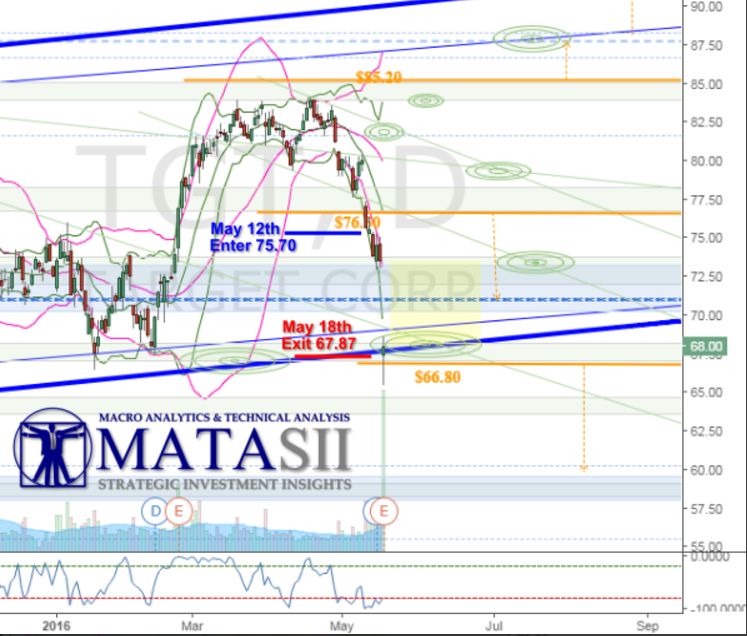
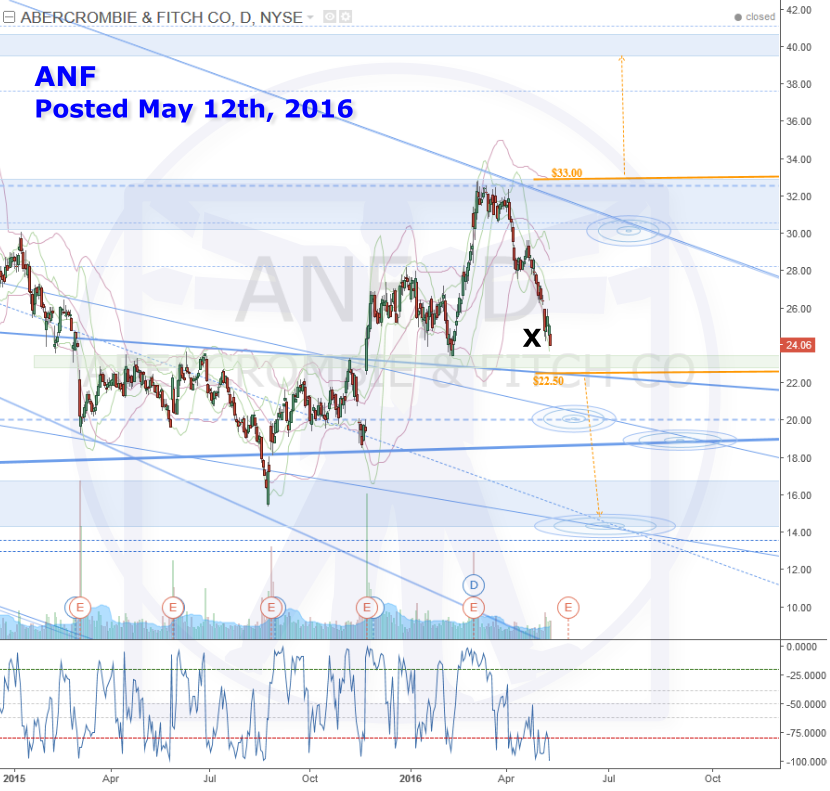
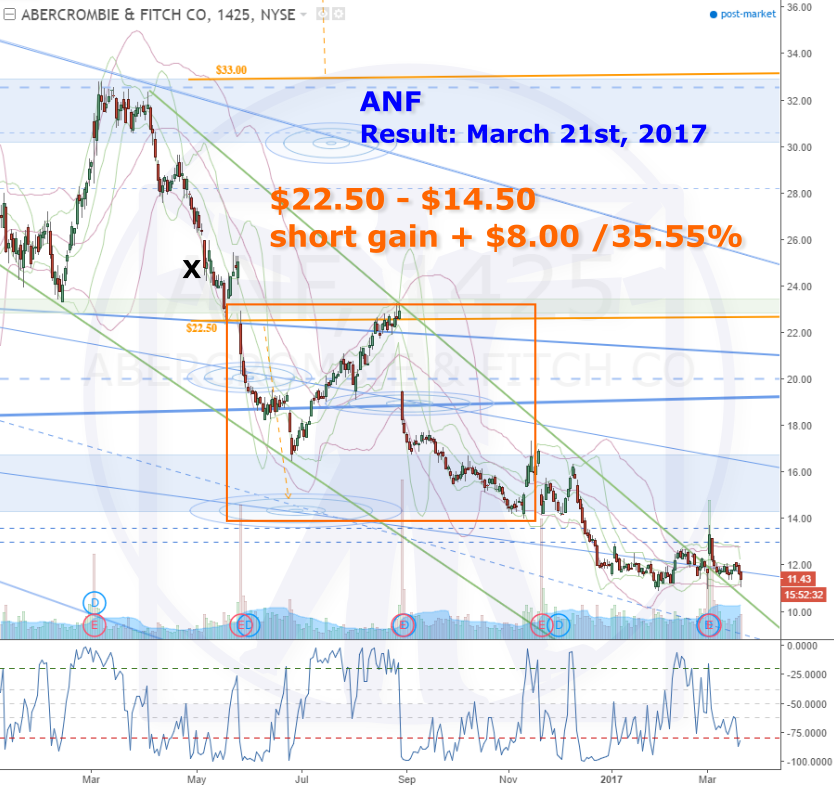
ACTIONABLE CHARTS Market Road Maps, Technical Set-Ups & IDEAS
Note the movement of the market from technical to technical. Consolidations and Reversals usually occur at a technical, when these complete, the market then moves to the next. These provide opportunities for short term trading or longer term investment strategies. The market road map created by the technicals makes opportunities obvious and clearly identifies areas of risk.

SII IDEAS – Investment & Trading Ideas (public)
- SPG Simon Property Group IDEA
May 15, 2020
Strategic Investment Insights Global Macro Research | Market Road Maps SII: US RETAIL SPG Simon Property Group Previous IDEA The top panel shows SPG weekly and daily charts as published on March 6th, 2017. While all technicals can be used, orange highlights the more immediate potential technical
MATASII Subscription Options
Full Site Access (all sections)
SUBSCRIBE
FULL SITE ACCESS
$55/monthly
SUBSCRIBE
FULL SITE ACCESS
$550/yearly
Gordon T Long Macro Research (only)
SUBSCRIBE
GTL MATA
$35/monthly
SUBSCRIBE
GTL MATA
$350/yearly
SII – Strategic Investment Insights (only)
SUBSCRIBE
SII
$35/monthly
SUBSCRIBE
SII
$350/yearly
TRIGGER$ HPTZ Technical Analysis (only)
SUBSCRIBE
TRIGGER$
$35/monthly
SUBSCRIBE
TRIGGER$
$350/year
Pay-Per-View
– single serving analysis starting at $0.99!