Gordon T Long
Global Macro Research | Macro-Technical Analysis
MATA
PATTERNS
THE ART OF TIMING MARKETS
What I have come to understand over the decades that I have been following the Financial Markets is that market timing is more an art form than hard analysis. Though we do extensive market analytics at MATASII.com, the markets are a lot like playing a musical instrument. It has rhythm, rhyme, repetition and resonance. Like sheet music, there are rules and guidelines in transcribing it.
However to play an instrument well it takes an “ear”, practice and a feel. There are some basic rules, but mostly guidelines. Playing with those guidelines separates real artists from the novices.
In this newsletter we will share with you a few general guidelines we use as part of the MATASII Economic Monitor. We touched on these in a somewhat simplified format in our most recent LONGWave video. This newsletter are meant to further expand on this sort of analysis and to give you a sense of how “timing” becomes aligned (resistance, barriers, sentiment etc.) between types of financial markets & regions.
=========
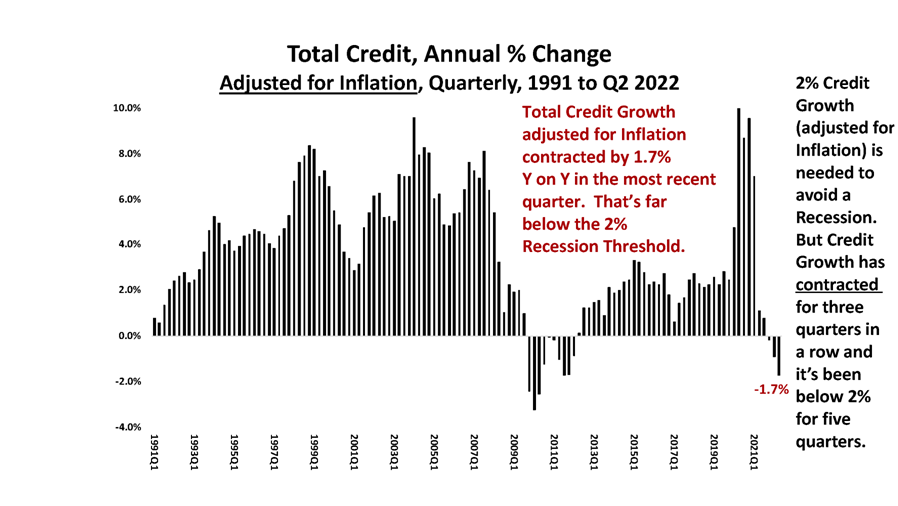
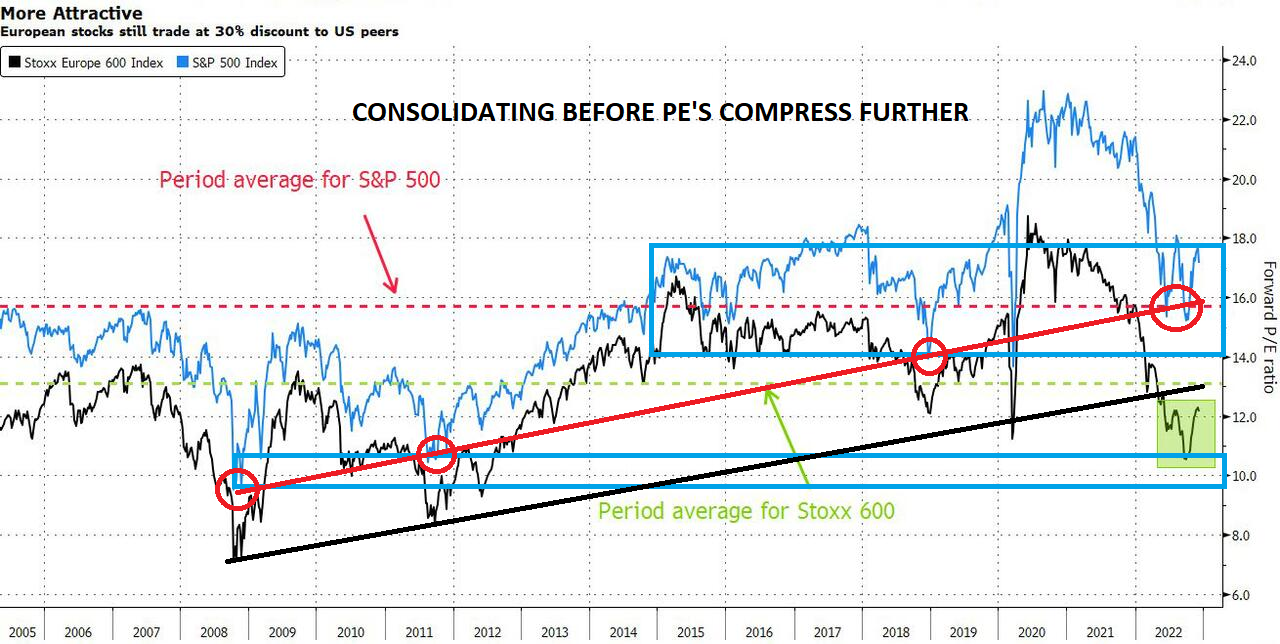 When the markets begin to price in the looming US and potential global recession, we can expect PE multiples to compress further (shown to the right), before equity earnings actually fall.
WHAT YOU NEED TO KNOW
- GUIDELINES TO UNDERSTAND ABOUT TIMING MARKETS
-
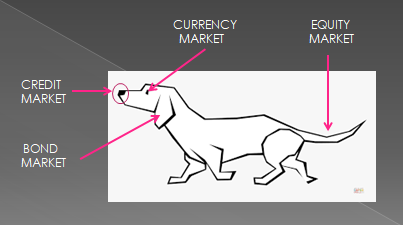
- The “DOG” ANALOGY: For an animal, like financial markets, smelling and sensing comes before seeing and feeling danger or opportunity! To animals, it is a matter of survival. Likewise similar “Timing” sensors are a matter of survival within markets.
- There are many Guidelines. We highlight four in this newsletter which are currently important to watch:
-
-
- GUIDELINE: 12-18 Month General Monetary Impact Guideline
- GUIDELINE: 12 Month Credit Impulse Guideline,
- GUIDELINE: 6-8 Month Market Lead Time Guideline,
- GUIDELINE: Sequence Guidelines — Spirals & Cycles
-
- FIRST REVERSAL SIGNAL — REAL RATES, BREAKEVENS, BONDS & THE DOLLAR
-
- There is a very close overlay of developments within:
- i) 10Y INFLATION BREAKEVENS,
- ii)10Y REAL RATES,
- iii) 10Y UST BONDS, and i
- v) US DOLLAR
- They signal that markets have begun to price in a Q2 2023 US Recession.
- Expect market pricing to come in stages as the degree of Recession is better understood, as well as whether a Global Recession is a real possibility.
- The expected S&P 500 deterioration will follow earnings warnings and lower estimates.
- There is a very close overlay of developments within:
- INVERTED YIELD CURVE versus VIX
- The message from developments in the Unemployment Rate and PMI is clear. Markets are ready to begin pricing in the coming “official” recession, which it now forecasts out approximately 6 months,
- Bond Yields, Real Rates and the US Dollar have already begun to follow WTIC in leading the way with this re-pricing!
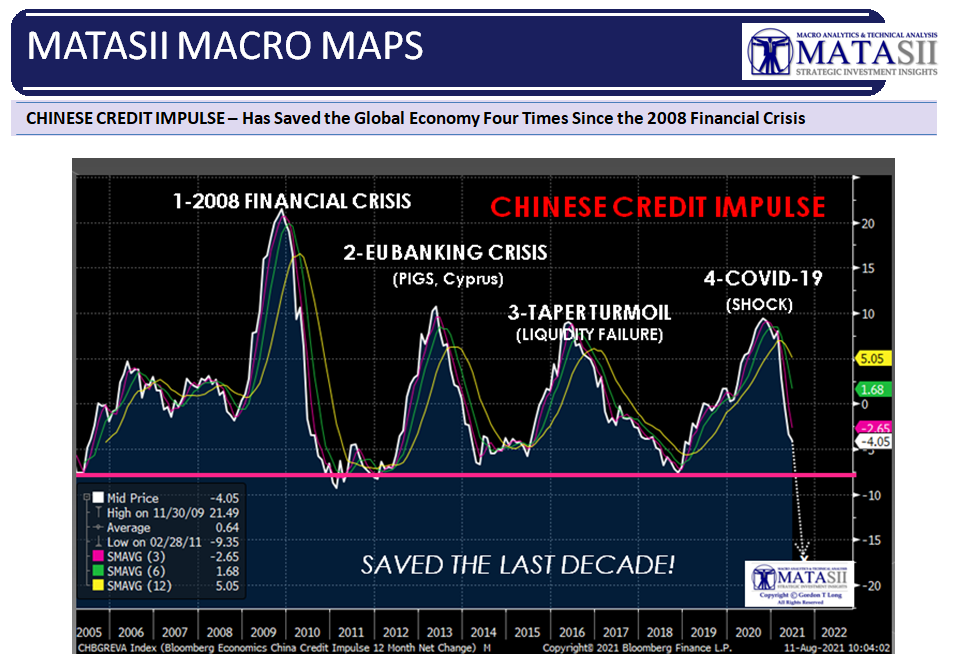
- CHINESE CREDIT IMPULSE
- The Chinese Credit Impulse is likely to ignite a major counter rally in the US Bear Market in approximately 12 months.
- There is a strong possibility that a Chinese Credit impulse driven counter rally will then end the existing Bear Market. HOWEVER, this will only subsequently be followed by a continuation of yet another Bear Market. — all part of a larger Secular Bear Market.
 CONCLUSION
- CAPITUALTION: It normally takes an event.
- AN EVENT: The sudden and stark realization that an illusion (a false belief) is not reality!
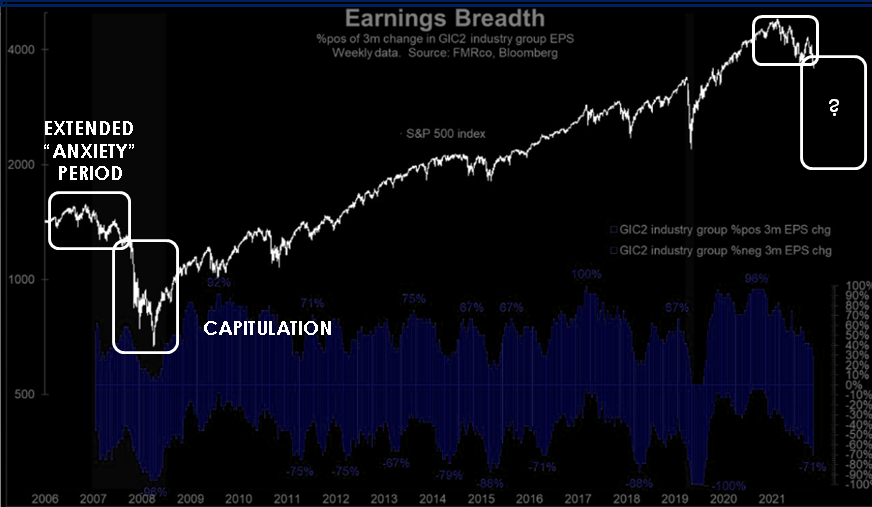
- The Long Term market Breadth Chart gives us a strong clue of where the market believes we are.
- The fact that the bulls have recently failed to keep the S&P 500 above its 200-DMA, despite seasonality factors, should be seen short term as very bearish.
The Long Expected and Overdue Recessionary Deflationary Scare is Soon to Arrive.
However, first a Seasonal Santa Claus Rally? … then the Pain!
=========
 MATASII ECONOMIC INDICATOR
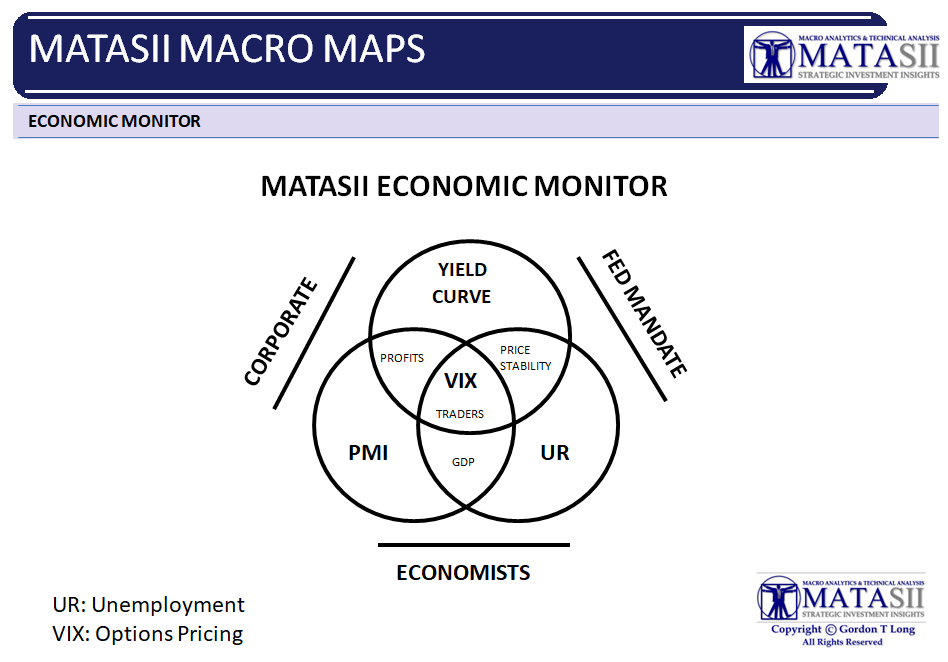
In our latest LONGWave video we highlighted the MATASII Economic Monitor (schematic below) with the relationship between the Yield Curve, Unemployment, the Purchasing Managers Index (PMI) and the Volatility Index (VIX). In the June UnderTheLens video and newsletter: The THE DOG’S NOSE: CREDIT LEADS AGAIN we explained the analogy of a dog’s senses to the timing relationship between the Credit, Bond, Currency and Equity Markets.
In this note we want to add some guidelines along with charts to further assist in using these ideas as useful market timing tools. The MATASII Economic Monitor is very valuable in the application of Timing Guidelines
 GUIDELINES TO UNDERSTAND THE TIMING OF MARKETS
Like our “DOG” analogy, smelling or sensing something is quite different than actually seeing and feeling it! It may be the same “something”, but the timing of fully understanding it comes with all senses working together.
DIFFERENT TIMINGS
Animals often:
- SMELL IT FIRST: Like Credit Markets (Graphic – Above Right)
- HEAR IT SECOND: Like Bond Markets
- SEE IT THIRDLY: Like Currency Markets
- ARE THEN IMPACTED IN SOME WAY BY IT: Like Equity Markets
SOME TIMING GUIDELINES:
1-THE 12-18 MONTH GENERAL MONETARY POLCIY GUIDELINE
The policy actions and initiatives that the Federal reserve institutes typically impact the economy with a delay. What is confusing is that the particular initiative will have its own particular duration before its impact is felt. An investor is best served by minimally taking a stab at what that timing may be, write it down (you will forget about it over time) and then prepare accordingly. Over time you will establish a working timetable. Without it you will never figure out what is really going on or what markets to assess for impact and effectiveness.
A starting point is to assume that changes to the Fed Funds Rate take about 12-18 months to work through the economy. Reductions in the Fed’s Balance sheet are similar in duration. The big variable is how big either are and the rate of change.
2-THE 12 MONTH CREDIT IMPULSE GUIDELINE
The Chinese Credit Impulse and its major cycles have become a major impactor on the global economy since the 2008 Financial Crisis. We discuss it further below, but it has become pretty well defined as leading the global impact by approximately 12 months.
China is currently emerging from its Zero Covid lockdowns and has been dramatically increasing liquidity to fend off the fallout – not too dissimilar to what the western economies went through. Expect the US Economy to see this impact beginning in the fall of 2023 (write it down now!).
3-THE 6-8 MONTH MARKET LEAD TIME GUIDELINE
The equity markets generally price the markets with approximately a six to eight month lead time. Before the headline numbers are broadcast by the media they have been priced in with an approximation in advance. Derivations to those expectations are normally seen as a short term “shock” that are dampened out quickly with a slightly lower or higher adjustment.
4-CYCLES & SPIRALS
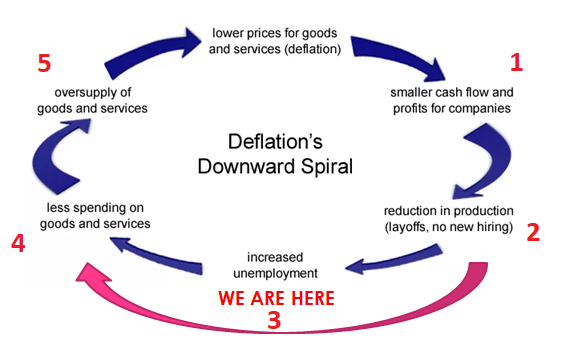 Often timing markets is about the overlay of predictable sequences of economic developments. The time frame is quite variable, but the sequence is often not. The current Deflation Spiral underway is such an example. Understanding the sequence and then judging the timeframe as events unfold adds significantly to predictability of markets.
We are presently watching closely and assessing the ongoing developments of stage #3, 4 and 5 shown in the graphic to the right.
THE DEFLATION SPIRAL WORKING ITS WAY THROUGH THE MARKET PSYCHE!
NOTE: In the next three sessions we highlight the type of charts from which we overlay our four general guideline highlighted above. This process step is proprietary but we encourage subscribers to download the charts and then try some overlays. Minimally it is a great learning experience in gaining timing perspective.
FIRST REVERSAL SIGNAL
REAL RATES, INFLATION BREAKEVENS, 10Y UST YIELDS & US DOLLAR
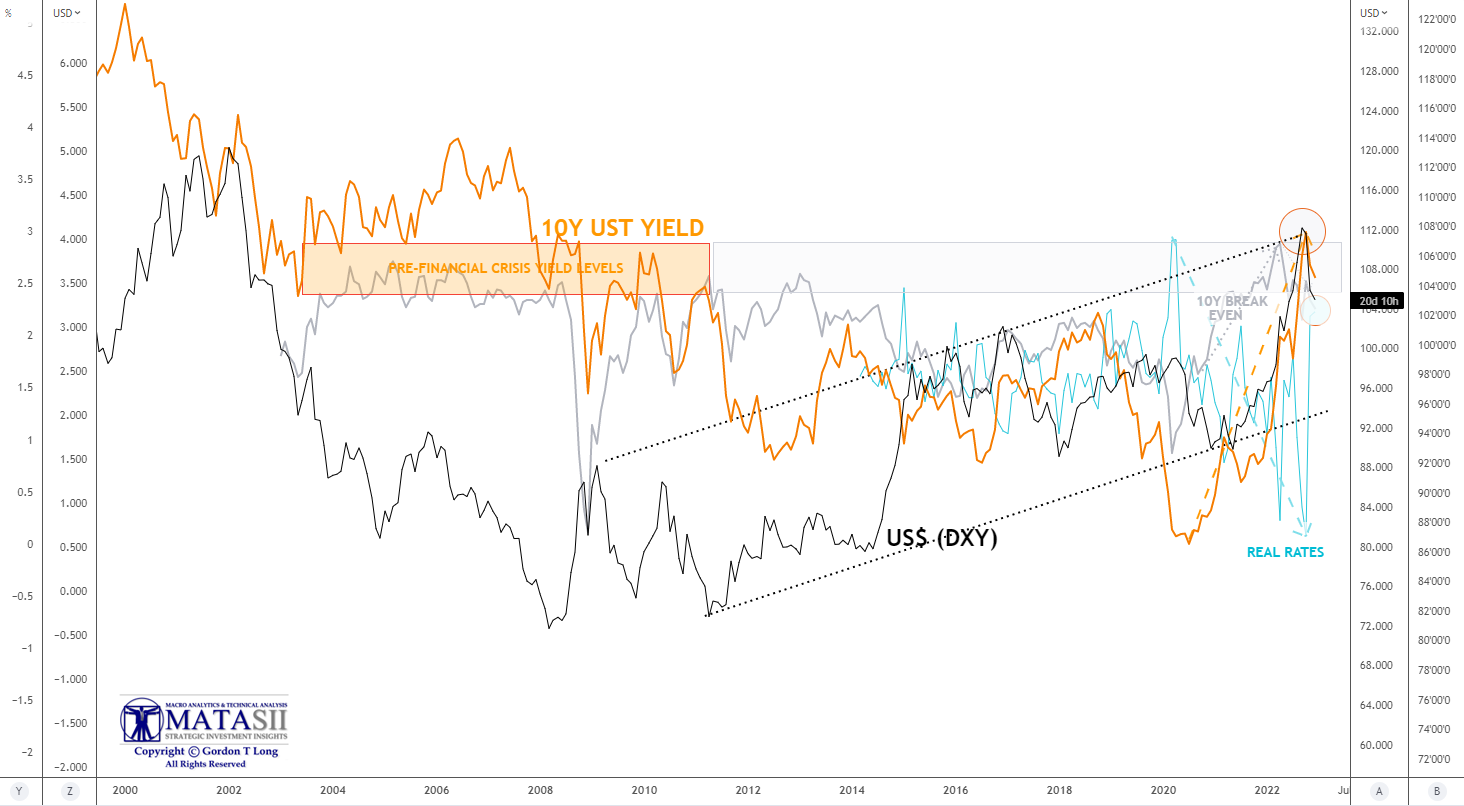 CHART RIGHT: Comparison of:
-
- 10Y USY YIELD (TNX)
- US$ (DXY)
- 10Y REAL RATE
- 10Y BREAKEVEN
In the longer term chart to the right and a near term exploded view below we see:
-
- We have just completed a major intermediate term inflection point in key market indices.
- We have corresponding reversal highs in 10Y UST Yields, the US Dollar, Real Rates, 10Y Inflation Breakevens and the S&P 500.
- The S&P 500 is experiencing further downward weakness since 10Y Inflation Breakevens began to fall, while real rates rose. Real rates have began weakening since.
THE MARKET HAS NOW SIGNALED IT HAS BEGUN TO PRICE IN A Q2 2023 RECESSION.
THE PRICING WILL COME IN STAGES AS FIRST THE DEGREE OF US RECESSION
IS DETERMINED AND THEN A POSSIBLE CONFIRMATION OF A GLOBAL RECESSION.
THE S&P 500 DETERIORATION WILL FOLLOW EARNINGS WARNINGS AND LOWER ESTIMATES.
WTIC CRUDE PRICING CONFIRMS THIS.
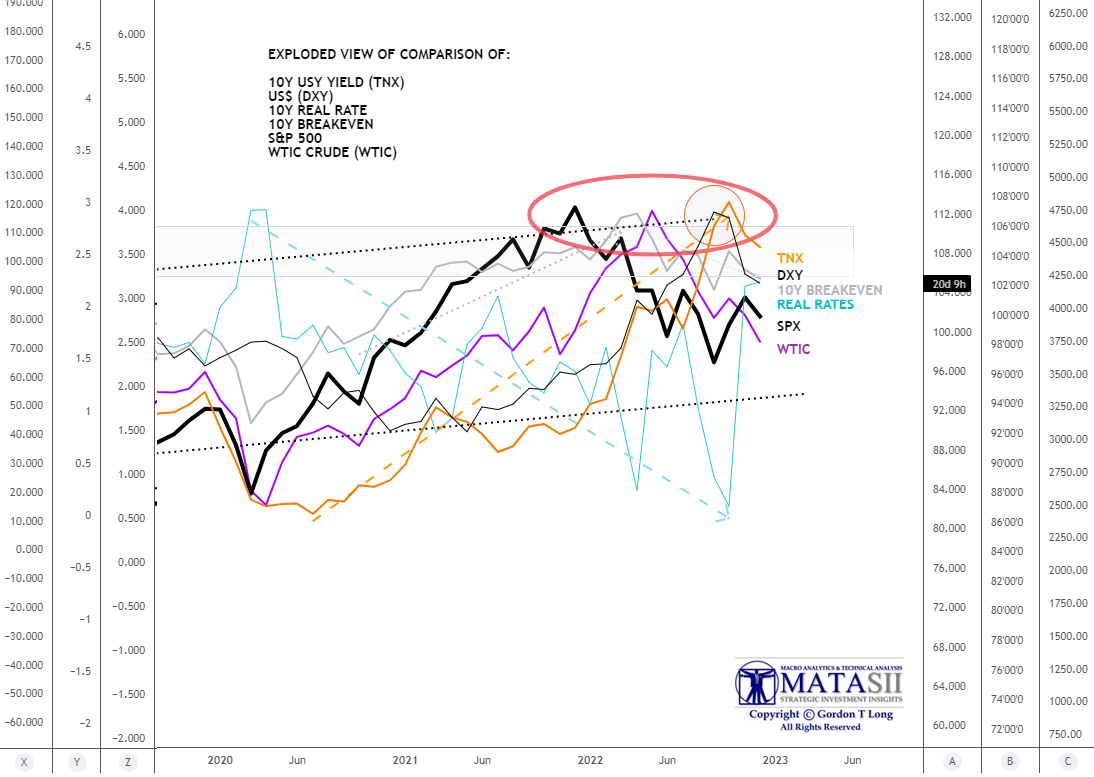
CHART BELOW:
Exploded view of the above chart with S&P 500 and WTIC Crude Oil overlays:
Macro Analytics Chart: SUBSCRIBER LINK
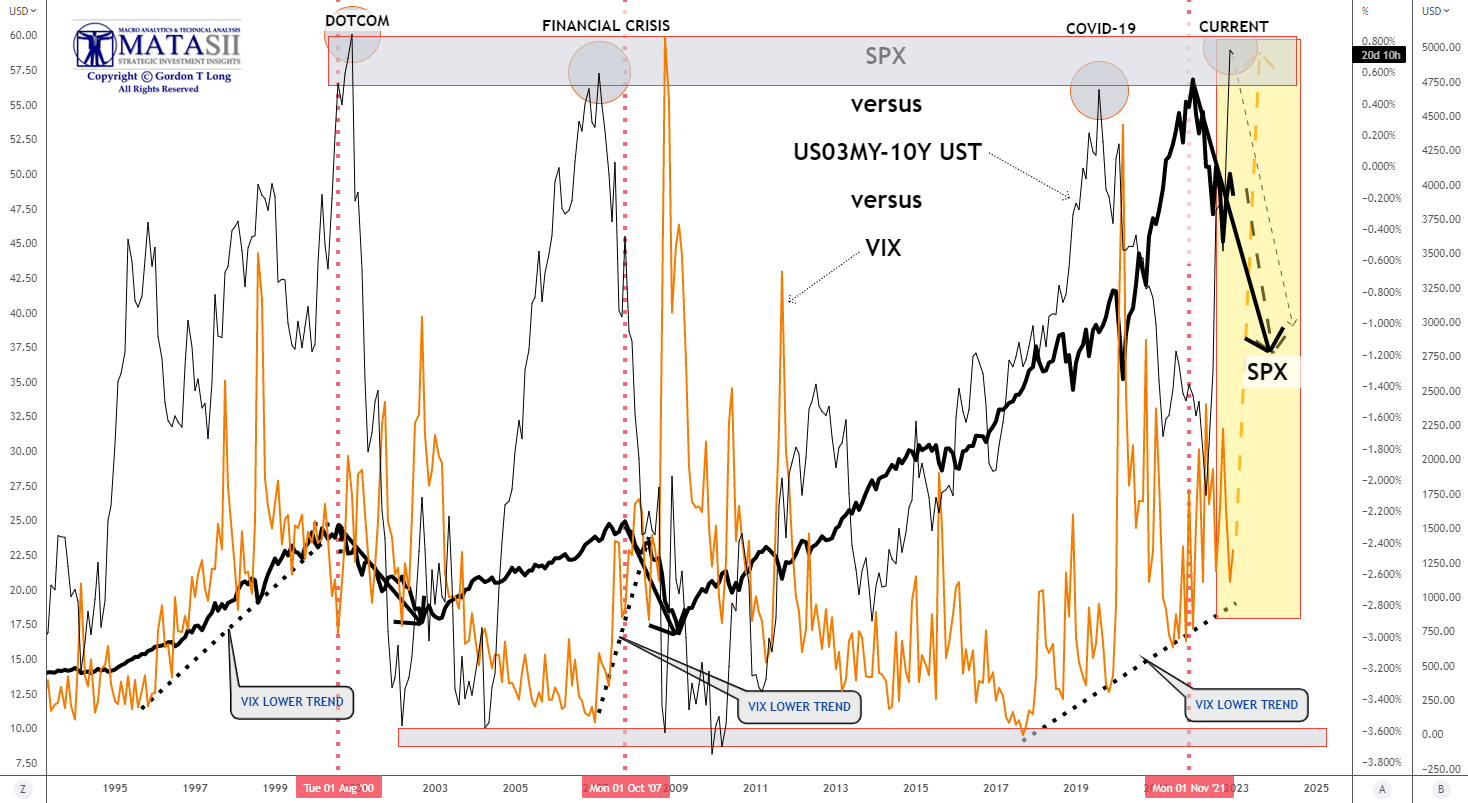
INVERTED YIELD CURVE versus LONG TERM VIX TREND
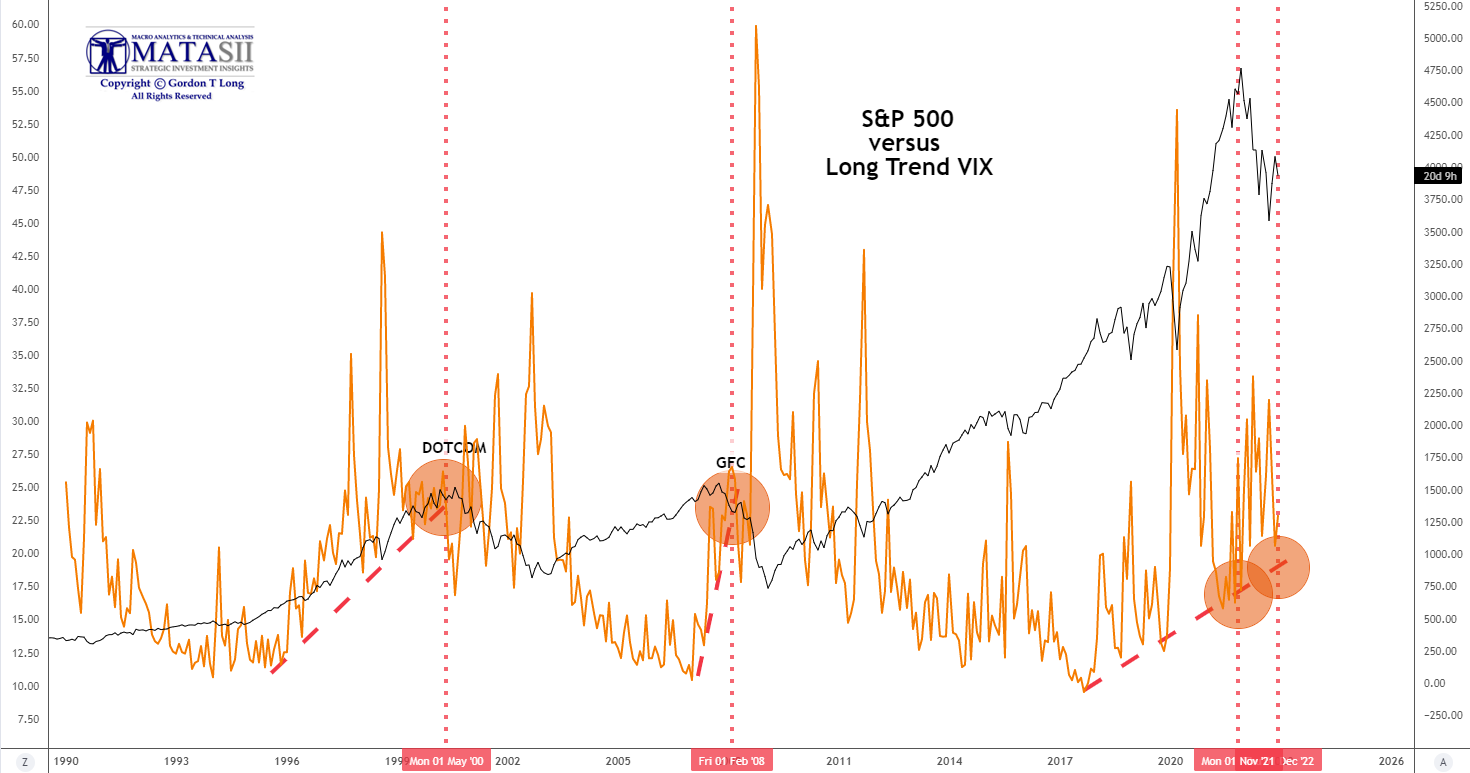 Bond Yields, Real Rates and the US Dollar have already began to lead the way with this re-pricing!In our latest LONGWave video we expanded on the MATASII Economic Indicator with a number of economic charts. We had insufficient time to take the Long Term VIX versus the S&P 500 comparison (chart to the right) as far as we would have liked.
Below we show that chart where we added an inverted 3 month Treasury Bill minus the 10Y UST line graph.
The message combined with the Unemployment Rate and PMI (charts in the video) is clear. The market is ready to begin pricing in the coming recession which it now sees out about 6 months.
Bond Yields, Real Rates and the US Dollar have already began to lead the way with this re-pricing!
Macro Analytics Chart: SUBSCRIBER LINK
CHINESE CREDIT IMPULSE
The Chinese Credit Impulse has saved the US and Global Economy on four separate occasions since the 2008 Financial Crisis. Can China do it a fifth time?
We believe the short answer is that not this time. It will be too little too late, remembering there is an approximately 12 month lag between the Chinese Credit Impulse and it being felt by the global economy.
The good news is that is likely to ignite a major counter rally in the Bear Market. There is a strong possibility that counter rally will end the existing Bear Market. HOWEVER, this will only be followed by a continuation of another Bear Market.
In actuality we see one large secular market built around a large cyclical bear market broken by a cyclical bull market.
When it is completed by mid decade, it is highly likely to be seen as “The Great Debt Stagflation”.
CURRENT DEVELOPEMENTS IN THE CHINESE CREDIT IMPULSE
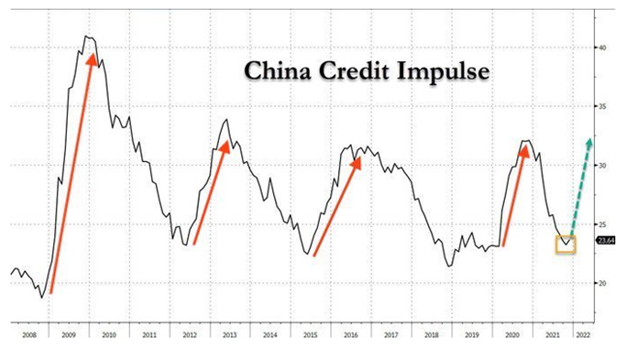
CHART BELOW: The Chinese Credit Impulse has saved the US and Global Economy on four separate occasions since the 2008 Financial Crisis.
CONCLUSION
CAPITUALTION: IT TAKES AN EVENT
THE EVENT IS A SUDDEN STARK REALIZATION THAT AN ILLUSION (FALSE BELIEF) IS NOT REALITY!
Market Breadth is likely the correct way to view what is possibly ahead:
The current Illusion is built on the false belief that:
-
- The Coming Recession is Priced In:
- The US Recession is not only not fully priced in but a possible Global Recession is not priced in.
- Additionally, the degree and sustainability of a secular global recession has never been experienced in a highly indebted and leveraged modern society.
- Inflation is coming down and will soon no longer be a problem.
- The Fed is about to “Pivot” and we will then return to expansive QE liquidity.
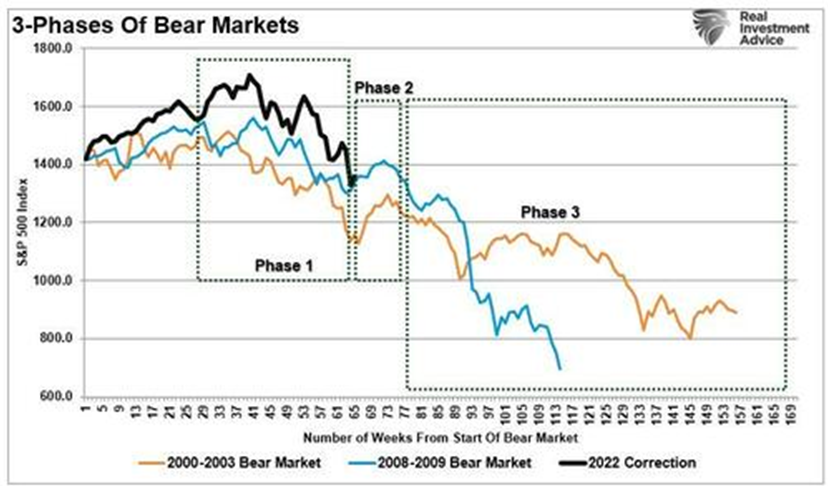
Bear Markets often come in three stages. The middle stage is a protected flat period. The Third stage is often the deepest over a longer period of time.
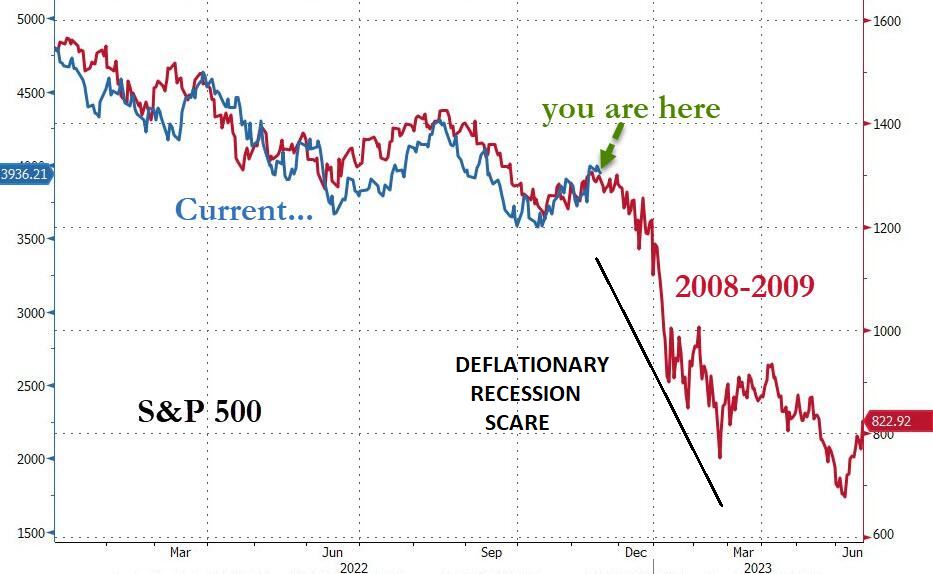
The next leg down in the current Bear Market is likely to be triggered by the reality of a “Global Deflationary Recessionary Scare”.
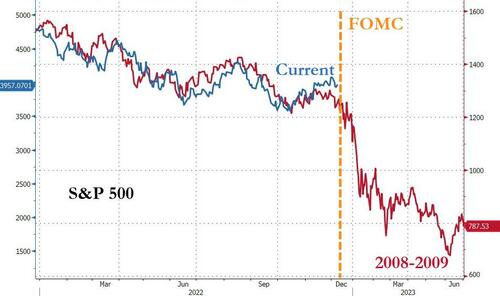
The 2008 Market analogy continues to play out extremely closely. Time will tell if it will follow a similar sentiment timeline? This upcoming FOMC meeting may potentially be a market “charring” event if the Fed is seen too Bullish towards fighting inflation and continues to downplay an obvious looming recession and fallout from interest pressures.
2023 OUTLOOK
It is highly likely that the 2023 bottom up consensus earnings are materially too high. It is more inline with another 8% lower to $195 in the base case, a reflection of worsening output from our leading earnings models. This leaves16% below consensus on ’23 EPS and down 11% from a year-over-year growth standpoint. After what’s left of this current tactical rally, we see the S&P 500 discounting the ’23 earnings risk sometime in first half via a ~3,000-3,300 price trough. Our long held 3270 low on the S&P 500 is still valid.
We think this occurs in advance of the eventual trough in EPS, which is typical for earnings’ recessions. While we see 2023 as a very challenging year for earnings growth, 2024 should be a strong rebound where positive operating leverage returns—i.e., the next boom. Equities should begin to process that growth reacceleration well in advance and rebound sharply to finish the year at ~3,900.
Price leads earnings and it’s not typical to put a trough multiple on trough earnings. What this suggests is the Q1 price low is marked by a 13.5-15X multiple on a forward EPS number of ~$220.
13.5 X 220 = 2970
15.0 X 220 = 3300
A MORE BEARISH ALTERNATIVE ANALYSIS (Excerpted from a recently detailed analysis by Graham Summers)
When Treasuries were yielding 0.25%-0.4% throughout most of 2020 and 2021, investors were willing to pay 20-22 times forward earnings for stocks. However, once Treasury yields rose over 4% stocks were repriced down to 16-18 times forward earnings. This makes sense. When the “risk free” rate of return is close to zero, you’ll pay a premium for growth. But once you can earn 4+% “risk free” suddenly stocks look a lot riskier!
Indeed, stocks were priced at 20-22 times forward earnings for most of 2020 and 2021. However, once Treasury yields began to rise in late 2021, stocks peaked in terms of multiples. They were eventually repriced down to 16-18 times earnings.
The ONLY thing that would stop stocks from being repriced lower would be if bond yields stabilized. The yield on the 2-Year U.S. Treasury now appears to have peaked.
Earnings are now collapsing, as the economy collapses into a severe recession. This means the denominator in the P/E ratio (Price/ Earnings) is now shrinking. Earnings for the third quarter of 2022 are DOWN 8% Y-o-Y. As Charlie Bilello notes, this is the second consecutive quarter of negative earnings growth on a Year over Year basis.
Unfortunately, earnings will be dropping even more going forward. To understand why, we need to first understand the Treasury market. The Treasury is comprised of numerous bonds with different maturation periods ranging from 4 weeks to 30 years. When you plot the yield on all of these bonds, you get the “yield curve.” And the difference in yield between various bonds on this curve is one of the most accurate predictors of recession. Specifically, the difference between the yield on the 10-Year U.S. Treasury and the yield on the 3-month U.S. Treasury.
Anytime this difference becomes negative (meaning the 3-month yield is actually higher than the 10-year yield) this indicates a recession is about to hit. The yield curve of the Treasury market is predicting a severe recession in the near future, likely the start of 2023. This is going to force stocks to new lows.
During the typical recession, Earnings Per Share (EPS) usually fall 25%. As I write this, Wall Street’s current consensus for 2023 EPS is $230. And Wall Street expects this to GROW by 5%!!! This means the anticipated fair value for the S&P 500 is somewhere between 3,680 and 4,140. Incidentally, that is the EXACT trading range the S&P 500 has been moving in for the last six months.
Put simply, the market is trading based on what Wall Street expects is coming down the pike. But as I just noted, Wall Street expects earnings growth of 5% next year. However, the reality is that bonds are telling us a recession is coming… and a recession would mean a DECLINE in earnings of at least 25% (remember, the yield curve is predicting a SEVERE recession).
This would mean the actual 2023 EPS would be closer to $172.
Assuming Treasury yields no longer rise, this means the fair value for the S&P 500 at 16 to 18 times this much lower EPS would be 2,752-3,096.
Historically, anytime the Fed stops tightening and begins easing:
- The markets don’t actually bottom for another 14 months.
- During the Tech Crash, the Fed started cutting rates in January of 2001. However, by that point, a recession had hit and stocks lost another 44% eventually bottoming in October 2003.
- Similarly, during the Housing Crash, the Fed started easing in August of 2007. There again, a recession hit and stocks lost another 56% before eventually bottoming in March 2009.
- Even if the Fed were to surprise everyone and start easing as soon as next month (December) the coming recession would STILL result in EPS collapsing and stocks cratering another 30% or so.
With stocks at 4,000 or so on the S&P 500, a 30% decline would bring them right to… 2,800, or around the lower end of the implied fair value for the market at a 16- times my expected EPS for 2023: $172.
Low Multiple Recessionary EPS Fair Value in 2023
16 X $172 = 2,752 or ~2.800
So again, this week we have both good news and bad news.
- The good news is that bonds are stabilizing.
- The bad news is that a recession is coming, and earnings are about to crater.
That will trigger a stock market collapse to new lows… possibly down to the mid-2000s on the S&P 500.
THE WORST IS STILL IN FRONT OF US THROUGH TO THE BEGINNING OF Q1 2023.
FADE THE COUNTER RALLY – SELL THE RIPS.
HOLD LONG DATED TREASURIES
IN Q2-Q3 2023, EXPECT TO BUY EQUITIES & SELL TREASURIES.
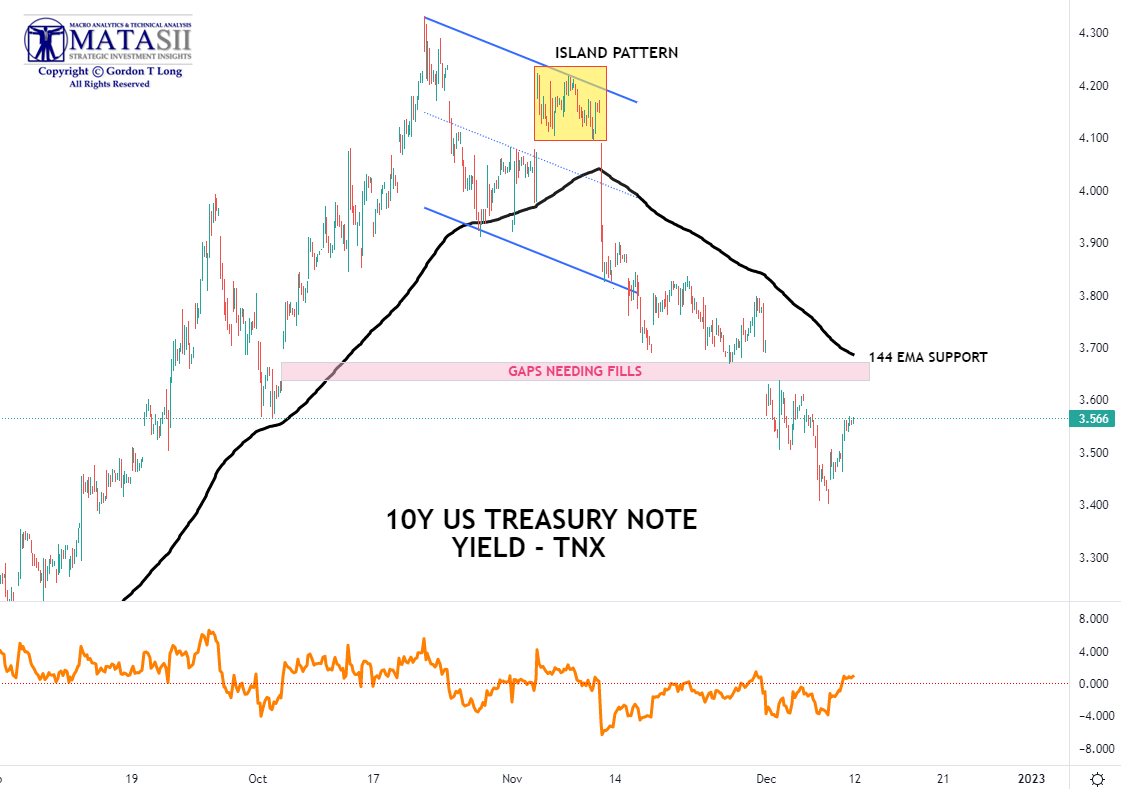
THE US TREASURY PRICE RALLY NEEDS TO CONSOLIDATE.
Look for a short term move back towards its 144 EMA.
Yellen keeping the world afloat – temporarily!
NOTE: An ISLAND PATTERN is a high probability pattern and a major Intermediate Term reversal signal.
YOUR DESK TOP / TABLET / PHONE ANNOTATED CHART
Macro Analytics Chart: SUBSCRIBER LINK
FAIR USE NOTICE This site contains copyrighted material the use of which has not always been specifically authorized by the copyright owner. We are making such material available in our efforts to advance understanding of environmental, political, human rights, economic, democracy, scientific, and social justice issues, etc. We believe this constitutes a ‘fair use’ of any such copyrighted material as provided for in section 107 of the US Copyright Law. In accordance with Title 17 U.S.C. Section 107, the material on this site is distributed without profit to those who have expressed a prior interest in receiving the included information for research and educational purposes. If you wish to use copyrighted material from this site for purposes of your own that go beyond ‘fair use’, you must obtain permission from the copyright owner.
NOTICE Information on these pages contains forward-looking statements that involve risks and uncertainties. Markets and instruments profiled on this page are for informational purposes only and should not in any way come across as a recommendation to buy or sell in these assets. You should do your own thorough research before making any investment decisions. MATASII.com does not in any way guarantee that this information is free from mistakes, errors, or material misstatements. It also does not guarantee that this information is of a timely nature. Investing in Open Markets involves a great deal of risk, including the loss of all or a portion of your investment, as well as emotional distress. All risks, losses and costs associated with investing, including total loss of principal, are your responsibility.