Gordon T Long
Global Macro Research | Macro-Technical Analysis
MACRO
US MONETARY POLICY
FINANCIAL REPRESSSION III: A Forced Regime Change
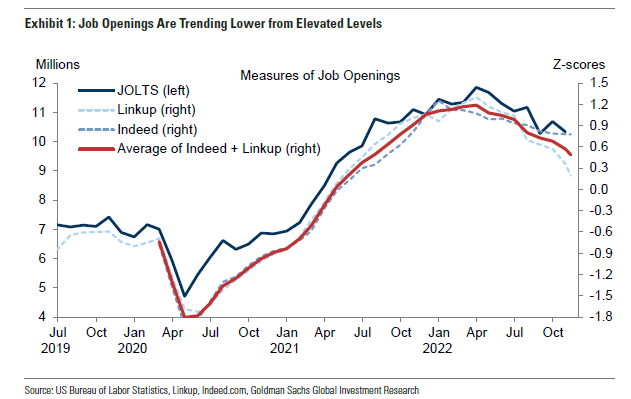
The US debt problem is taking on a new and worrying complexion as announced layoffs begin showing in spiking unemployment numbers. The October ADP, JOLTS and Non-farm Payrolls (NFP) releases were clear warning signals. With approaching half of US taxpayers expected to not pay or defer paying taxes, corporate margins under pressure and “Zombie” corporations being well over 20% of the S&P 500, the US Treasury will soon have a potential funding problem — especially as debt funding rates steadily continue to rise!
The ~$2.0T non-discretionary US government budget, ~$0.8T defense budget plus new needs will likely not be covered by tax revenues in 2023. This does not include existing deficit funding costs. Global lenders have become extremely nervous especially with the US and global economy looking at the strong possibility of a major recession beginning in early 2023.
The latest Black Friday consumer sales, rapidly plummeting US savings accounts and weakening discretionary spending only reconfirm the potential shock hitting heightened global Financial Fragility Risk levels. Fragility Risk has become the number one concern that the IMF and Federal Reserve both warned about in their latest Financial Stability Reports.
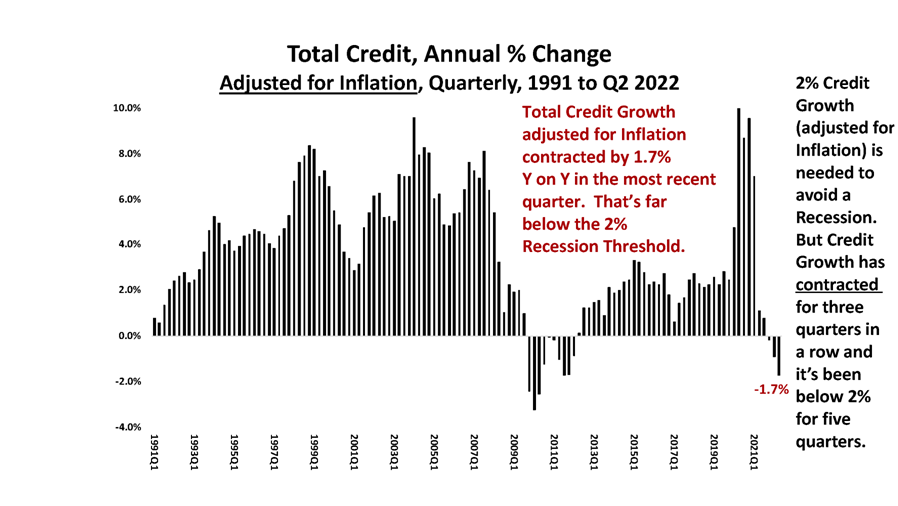
With the US credit growth rate falling short, it will be the new tools of Financial Repression III that governments will be forced to adopt to keep the system afloat. A system with Climate Change, Mass Migration, UBI and a war in the Ukraine are still to be financially addressed.
=========
WHAT YOU NEED TO KNOW
- THE REGULATORY STATE: Fiscal (Government) versus Credit (Banking)
- SHIFT IN MONEY CREATION – Money within the US Monetary and Money Centered fractional banking system only comes into existence when it is lent and becomes debt. The US runs on credit creation. The rate of credit creation is no longer sufficient to maintain financial stability and leverage levels.
- We are entering an era of the emerging Regulatory State effectively running like a Shadow Banking System on Steroids. This is one of the shifts in Financial Repression III.
- TOOLS: PRICE CONTROLS
- We are witnessing the re-introduction of price controls within US Fiscal Policy.
- Calls for price controls were realized when, in August 2022, President Biden signed the Inflation Reduction Act into law. This bill implements price controls by allowing Medicare to effectively cap the price of prescription drugs. (Link)
- Another piece of legislation to implement price controls was passed by the House of Representatives in May 2022. The Consumer Fuel Price Gouging Prevention Act, if it became law, would give the President the power to declare an emergency, allowing the Federal Trade Commission to place price ceilings on retail gasoline. (Link)
- Financial Repression is a Macroprudential Monetary approach, which like all monetary approaches, is primarily effective in matters of Demand. It does not directly impact nor influence Domestic and Global Supply. Price Controls only distort the Demand/Supply relationship further.
- Financial Repression III will therefore be forced to expand towards regulatory controls on matters of supply. Specifically it is likely to be initially centered on Energy, Utilities, Food and Shelter.
- We are witnessing the re-introduction of price controls within US Fiscal Policy.
-
- MATASII’S POSITION DIFFERS FROM FURTHER USE OF PRICE CONTROLS
- Reducing government spending would tamp down on demand-fueled inflation, while at the same time restoring confidence in the ability of the federal government to pay down the debt and thus control inflation expectations.
- Removing barriers to work through occupational licensing reform, increased work flexibility and mitigating work disincentives in tax and transfer programs would increase labor force participation, thereby reducing the cost of production for firms.
- Deregulation of energy, housing and other markets would reduce the regulatory burden on businesses, lowering the cost of domestic production and bringing down prices.
- Removing barriers to international supply by reducing tariffs and eliminating regulatory barriers like the Jones Act and Foreign Dredge Act would provide consumers access to cheaper goods and increase the resiliency of supply chains.
- MATASII’S POSITION DIFFERS FROM FURTHER USE OF PRICE CONTROLS
-
- NOTE — FUTURE NEWSLETTERS WILL EXPAND “TOOLS” WHICH ARE BEING USED AS “RING FENCING” FOR FINANCIAL REPRESSION III VIA GOVERNMENT REGULATORY PROVISIONS. THE AREAS TO BE COVERED INCLUDE:
-
-
- TOOLS: CAPITAL CONTROLS
- TOOLS: WAGE CONTROLS
- TOOLS: YIELD CURVE CONTROL (YCC)
- TOOLS: NATIONALIZATION / CONSERVATORSHIP
- FNE & FDE CONSERVATORSHIP
- PENSION NATIONALIZATION
- TOOLS: OTHER
- ASSET FOREITURE (IRS) – Example of Massachusetts Recent Election – 4% over $1M
 CONCLUSION
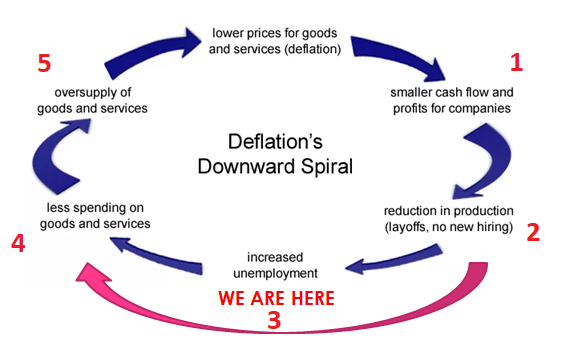
- We presently have both Inflation and Deflation concurrently. We have outlined this on prior occasions (Click). The Fed’s favorite inflation indicator, the PCE, is still at its highest level since 1983. Meanwhile the Deflation Spiral as shown to the right is well underway.
- We layout the detailed situational analysis of all five stages in this newsletter.
-
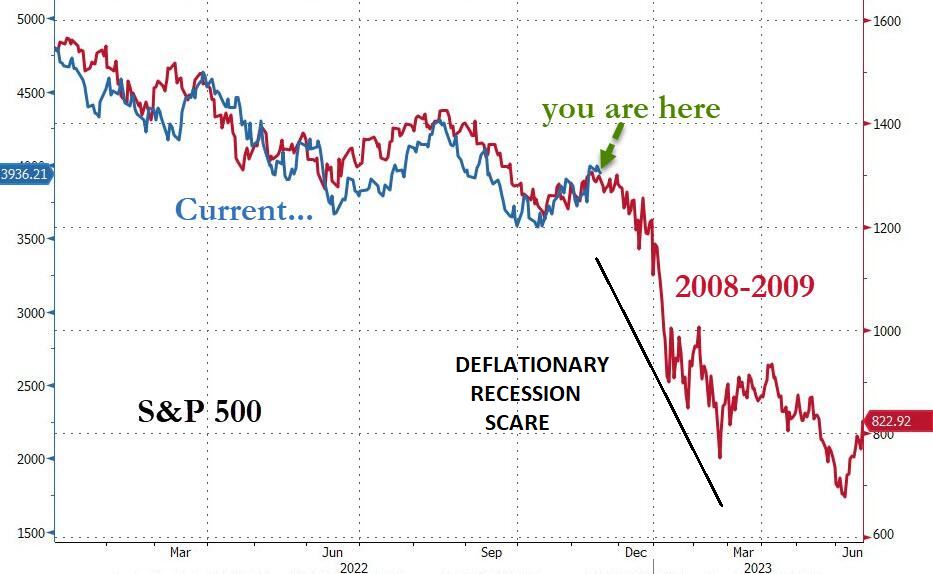
The Long Expected and Overdue Recessionary Deflationary Scare is Soon to Arrive.
However, first a Seasonal Santa Claus Rally … then the Pain!
=========
FINANCIAL REPRESSION III – The Regulatory State
-
- Creditism has reached an inflection point which is forcing a shift and broadening in the application of Financial Repression.
- The State will be required to produce more credit versus this being solely the purview of the Central Bank.
- It is becoming more Government Fiscal Credit Creation versus Central Bank / Banking Credit Creation.
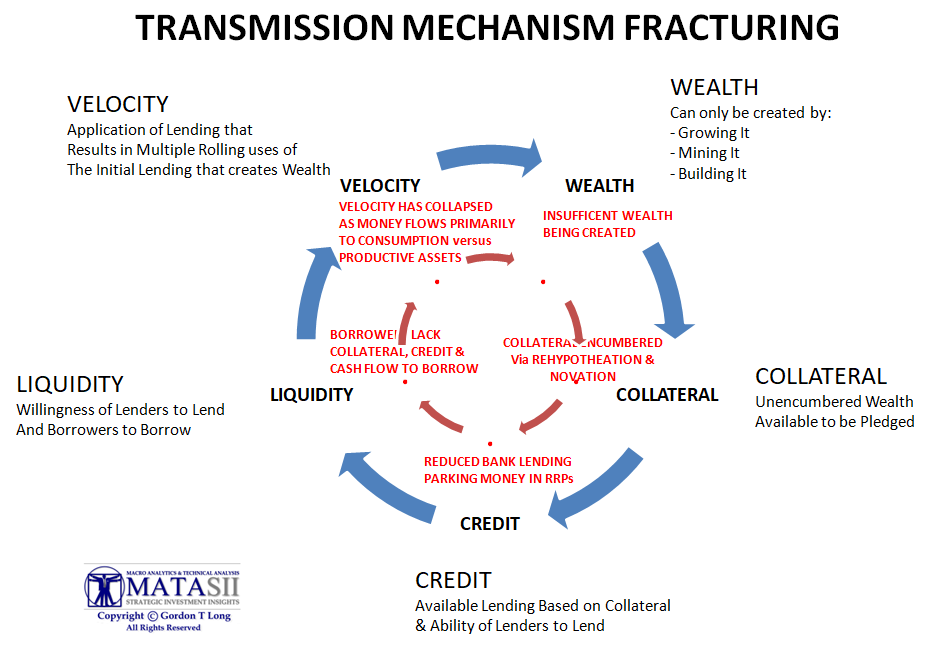
- The application of Government Guarantees through off balance sheet Contingent Liabilities will be increasingly used.
- The shortage and current restriction of availability of unencumbered Collateral is sidestepped.
- This alters Exeter’s Pyramid through expanded use of Derivatives with no Collateral but supported by US Guarantees.
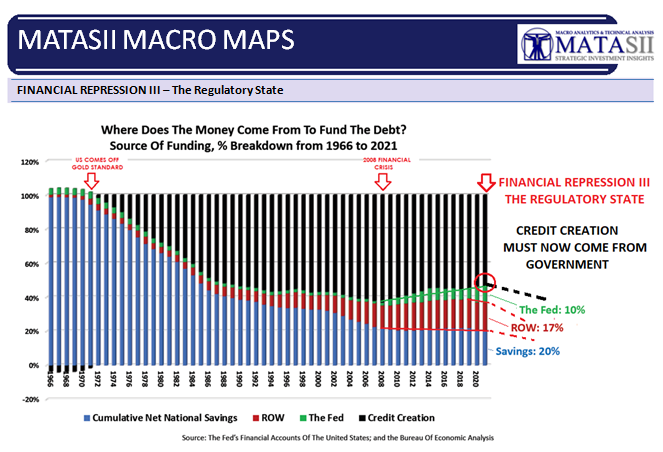
THE REGULATORY STATE
MONEY MUST BE LENT INTO EXISTENCE
 Money within the US Monetary and Money Centered fractional banking system only comes into existence when it is lent and becomes debt. The US runs on credit creation. The rate of credit creation is no longer sufficient to maintain financial stability and leverage levels.
GOVERNMENT GUARANTEES – OFF-BALANCE SHEET CONTINGENT LIABILITIES
To reduce existing government debt burdens through negative real rates, as well as to fund insufficient credit creation, US and western Developed economies are quickly being forced to morph towards Financial Repression III. A stronger regulatory state is now needed because Banks have become unable to create a sufficient rate of credit growth. Meanwhile the supporting Central Banks’ balance sheets have become bloated and need to be reduced.
WE NOW EEFECTIVELY HAVE A BANKING SYSTEM ON STEROID!
The credit spigot has become “jammed” and now urgently needs a new solution!
TOOLS: PRICE CONTROLS
 According to the United States Congress Joint Economic Committee published on 09/27/22:
“Inflation has grown rapidly over the last year and reached a 41-year high of 9.1 percent in June 2022. In response, some policymakers have proposed implementing price controls (in particular, price ceilings) to reduce the cost of inflation for consumers.”
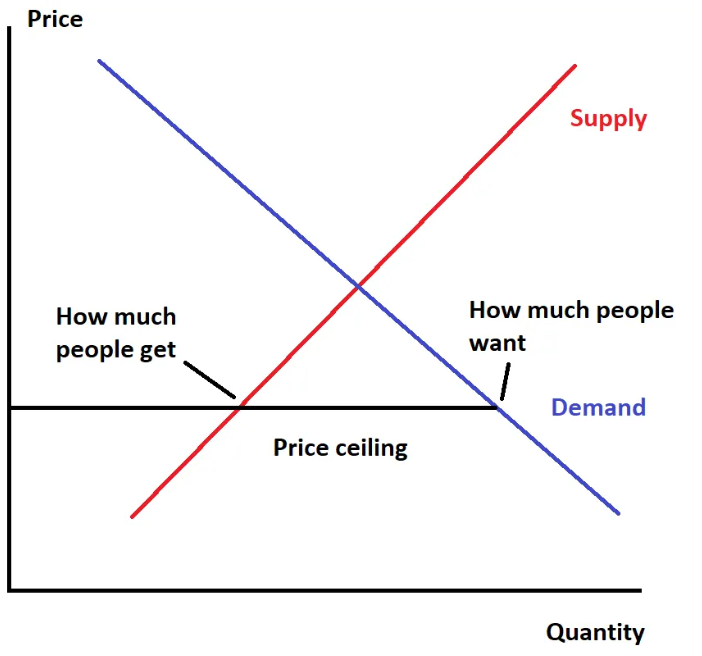
A price control is a requirement that a seller charges a government mandated price for a good instead of letting the price be determined by supply and demand. A price ceiling is set below the market price—where
supply and demand intersect—requiring sellers to offer their product to consumers at a discount. When prices are set by a ceiling, consumers ace a shortage because at the lower price, the seller is willing to supply
fewer goods and consumers simultaneously demand a larger quantity. At artificially low prices, sellers either supply fewer goods because they receive a lower return per unit sold, or reduce the quality of their product in order to maintain profitability. The price of the good is low for a few consumers, but the resulting shortage
means that people who want the good can no longer buy it.
This scenario is shown above right.
UNDERSTANDING
-
- Prices paid reflect the current state of supply and demand in an economy and work as an incentive mechanism for producers to produce more when prices rise and for consumers to consume more when prices fall.
- When a price floor is set above the equilibrium price, quantity supplied will exceed quantity demanded, and excess supply or surpluses will result.
- Some policymakers have proposed implementing price controls (in particular, price ceilings) to reduce the cost of inflation for consumers. Instead of sustainably lowering prices, price ceilings cause shortages, reduce product quality and can make longer-term inflation worse.
- The reason most economists are skeptical about price controls is that they distort the allocation of resources. To paraphrase a remark by Milton Friedman, economists may not know much, but they do know how to produce a shortage or surplus.
- The negative effects of price controls are many. By creating shortages, they often cause people to wait in line. They often cause the quality of products whose prices are controlled to fall and they can lead to favoritism by suppliers. All those effects remain until the price controls are ended.
- Price controls can be imposed in a variety of ways. They may involve price ceilings, or price floors, imposed on selected goods and services by the authorities. Government management of prices can also occur as a by-product of other policies.
- Price floors and price ceilings are inefficient. So, if equilibrium is economically efficient, under what circumstances can we find economic inefficiency? A price floor or a price ceiling will prevent a market from adjusting to its equilibrium price and quantity, thus creating an inefficient outcome.
- Why are price controls such a bad idea? They distort price signals, which are core to markets’ functioning effectively and, not unrelatedly, economic growth. Prices balance supply and demand, coordinating production and consumption. They are signals, full stop.
EXAMPLES: ARE RAPIDLY GROWING AROUND THE WORLD
-
- 11/30/22: Britain’s energy watchdog proposes power price controls
- 11/14/22: US AARP did seniors no favor backing Medicare drug price controls (Biden’s Inflation Reduction Act {IRA} is attempting to lower prescription drug costs and provide care subsidies)
- 11/09/22: EU Plans to Outline Gas Price Controls
- 11/21/22: Warnings for Japanese pharmaceutical market may lead to more lenient price controls
1970’s US EXAMPLE (Source Link)
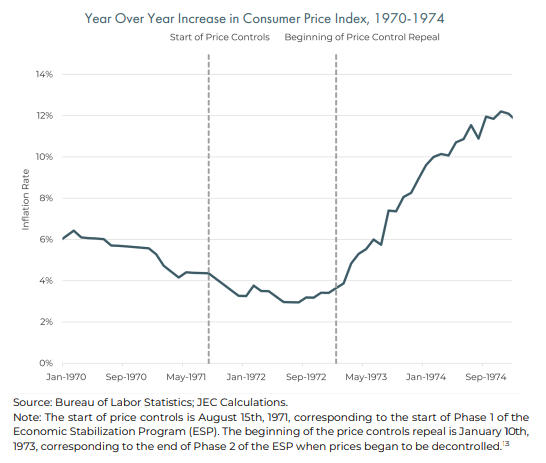
A more recent example of national price controls began in 1971 during the Nixon Administration. In response to rising inflation, the Economic Stabilization Program (ESP) imposed price controls throughout the economy on the price of goods and services and wages. Initially, prices were effectively frozen and could not be adjusted. Ninety days later, the policy was modified so that firms could increase prices but could not increase profit margins or wages outside of set parameters.9 Realizing the unsustainability of the policy for the long term, the price controls were slowly lifted by Presidential Executive Order starting in January 1973.10 Though the ESP reduced the rate of inflation in the short term, if price controls had not been lifted, widespread shortages were predicted in agricultural markets, such as beef, and were likely to worsen in durable and raw materials markets, such as cement, lumber, steel, and other similar goods where shortages were already occurring.
Following the decontrol of prices, Figure 2 shows inflation jumped from 3.6 percent to 8.9 percent between January and December 1973, before peaking at 12.2 percent in fall 1974.12 The surge in consumers’ pent-up demand, driven by their inability to get needed products due to shortages caused by the price control program, led to dramatically higher inflation after the program ended. The higher prices eradicated any short-run inflation-reducing benefits the policy may have had.
Particularly harmful price controls were placed on oil during this period. Following the relaxation of broad price controls under the ESP in January 1973, demand for oil increased, which together with the Organization of Arab Petroleum Exporting Countries’ oil embargo, exacerbated oil shortages. Price controls were kept in place for all petroleum products
(imports and exports) by President Nixon under the ESP through 1973, which caused even larger shortages. Following the resulting price surge, another layer of price controls was implemented on domestic oil production in a split system for different types of oil under the Emergency Petroleum Allocation Act passed in November 1973. These controls were consolidated into a national average price control, set below market price following the passage of the Energy Policy and
Conservation Act of 1975.14 Unable to sell oil at market rates domestically, oil companies sold to unrestricted foreign markets, leading to further domestic oil shortages beyond those initially spurred by the embargo and the expanded demand induced by artificially low prices. The price ceilings were revoked as it became clear the price controls had caused
the mass shortages, resulting in many consumers not having access to gasoline regardless of the price. The overall costs of rationing and lost long term investment in increased production harmed consumers in both the short- and long-run.
 Following the decontrol of prices, Figure 2 shows inflation jumped from 3.6 percent to 8.9 percent between January and December 1973, before peaking at 12.2 percent in fall 1974.12 The surge in consumers’ pent-up demand, driven by their inability to get needed products due to shortages caused by the price control program, led to dramatically higher inflation after the program ended. The higher prices eradicated any short-run inflation-reducing benefits the policy may have had.
Particularly harmful price controls were placed on oil during this period. Following the relaxation of broad price controls under the ESP in January 1973, demand for oil increased, which together with the Organization of Arab Petroleum Exporting Countries’ oil embargo, exacerbated oil shortages. Price controls were kept in place for all petroleum products (imports and exports) by President Nixon under the ESP through 1973, which caused even larger shortages. Following the resulting price surge, another layer of price controls was implemented on domestic oil production in a split system for different types of oil under the Emergency Petroleum Allocation Act passed in November 1973. These controls were consolidated into a national average price control, set below market price following the passage of the Energy Policy and
Conservation Act of 1975.14 Unable to sell oil at market rates domestically, oil companies sold to unrestricted foreign markets, leading to further domestic oil shortages beyond those initially spurred by the embargo and the expanded demand induced by artificially low prices. The price ceilings were revoked as it became clear the price controls had caused
the mass shortages, resulting in many consumers not having access to gasoline regardless of the price. The overall costs of rationing and lost long term investment in increased production harmed consumers in both the short- and long-run.
WHAT TO EXPECT IN FINANCIAL REPRESSION III
Accelerated global issues with Energy and Food Supply are already leading to Price Controls. Financial Repression III will aggravate amd worsen the problem!
FINANCIAL REPRESSION III IS HIGHLY LIKELY TO LEAD TO PRICE & WAGE CONTROLS
The negative effects of price controls are many. By creating shortages, they often cause people to wait in line. They often cause the quality of products whose prices are controlled to fall and they can lead to favoritism by suppliers. All those effects remain until the price controls are ended. But even after the price controls are gone, some of the regulations that came about as a result of the controls remain. Let’s not go down the price control path again.
-
- Price Controls Cause Shortages.
- Price Controls Change the Product.
- Price Controls Waste People’s Time.
- Price Controls Often Lead to Favoritism.
- Price Controls Can Lead to Regulation of Our Lives.
- Price Controls, as in the case of oil and gasoline in the 1970s, can lead to harmful regulation that lasts for decades.
- Price Controls during the 1970s caused shortages, especially of oil and gasoline. Rapid inflation followed the repeal of price controls.
- Price Controls can lower prices for some consumers but also cause shortages, which lead to arbitrary rationing and, over time, reduce product innovation and quality.
- Price Controls on prescription drugs—such as those imposed by the Inflation Reduction Act of 2022—stunt pharmaceutical innovation, imposing large, long-run costs on Americans that outweigh the short-run benefits of lower prices.
CONCLUSION
We have both Inflation and Deflation concurrently. We have outlined this on many prior occasions. (Click Image to Play Video). The Fed’s favorite inflation indicator, the PCE, is still at its highest level since 1983.
Meanwhile the Deflation Spiral is underway as laid out below.
STAGES FROM CHART ABOVE
STAGE 1 – CORPORATE PROFITS & CASH FLOWS UNDER PRESSURE
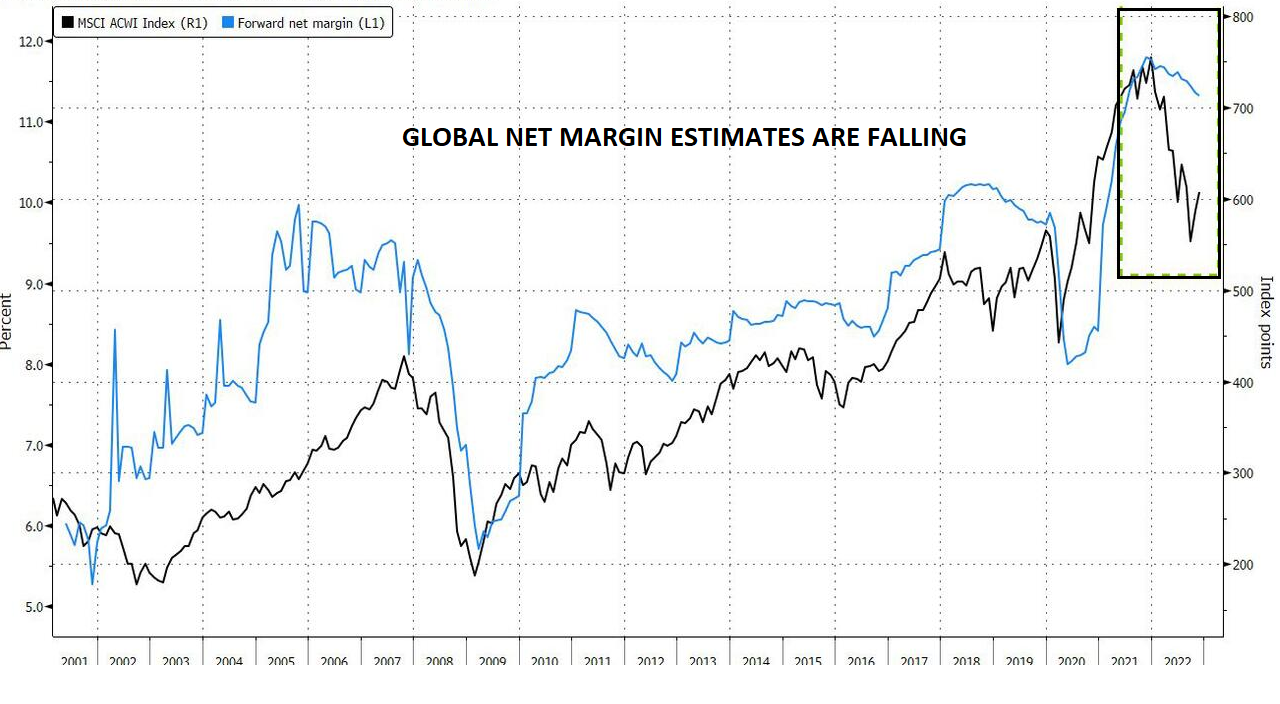 OPERATING MARGINS BEING SQUEEZED
-
- Increasing pressure on margins in the quarter as companies faced higher costs for:
- Materials,
- Energy and
- Labor.
- Additionally seeing slowing consumer demand, which is limiting their ability to raise prices.
- Management teams in general are now less optimistic about maintaining high margins.
- Analysts have been cutting margin expectations — but some say more is needed. “Input costs should be plateauing, but that won’t be enough to erase the pain for the bottom line” next quarter, said Sophie Lund-Yates, an equity analyst at Hargreaves Lansdown. “It isn’t just costs that are pinching margins, but weaker revenue growth too.”
- Increasing pressure on margins in the quarter as companies faced higher costs for:
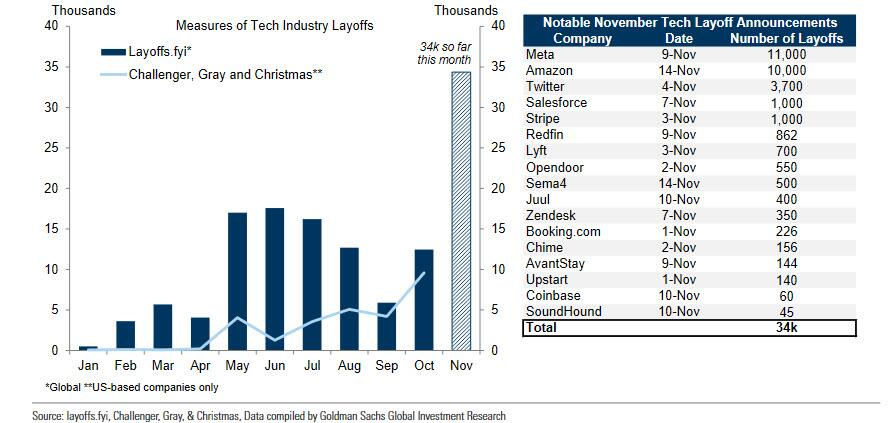
STAGE 2 – LAYOFFS & HIRING FREEZES
 See 11/14/22 Newsletters for details on surge of layoff announcements.
-
- Redfin lays off 13% of its staff
- Meta to fire 13% of its workforce
- Twitter lays off ~50% of its workforce
- Snap lays off 20% of its employees
- Wayfair: lays off 10% of its corporate team
- Microsoft fires 1,000 workers
- Disney to begin layoffs, targeted hiring freeze
- Re/Max to fire 17% of its workforce
- Compass to layoff 10% of its workforce
- Juul lays off ~1/3rd of its workforce
- Carvana lays of another 1500 (2500 previously)
 TECH COMPANIES are now “unexpectedly” firing thousands of highly-paid, woke millennials as the US economy crumbles into the worst recession since Lehman. Here are those I recorded in October alone:
Layoffs This Month (% of Total Workers) –
-
- Twitter: 50%
- Cameo: 25%
- Robinhood: 23%
- Intel: 20%
- Snapchat: 20%
- Coinbase: 18%
- Opendoor: 18%
- Stripe: 14%
- Lyft: 13%
- Shopify: 10%
- Meta: 13%
- Apple: Hiring Freeze
- Amazon: 3%
- Cisco: 5%
- Roku: 7%
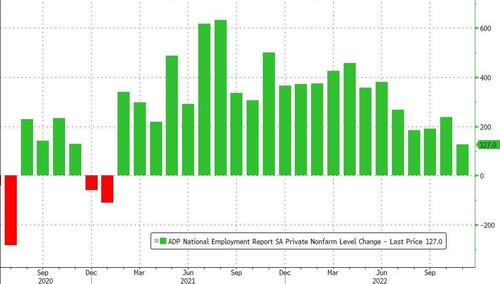
ADP REPORT
Signals “Turning Point” — Weakest Labor Gains Since Jan 2021
|
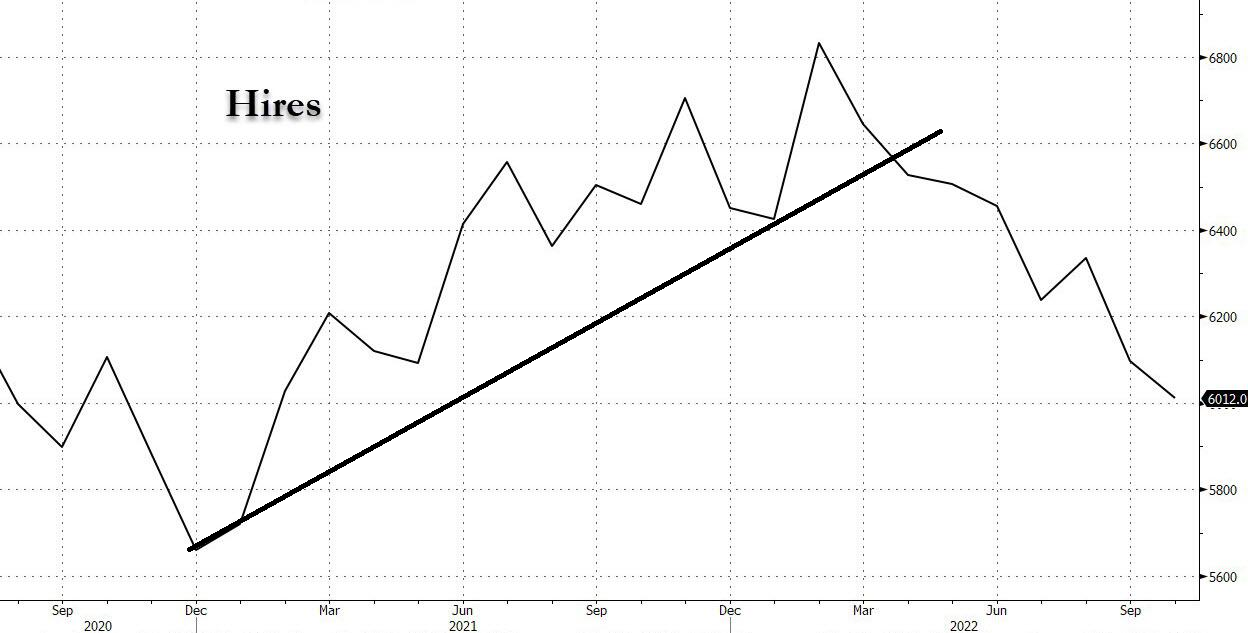
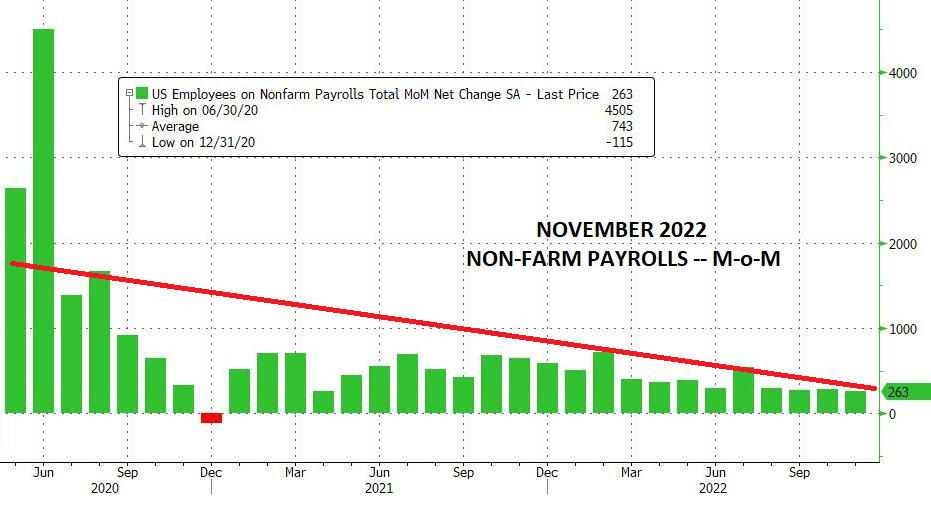
STAGE 3 – INCREASING UNEMPLOYMENT The Layoff Wave we previously reported on is now showing in Unemployment reporting. NOVEMBER 2022 NON-FARM PAYROLLS REPORT |
 |
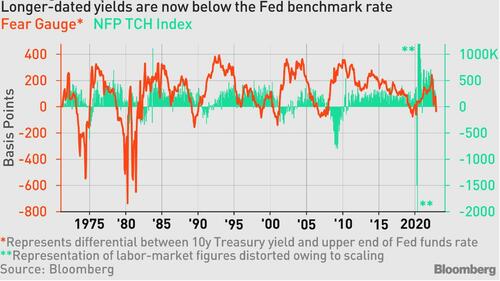
Yields on 10- and 30-year Treasuries slumped below the lower end of the Federal Reserve’s benchmark rate this month for the first time in the current economic cycle. That occurrence — a dipstick of fear in the market — has traditionally presaged a shrinking labor market in data going back more than five decades.
 |
|
CONTINUING JOBLESS CLAIMS Rose to 1.608mm, their highest since Feb 2022 |
 |
|
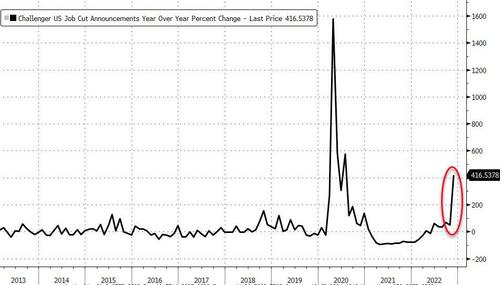
CHALLENGER JOB CUTS Exploded higher, jumping 416.5% YoY (up 127% in November). |
 |
|
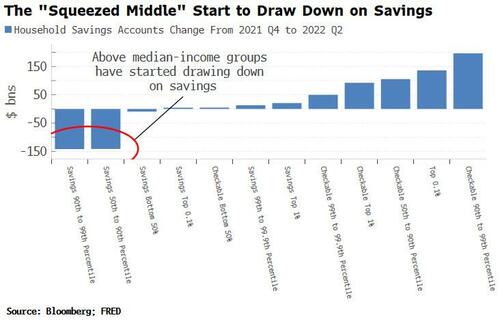
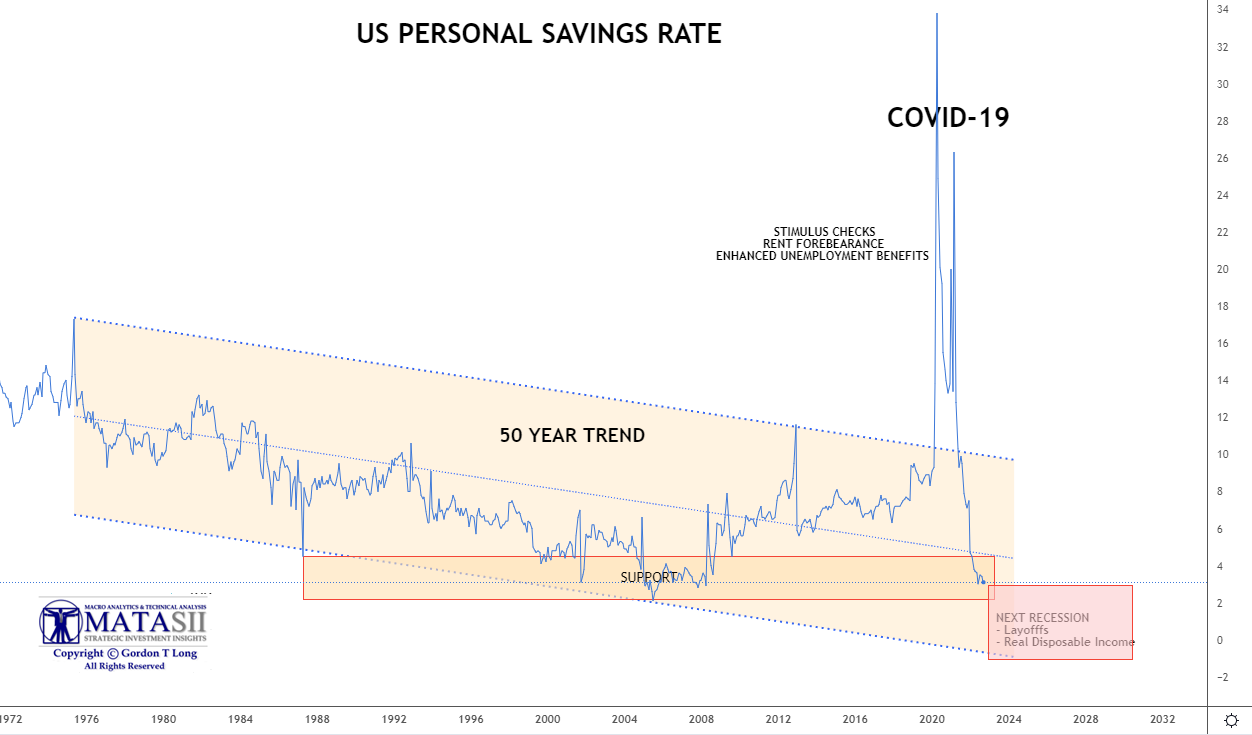
STAGE 4 – SHRINKING SPENDING ON GOODS & SERVICES Americans’ savings rate has plunged to just 2.3% of disposable income – the lowest since July 2005. |
|
|
STAGE 5 – OVERSUPPLY OF GOODS & SERVICES
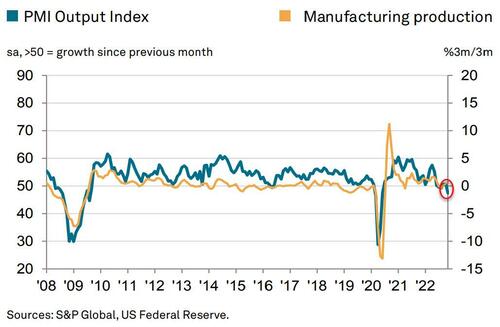 S&P Global US Manufacturing PMI 47.7 (Contraction) in November (final), is down from 50.4 in October – the weakest level since June 2020.
- US ISM Manufacturing tumbled to 49.0 (Contraction) in November, down from 50.2 in October – weakest since May 2020.
- All the major ISM sub-indices contracted with prices tumbling to 43.0.
Chris Williamson, Chief Business Economist at S&P Global Market Intelligence, said:
“A combination of the rising cost of living, higher interest rates and growing recession fears have led to slumping demand for goods in both the home-market and abroad. Companies are consequently cutting production at a rate not seen since the global financial crisis, if the initial pandemic lockdowns are excluded. However, even with the latest production cuts, the downturn in demand has still led to one of the largest increases in unsold stock recorded since survey data were first available 15 years ago, which suggests that companies will continue to reduce production in the coming months to bring these inventories down to more manageable levels.
“Likewise, companies are slashing their purchases of inputs and raw materials at a rate not seen outside of the pandemic since the global financial crisis.
“This slump in demand is increasingly manifesting itself in a shift from a sellers’- to a buyers’-market for a wide variety of goods, as evidenced by improving supply chains, meaning price pressures are now abating rapidly.
“While supply chain worries persist, notably in relation to China’s lockdowns, companies’ concerns are increasingly moving away from the supply side to focusing on the darkening outlook for demand, meaning the business mood remains among the gloomiest seen over the past decade.
2023 OUTLOOK
It is highly likely that the 2023 bottom up consensus earnings are materially too high. It is more inline with another 8% lower to $195 in the base case, a reflection of worsening output from our leading earnings models. This leaves16% below consensus on ’23 EPS and down 11% from a year-over-year growth standpoint. After what’s left of this current tactical rally, we see the S&P 500 discounting the ’23 earnings risk sometime in first half via a ~3,000-3,300 price trough. Our long held 3270 low on the S&P 500 is still valid.
We think this occurs in advance of the eventual trough in EPS, which is typical for earnings’ recessions. While we see 2023 as a very challenging year for earnings growth, 2024 should be a strong rebound where positive operating leverage returns—i.e., the next boom. Equities should begin to process that growth reacceleration well in advance and rebound sharply to finish the year at ~3,900.
Price leads earnings and it’s not typical to put a trough multiple on trough earnings. What this suggests is the Q1 price low is marked by a 13.5-15X multiple on a forward EPS number of ~$220.
13.5 X 220 = 2970
15.0 X 220 = 3300
THE WORST IS STILL IN FRONT OF US THROUGH TO THE BEGINNING OF Q1 2023.
FADE THE COUNTER RALLY – SELL THE RIPS.
HOLD LONG DATED TREASURIES
IN Q2-Q3 2023, EXPECT TO BUY EQUITIES & SELL TREASURIES.
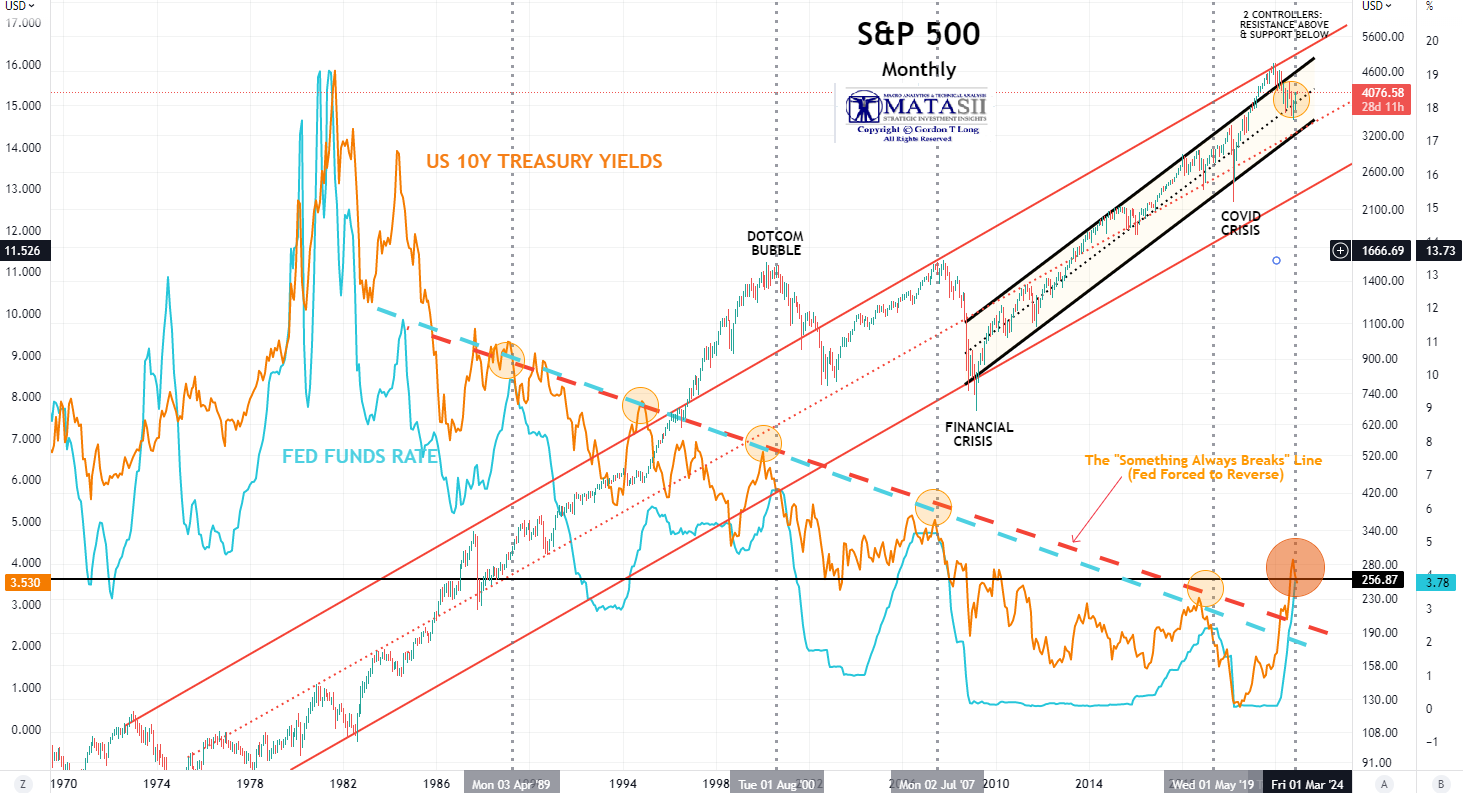
HISTORICALLY SOMETHING SHOULD HAVE BROKEN BY NOW!
Does the UK’s Gilt and Pension System (patched), Credit Suisse (patched) and Japanese Yen (sort of patched) not count?
Yellen keeping the world afloat – temporarily!
YOUR DESK TOP / TABLET / PHONE ANNOTATED CHART
Macro Analytics Chart: SUBSCRIBER LINK
FAIR USE NOTICE This site contains copyrighted material the use of which has not always been specifically authorized by the copyright owner. We are making such material available in our efforts to advance understanding of environmental, political, human rights, economic, democracy, scientific, and social justice issues, etc. We believe this constitutes a ‘fair use’ of any such copyrighted material as provided for in section 107 of the US Copyright Law. In accordance with Title 17 U.S.C. Section 107, the material on this site is distributed without profit to those who have expressed a prior interest in receiving the included information for research and educational purposes. If you wish to use copyrighted material from this site for purposes of your own that go beyond ‘fair use’, you must obtain permission from the copyright owner.
NOTICE Information on these pages contains forward-looking statements that involve risks and uncertainties. Markets and instruments profiled on this page are for informational purposes only and should not in any way come across as a recommendation to buy or sell in these assets. You should do your own thorough research before making any investment decisions. MATASII.com does not in any way guarantee that this information is free from mistakes, errors, or material misstatements. It also does not guarantee that this information is of a timely nature. Investing in Open Markets involves a great deal of risk, including the loss of all or a portion of your investment, as well as emotional distress. All risks, losses and costs associated with investing, including total loss of principal, are your responsibility.