Gordon T Long
Global Macro Research | Macro-Technical Analysis
MACRO
US FISCAL POLICY
YELLEN INITIATES HER PLAN!
A very, very, very, very slightly softer than expected Core CPI print (combined with broadly less-hawkish FedSpeak) sparked the biggest rally in stocks since April 2020, the biggest collapse in Treasury yields since March 2020 and the 3rd largest short squeeze ever! What does such a reaction tell you?
It told us that Yellen’s Plunge Protection Team (PPT) orchestrated exactly what we have been warning about – the temporary reduction of market pressures on the Federal Reserve’s Inflation fighting efforts without the Fed actually doing anything. Why do we sound so certain?
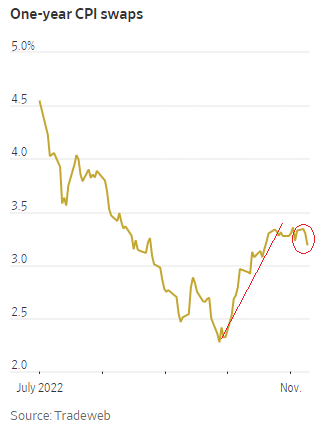
On Tuesday we read in the WSJ that CPI Swaps were suddenly falling. Additionally, so were Inflation Swaps. Our long term readers will recall when we were stunned to discover Inflation Swaps in May of 2021 and how they were controlling Treasury Break-Even rates and Real Rates within the Fisher’s Equation to control Treasury movements. Tuesday we discovered CPI Swaps. These were the Derivative instruments of choice for Yellen. We warned in our latest Newsletter (Yellen’s Forced Derivative & Contingent Liability Card) that Yellen would be forced to use the vast derivative markets to facilitate the Federal Reserve achieving its goals.
=========
The post-CPI rally was the largest since the Fed announced its initial Treasury QE program in March 2009. We had a 4 sigma to the topside move which has only happened ~11 times in the last ten years!
WHAT YOU NEED TO KNOW
 THE CPI MARKET SHOCKER!
- The CPI market reaction was a “save” across many markets both domestically and globally.
- Worrying fragility across most US markets (Equities, Bonds, Currencies, Risk, Credit) was temporarily reduced. Global markets also significantly benefited.
- SOMETHING TERRIBLY AMISS!
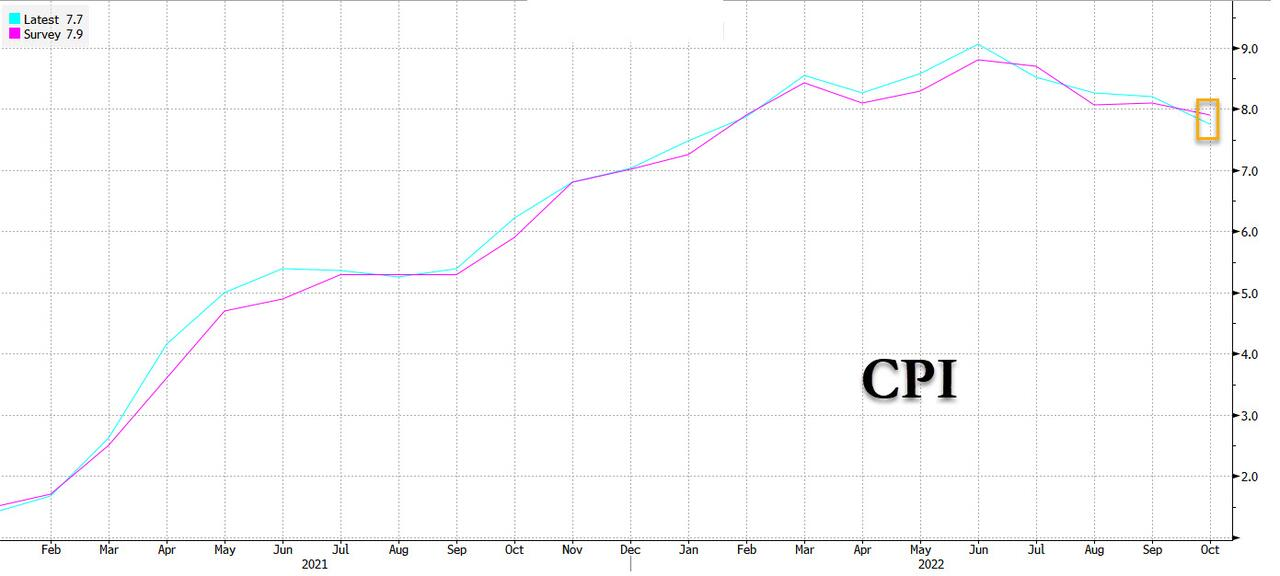
- The actual reported core CPI rose 0.3% and 6.3% Y/Y. The headline came in at 0.4% vs expectations of 0.6% and 7.7% vs expectations of 7.9%.
- What we can draw from this is that the market was almost desperate for anything resembling a confirming topping in inflation. Yes, it marginally got it! But in the bigger picture it is basically noise!
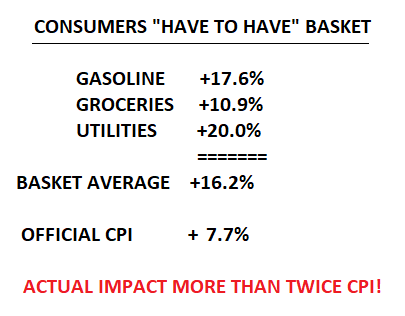
- Traders as expected gave little thought to the fact that consumer inflation for “Must Have” to survive items is up 16.2% compared to the good news of a CPI print of 7.7%.
- CROSS MARKET REACTIONAL LINKAGES
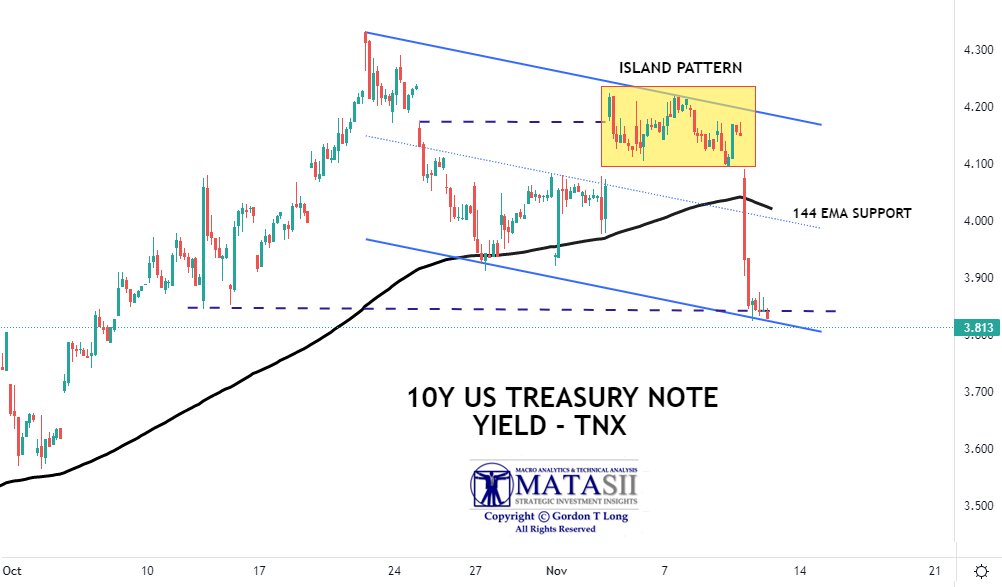
- What is also particularly note worthy is that Yellen and the PPT created an Island Formation Pattern. This typically marks a major trend reversal.
- It is going to be extremely difficult for traders to push Treasury rates higher with this pattern in place. It becomes a barrier assisting the Federal Reserve while at the same time limiting funding costs for the US Treasury. — Well done Janet!
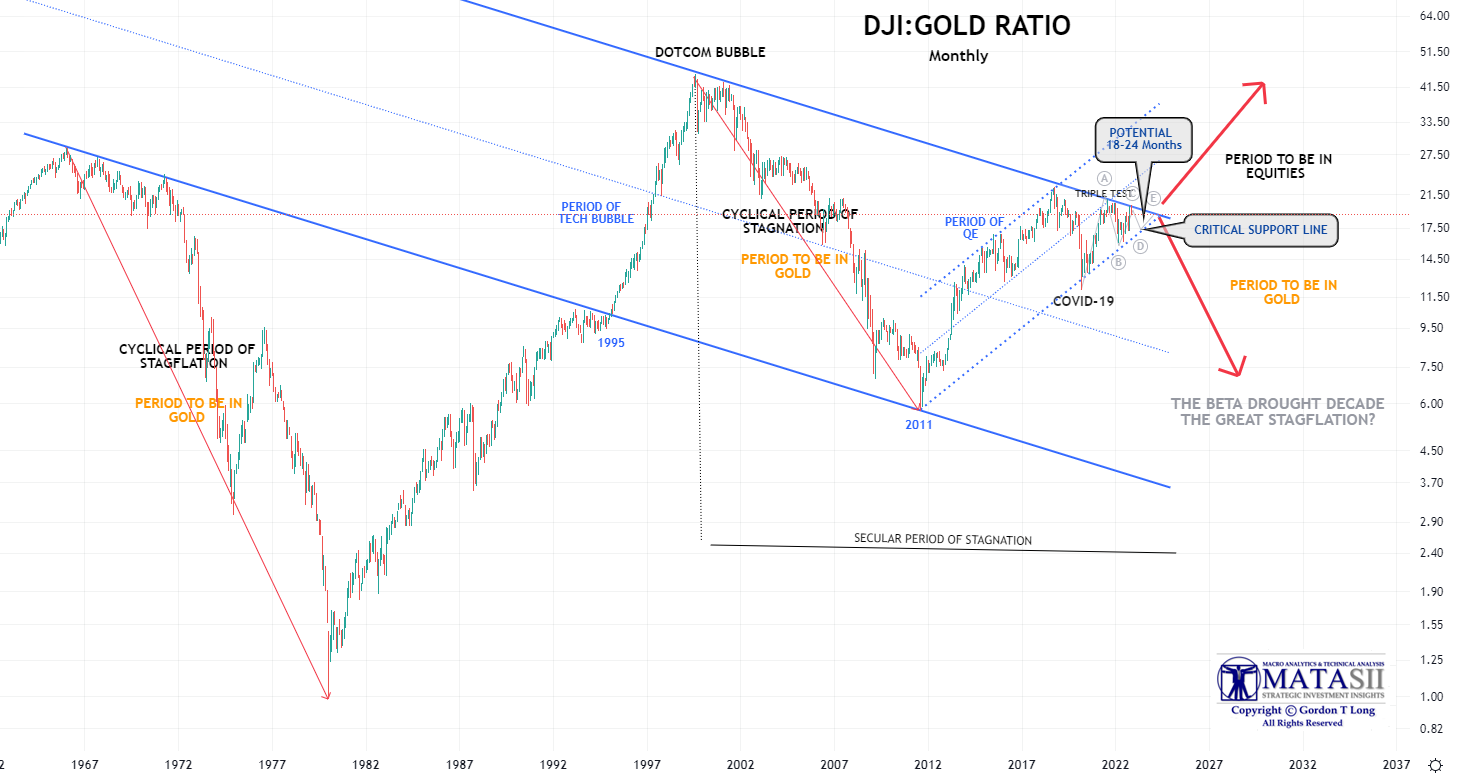
- THE DJI:GOLD RATIO “TELL”
- The DJI:Gold Ratio gives us a strong view of the long term inflection point the markets have now reached.
- Key ratio overhead resistance and support levels must be watched closely for indications of what lies ahead.
- There is a very strong likelihood the DJI:Gold ratio may take 18-24 months to resolve.
- THE KEY RALLY TECHNICALS
- Though the DJI:Gold ratio may not move dramatically during this 18-24 period, it does not mean that both the DJI and Gold will not rise concurrently during this period.
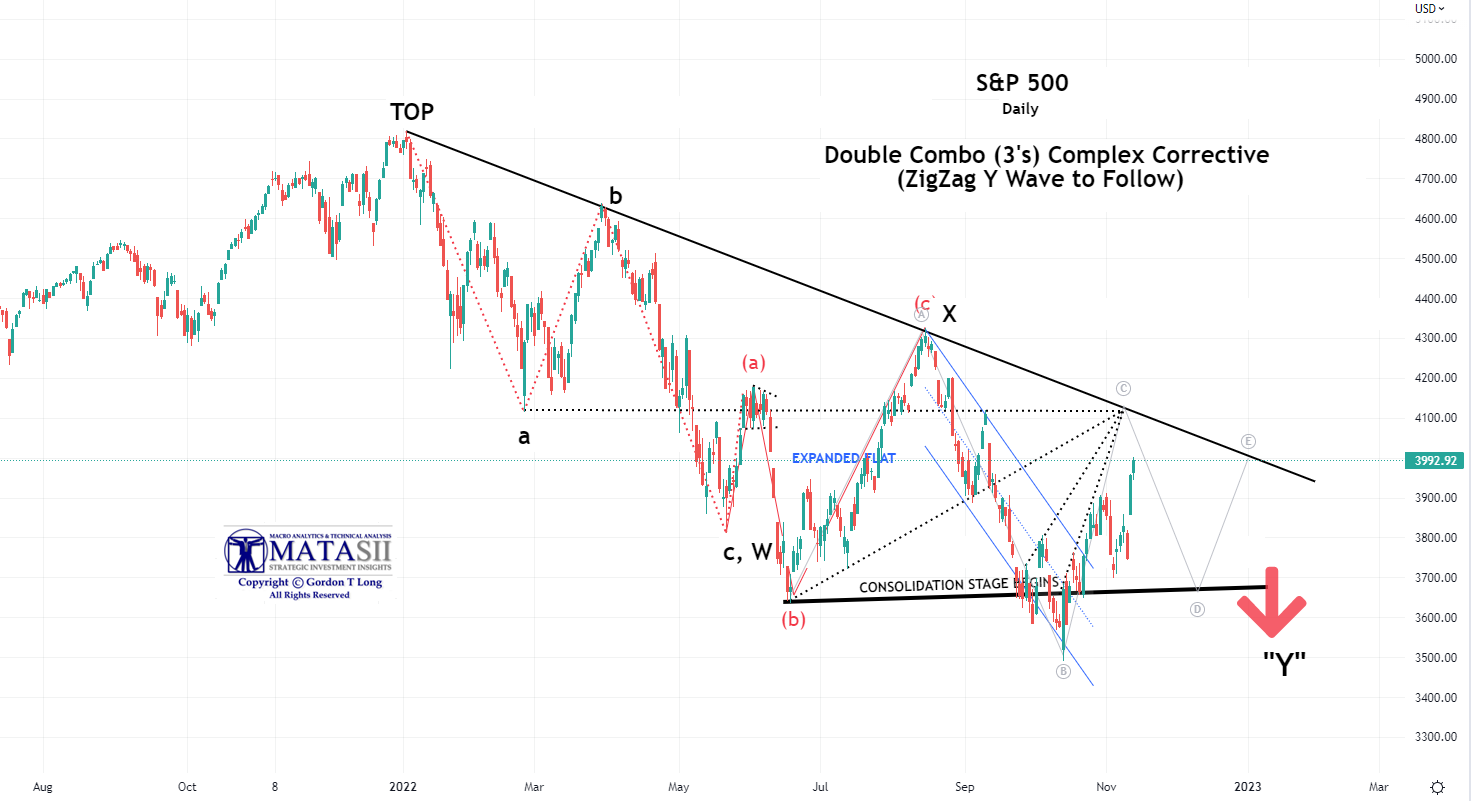
- This would support our thesis that markets may experience new highs or a double top over this 18-24 month period. (see chart in the “Current Market Perspective” section)
- CONCLUSION
- Yellen has begun using the derivative market as we suggested she would be forced to do. Indications are that Yellen’s PPT was extremely active during the CPI release spike.
The Initial “Fix” Is Underway … But Will It Be Sufficient?
Yellen and Powell’s Current Policy Strategies Will Only Delay the Inevitable Failure of Fiat Currencies and a Return to Sound Money.
=========
The dramatic move from the minor M-o-M CPI reading achieved a dramatic price spike resulting in lifting the S&P 500 trajectory towards our previously held Double Combo (ZigZag) target. Coincidence? I don’t think so! There may be no conspiracy, but then there are no blatant coincidences either!

THE CPI MARKET SHOCKER
A SAVE FOR VaR PORTFOLIOS & RISK PARITY TRADERS
The massive rally in stocks and bonds sent the 60/40 portfolio up 3.4% on Thursday. Since 1988, there have been only seven other sessions when the portfolio jumped more than 3%, all happening during the 2020 and 2008 recessions. This was a big relief for exposed Value-At-Risk (VaR) Portfolios, being forced to further liquidate. (GRAPHIC: A BIG RELIEF FOR VaR PORTFOLIOS >>)

A SAVE FOR MERGING MARKETS & EURODOLLAR DEBT
The Bloomberg Dollar Index (a broader measure than DXY) saw its biggest daily drop since March 2009. This resulted in a major save for the troubled Japanese Yen, Chinese Yuan, the Euro, Eurodollar and Emerging Markets (GRAPHIC: GLOBAL US DOLLAR PRESSURES TEMPORARILY RELIEVED >>).
A SAVE FOR THE FED’S NEXT HIKE
The collapse in December’s rate-hike expectations priced out a 75bps hike completely and locked in the expected 50bps hike expected out of the December FOMC meeting.
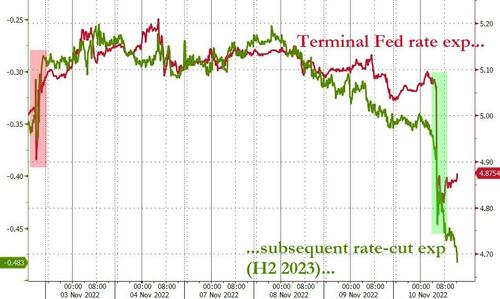
The Terminal Fed rate expectations tumbled back below 5.00% (meaning there are 100bps of hiking left in the cycle) – back below post-FOMC statement spike lows. At the same time, rate-cut expectations for after the peak in H2 2023 surged to almost 50bps (adding an tire 25bps rate-cut today). Realistically the only way The Fed is cutting that aggressively is if the US economy is in recession, and that is hardly a positive for stocks. (GRAPHIC: FED’S TERMINAL RATE >>)
A SAVE FOR BIG TECH STOCKS
The heavily weighted major Tech stocks lifted markets overall, because of their broad passive ETF positioning presence.
THIS WAS A MAJOR MARKET SAVE DAY
SOMETHING TERRIBLY AMISS
 WHAT WAS THE ACTUAL CPI IMPROVEMENT?
Economists surveyed by The Wall Street Journal prior to Wednesday’s CPI release were expecting a 7.9% annual inflation rate and a 0.5% month-over-month core rise (excluding food and energy prices). Major players like Goldman however were expecting a slightly below-consensus of 0.44% increase in core CPI in October (vs. 0.5% consensus and 0.6% prior), which would lower the year-on-year rate to 6.46% (vs. 6.5% consensus and 6.6% prior).
The actual reported core CPI rose 0.3% and 6.3% Y/Y. The headline came in at 0.4% vs Exp. 0.6% and 7.7% vs Exp 7.9%.
What we can draw from this is that the market was almost desperate for anything resembling a topping in inflation. Yes it achieved it, but in the bigger picture it is almost noise! (Graphic above right)
FOLKS, WE ARE BEING FURTHER PLAYED AS EVEN MORE WEALTH IS EXTRACTED FROM SHORT SELLERS!
|
WHAT THE MARKET TEMPORARILY HAS FAILED TO YET FULLY GRASP What traders gave little to no thought to was that the CPI confirmed the profound impact inflation is having on consumers in a 70% US Consumption Economy. The seriousness of the foundational “breakage” is not being fully appreciated as trading markets glamor over paper assets and FOMO.
|
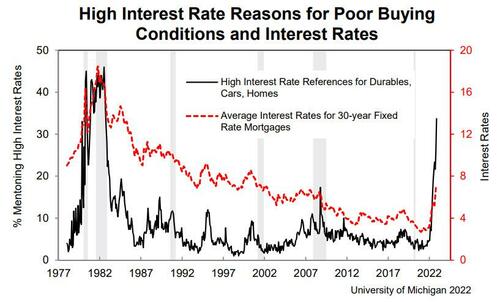
Fed chairman Jerome Powell’s favorite sentiment indicator is the U of Michigan survey. The preliminary November data shows that inflation expectations rose for the second straight month with 1Y exp up from 5.0% to 5.1% and 5-10Y exp up from 2.9% to 3.0%.
The survey showed that nearly half of consumers stated that inflation was eroding their living standards, leading many from lower- and middle-income families to change their spending habits.
“Higher-income consumers, whose outlooks were darkened by continued turbulence in stock and housing markets, will likely pull back their spending going forward. With overall sentiment remaining low, these factors highlight the risk of recession in the quarters ahead. Continued uncertainty over inflation expectations suggests that such entrenchment in the future is still possible.”
CROSS MARKET REACTIONAL LINKAGES
It is interesting to examine the cascading impact that occurred prior to and then within milliseconds of the CPI announcement.
-
- PRIOR TO: Buying activity in CPI and Inflation Swaps 24 hours prior to announcement. (Our view this was Yellen’s PPT.)
- CPI RELEASE:
-
-
- Treasury Yields Spiked Lower (Real Rates and Inflation Breakevens the driver as a result of further CPI and Inflation Swaps buying).
- The US Dollar Plunged (lifting most major currencies world wide).
- Gold Spiked on a falling Dollar.
- US Equities spiked as a result of the above and expectations of a slightly more Dovish Fed.
-
With all the dramatic action it is interesting that the above resulted in a well managed shift to the lower trend channel of the US 10Y Treasury Note (TNX). What is also particularly note worthy is that Yellen & the PPT created an Island Formation Pattern. This typically marks a major trend reversal. It is going to be extremely difficult for traders to push Treasury rates higher with this pattern in place. It becomes a barrier assisting the Federal Reserve while at the same time limiting funding costs for the US Treasury. Well done Janet!
THE DJI:GOLD RATIO “TELL”
We have found the DJI:Gold Ratio chart to be very telling.
- We see on the left that during the 1970’s we had a period of cyclical stagflation where equities were weak, with gold being particularly strong. This resulted in a period of a tumbling DJI:Gold ratio.
- After the Dotcom Bubble exploded in 2000 we faced a period of cyclical stagflation, where the DJI:Gold ratio fell for over a decade. Equities were weak while gold performed well.
- Since the Dotcom Bubble we appear to have likely entered a longer term secular stagnation era that may not be over yet.
- The lift in the ratio from 1995 to 2000 was a direct result of the massive Internet Tech Bubble, while the period from 2011 to recent highs was a direct result of massive Quantitative Easing (QE). Both these developments temporarily saved the world from a more serious stagnation period.
- Covid-19 launched another period of extraordinary fiscal stimulus that the DJI:Gold ratio suggests is currently absorbing and trying to “work-off”.
- We are at a critical point of key levels of both support and overhead resistance trend channels.
- It appears that there will be a period of 18-24 months before this consolidation is resolved.
- Though the ratio may not move dramatically during this period, it does not mean that both the DJI and Gold will not rise concurrently during the DJI:Gold ratio period. This would support our thesis that markets may experience new highs or a double top over this 18-24 month period. (See chart below in the “Current Market Perspective” section).
The two charts below strongly suggest that Inflation pressures may soon subside. This in no way suggests Inflation is going away but rather market focus may temporarily shift, possibly to disinflationary moves or deflationary pressures from a recession. This period could possibly allow the chart above to complete its current consolidation period before heading lower with markets falling and then gold being a strong investment.
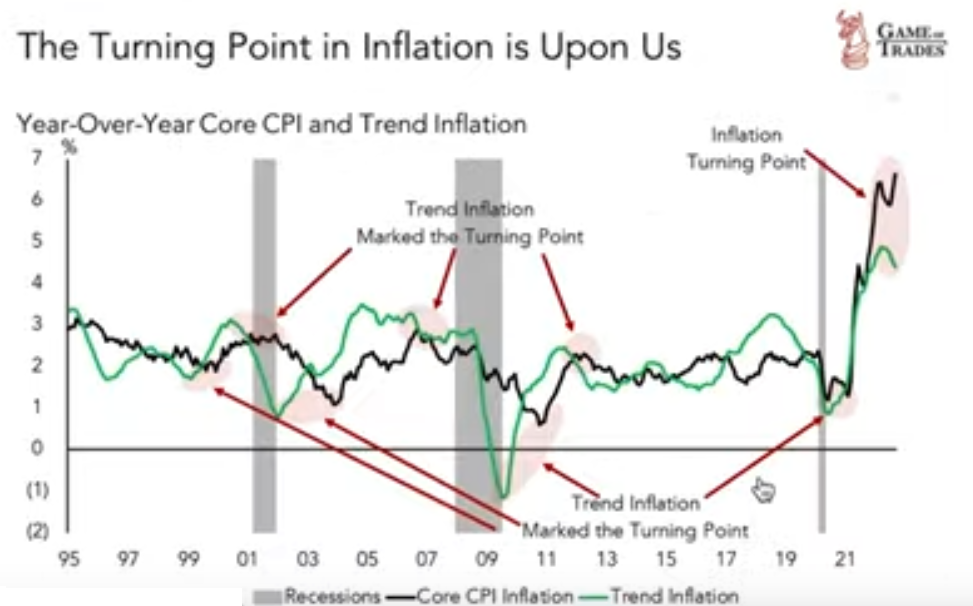
Inflation pressures appear to be reaching a point of topping and consolidation. This could lead to a longer period of higher inflation than we have been accustomed to. Maybe +4% or even 5%?
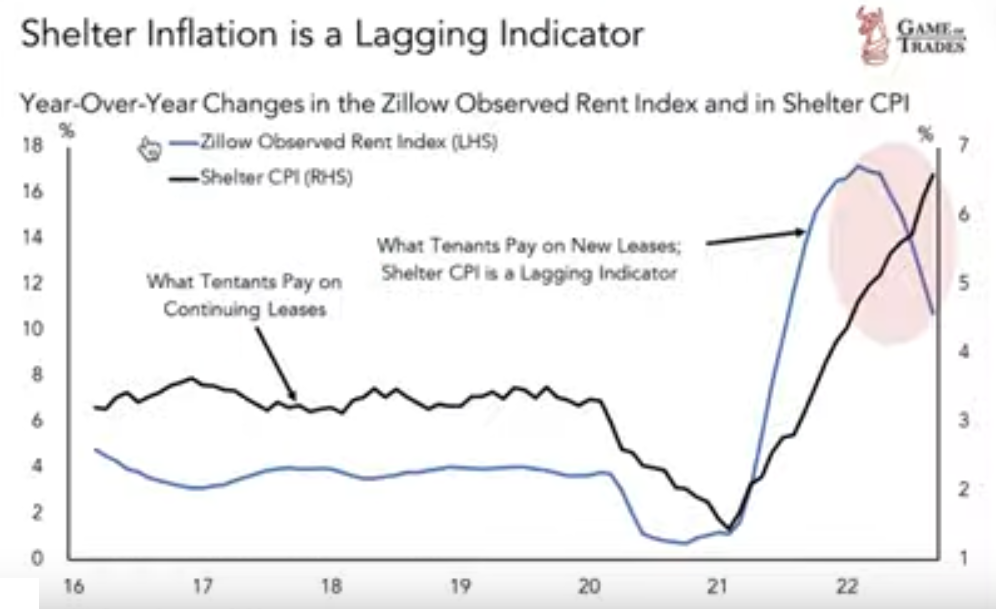
Shelter costs may soon begin a period of consolidation. Owner Equivalent Rent should fall, since housing prices have become unaffordable while mortgage rates have become exploded higher.
THE KEY RALLY TECHNICALS
Below we isolate the individual charts for the DJI:Gold Ratio.
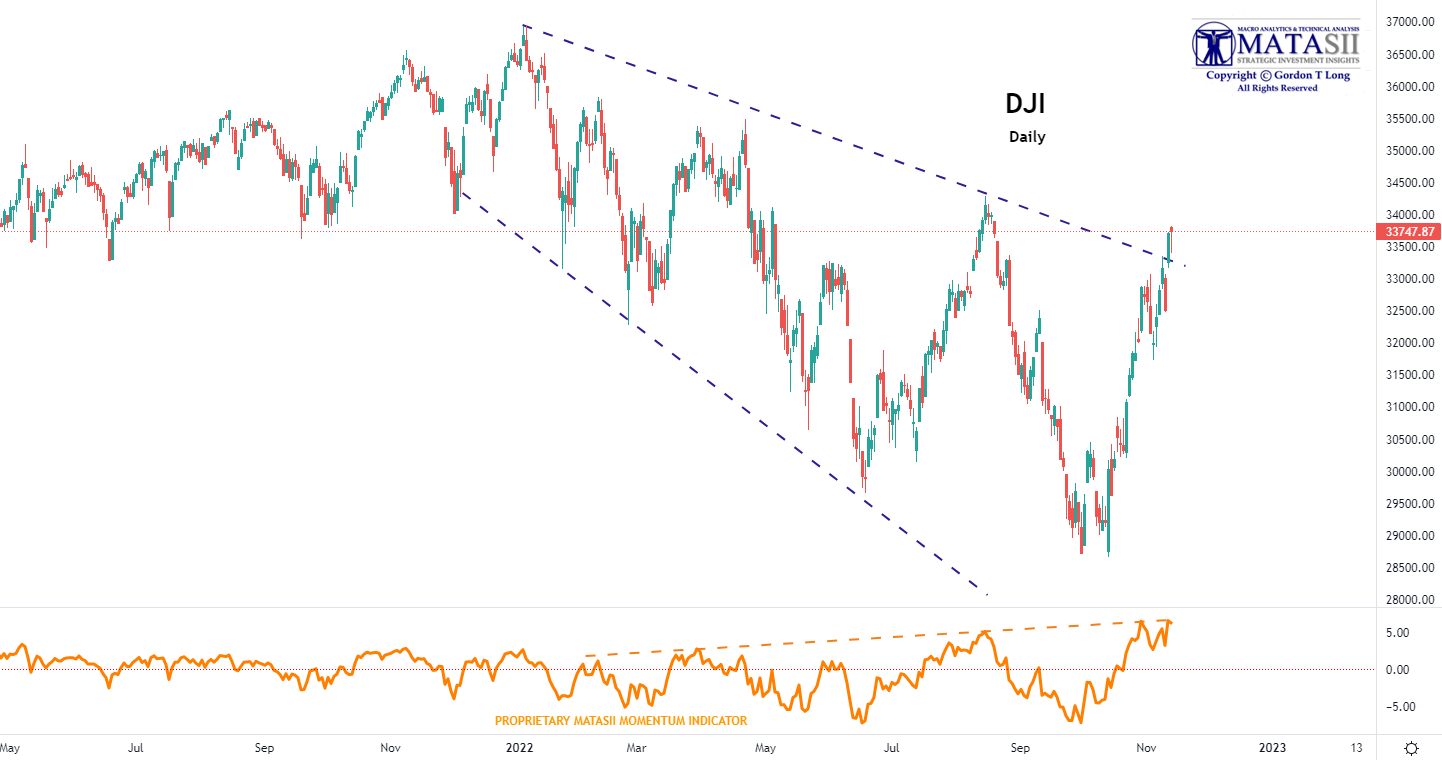
DOW JONES INDUSTRIALS
-
- The DJI surged to and then marginally broke its long term downward trend line.
- However, we then see (in the lower panel) that it has reached The MATASII Proprietary Momentum Indicator. We have found this to be an extremely powerful tool and should not be ignored.
- Our view is the CPI spike in equity markets will now face a near term period of consolidation.
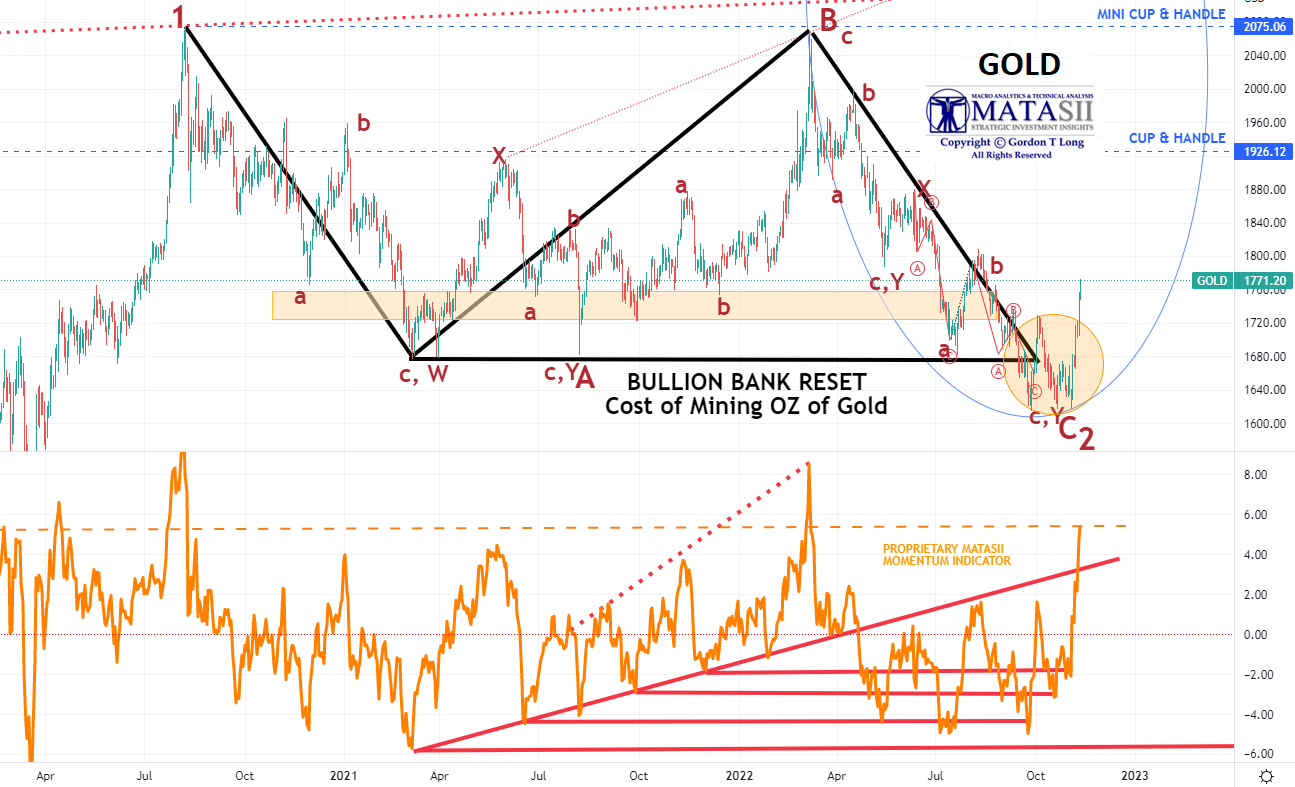
GOLD
-
- The surge in Gold from the CPI release will soon retrace some of its significant price increase.
- The MATASII Proprietary Momentum Indicator suggests the CPI driven price rise in gold has been over-done.
- The important news is that it appears that Gold has established an Intermediate Term support low.
CONCLUSION
YELLEN HAS BEGUN DELIVERING
We specifically highlighted in our last newsletter what Treasury Secretary Yellen needs to do and is likely to soon undertake:
“She needs to more aggressively operate in the off balance sheet world of derivative. There is little doubt that is already occurring, but she is likely to be forced to take it to another level.”
We have witnessed with the massive surge in cross markets both domestically and globally that Treasury Secretary Janet Yellen has begun delivering on what we suggested she was likely to do!
We said:
YELLEN’S LIKELY FOCUS REQUIRES:
-
- On-Balance Sheet Implementation of a US Treasury “Operation Twist” (see our last newsletter for details),
- Off-Balance Sheet Operations
-
-
- Use of $84B PPT assets and pledged US Treasury collateral to fund massive interventions in the global derivatives market.
- Massive increases in the use of swaps and contingent liabilities to stop cascading defaults (including those associated with the US Fiscal Gap guarantees).
-
 A FALSE DAWN
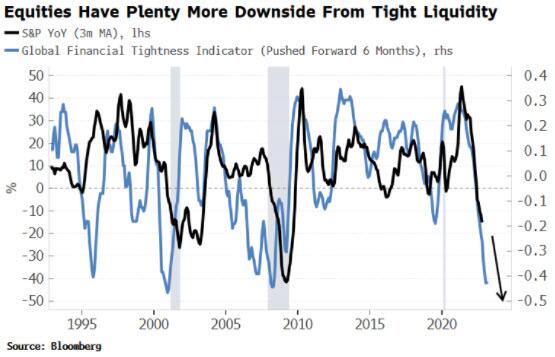
A Fed reversal could happen more quickly than the market expects. Either way, equity investors should treat it as the false dawn it is. Firstly, financial conditions continue tightening for about five quarters after the first Fed hike. In the current cycle this would take us until the second half of 2023. Secondly, there’s a still greater squeeze in liquidity to come. The Global Real Policy Rate is still extremely negative and close to the all-time lows of -6% it reached in 1974, before it rose all the way to +3% by the early 1980s. Today it is at -4.4%, barely above its -5.6% nadir.
Overall, global financial conditions, as measured by the Global Financial Tightness Indicator, remain very restrictive, with no respite on the horizon. This will remain a poor environment for equities and other risk assets. Stocks may find themselves flipping from the inflation frying-pan into the recessionary fire (as the monetary easing the market has so desperately yearned for) sets the stage for a new act which promises to bring yet more misery.
THE WORST IS STILL IN FRONT OF US,
EXPECT ANOTHER SHORT TERM BEAR MARKET COUNTER RALLY ,
FADE THE UNFOLDING COUNTER RALLY – SELL THE RIPS.
THE MATASII.COM PARABOLIC MODEL OUTLOOK IS SIGNALING A POSSIBLE NEW INTERMEDIATE TERM MARKET HIGH
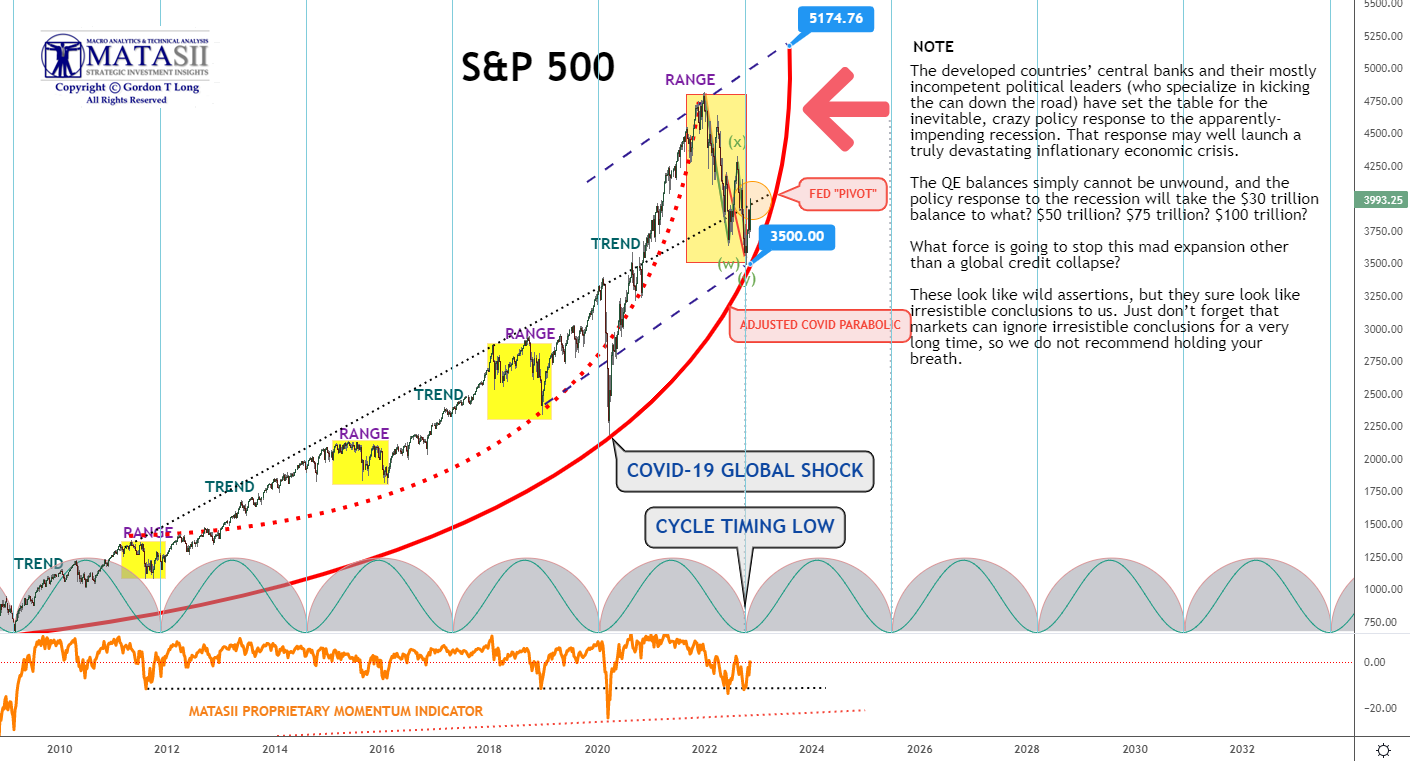
YOUR DESK TOP / TABLET / PHONE ANNOTATED CHART
Macro Analytics Chart: SUBSCRIBER LINK
FAIR USE NOTICE This site contains copyrighted material the use of which has not always been specifically authorized by the copyright owner. We are making such material available in our efforts to advance understanding of environmental, political, human rights, economic, democracy, scientific, and social justice issues, etc. We believe this constitutes a ‘fair use’ of any such copyrighted material as provided for in section 107 of the US Copyright Law. In accordance with Title 17 U.S.C. Section 107, the material on this site is distributed without profit to those who have expressed a prior interest in receiving the included information for research and educational purposes. If you wish to use copyrighted material from this site for purposes of your own that go beyond ‘fair use’, you must obtain permission from the copyright owner.
NOTICE Information on these pages contains forward-looking statements that involve risks and uncertainties. Markets and instruments profiled on this page are for informational purposes only and should not in any way come across as a recommendation to buy or sell in these assets. You should do your own thorough research before making any investment decisions. MATASII.com does not in any way guarantee that this information is free from mistakes, errors, or material misstatements. It also does not guarantee that this information is of a timely nature. Investing in Open Markets involves a great deal of risk, including the loss of all or a portion of your investment, as well as emotional distress. All risks, losses and costs associated with investing, including total loss of principal, are your responsibility.