Gordon T Long
Global Macro Research | Macro-Technical Analysis
MATA
RISK
“TOLL BOOTHS” NEAR COMPLETION
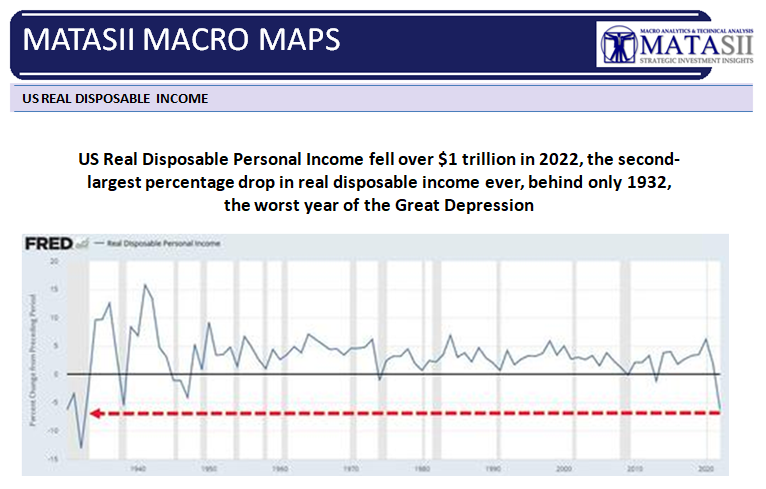
Perhaps most troubling to me currently is the precipitous drop in real disposable income, which fell over $1 trillion in 2022. For context, this is the second-largest percentage drop in real disposable income ever, behind only 1932, the worst year of the Great Depression (chart below).
To keep up with inflation, consumers are depleting their savings and burning through the “stimulus” checks they received during 2020 and 2021. Credit card debt continues to grow, while savings plummeted $1.6 trillion last year, falling below 2009 levels.
=========
WHAT YOU NEED TO KNOW
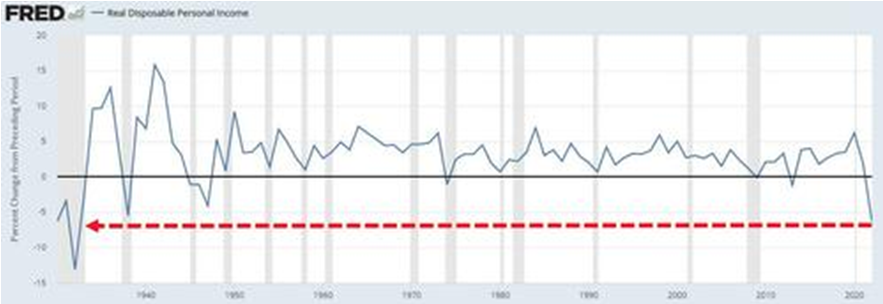 This shocking chart is extracted from the Federal Reserve’s own FRED site. I failed to hear Fed Chairman Jerome Powell even allude to it in his recent FOMC press briefing. Even more alarming is that the almost economic illiterate media failed to ask him about it!
- CONCURRENT INFLATION & DEFLATION?
-
- DEFLATION in what you FINANCE and WANT (Desire),
- INFLATION in what you PAY (Every time you pull out your wallet – Cash & Credit Card) and NEED (To Survive),
- THE “BRIDGE”: Revolving Credit (Your Credit Card) is the bridge and it is breaking!
- A TOLL BOTH: The Bridge you have been increasingly dependent to do everything with!
- THE “TOLL BOOTHS” NEAR COMPLETION
-
- There are certain expenses you just can’t cut when inflation happens. They are hard stops with no realistic alternatives. They are called a “Gotcha” by those who have you trapped.
- The commonality of these costs is considered “Unsecured”. They are all actually secured through “Wage Earnings” versus Collateral versus Guarantees. When income falls these Bank or Government claims become immediate “Cash” grabbers.
-
-
- Rising Credit Card Charges – Fed taking Up Rates to Fight Inflation – Government spent money it didn’t have, caused inflation and now you pay for it, not only in everything you buy but through your “What you need” card.
- Rising Utility Bills – Government controlled pricing is being driven by government driven inflation.
- Government Fees, Licenses, Assessments & Penalties – Leaving Federal & State Income Taxes and Property Taxes out we face arbitrarily government set charges.
-
- EXPECT CONTINUED ELEVATED INFLATION
- ENERGY
-
-
- The only inflationary data that has dropped is in the energy space (that and used cars).
- The only reason energy prices have dropped is because a) China was in lockdown for Zero Covid and b) the Biden administration dumped 250 million barrels of oil onto the market.
- Both a) and b) are over. China has reopened and the Biden admin has already depleted the U.S. emergency stash of oil by 40%.
- The markets are confirming this, with both oil and gasoline prices bottoming in the last two months.
-
-
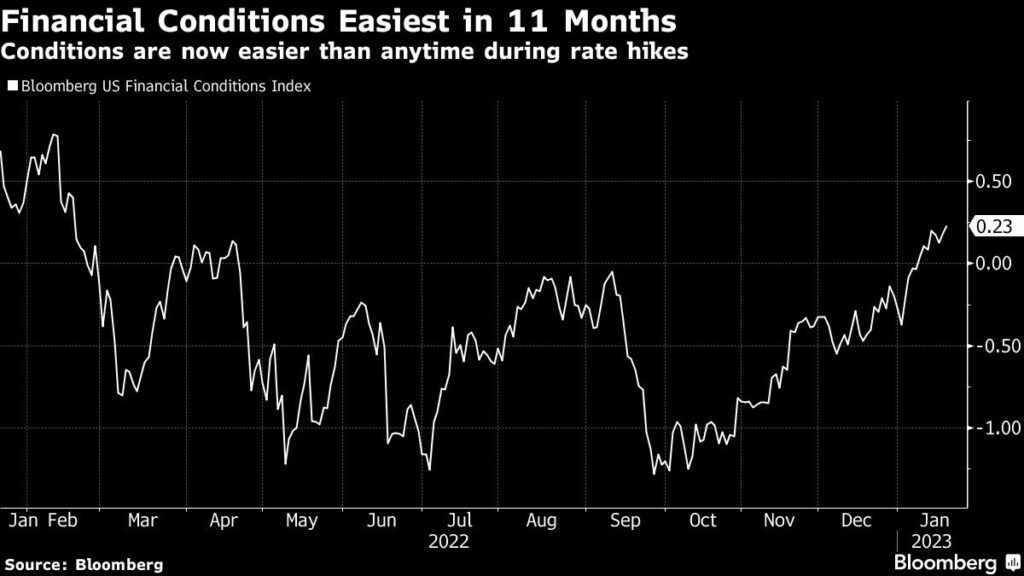
- FINANCIAL CONDITIONS INDEX
- Financial Conditions are now the easiest they’ve been in nearly a year. To put that into perspective, it means financial conditions are back to where they were BEFORE the Fed ended QE and began raising interest rates.
- GOVERNMENT SPENDING
- Since the pandemic ended in June 2020 both the Trump and the Biden administrations continued to spend at a pace FAR exceeding the historic trend. Some $20 TRILLION, or roughly 87% of U.S. GDP.
- We’re talking about $20 trillion in ABOVE-trend spending by the government.
- The Fed can raise rates and shrink its balance sheet all it wants. It won’t accomplish much while the government is pumping an extra $1+ TRILLION in above-trend spending into the economy every single year.
- FINANCIAL CONDITIONS INDEX
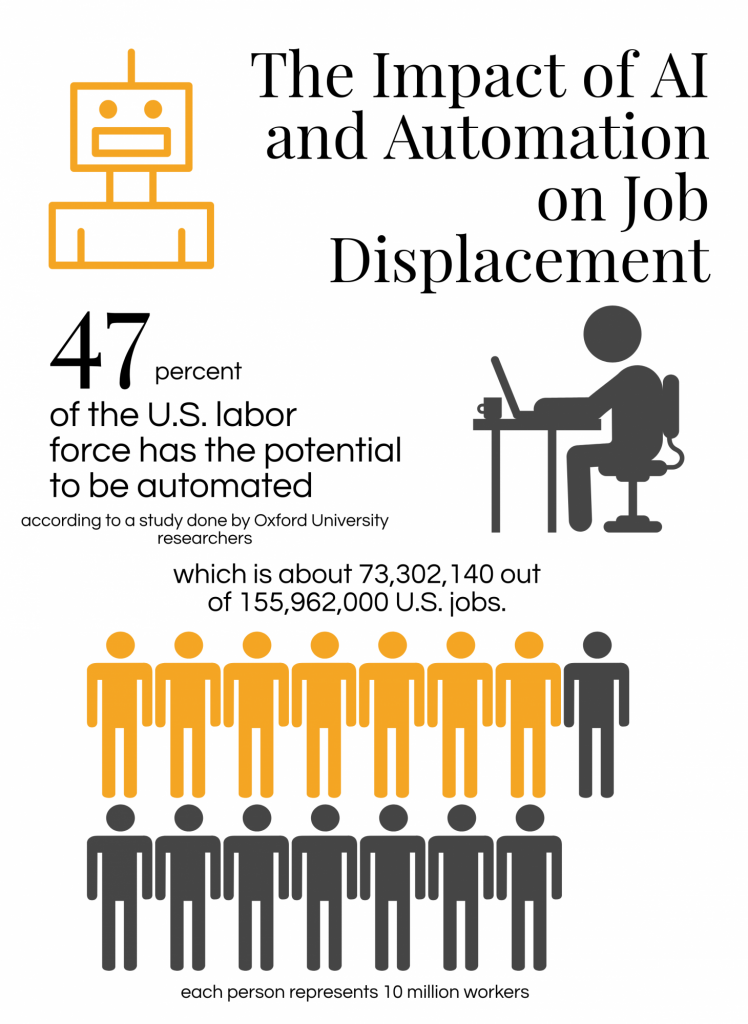
- ChatGPT, AI & ROBOTICS SHOCK NEAR AT HAND
-
- A New Paradigm Shift is about to occur as AI and Robotics merge with new technologies like ChatGPT.
- The recent Wage Spiral is likely to soon stall as many jobs are exposed to new paradigm technologies.
-
- CONCLUSION
-
- CAPTURE RISK – DON’T ASSUME IT!
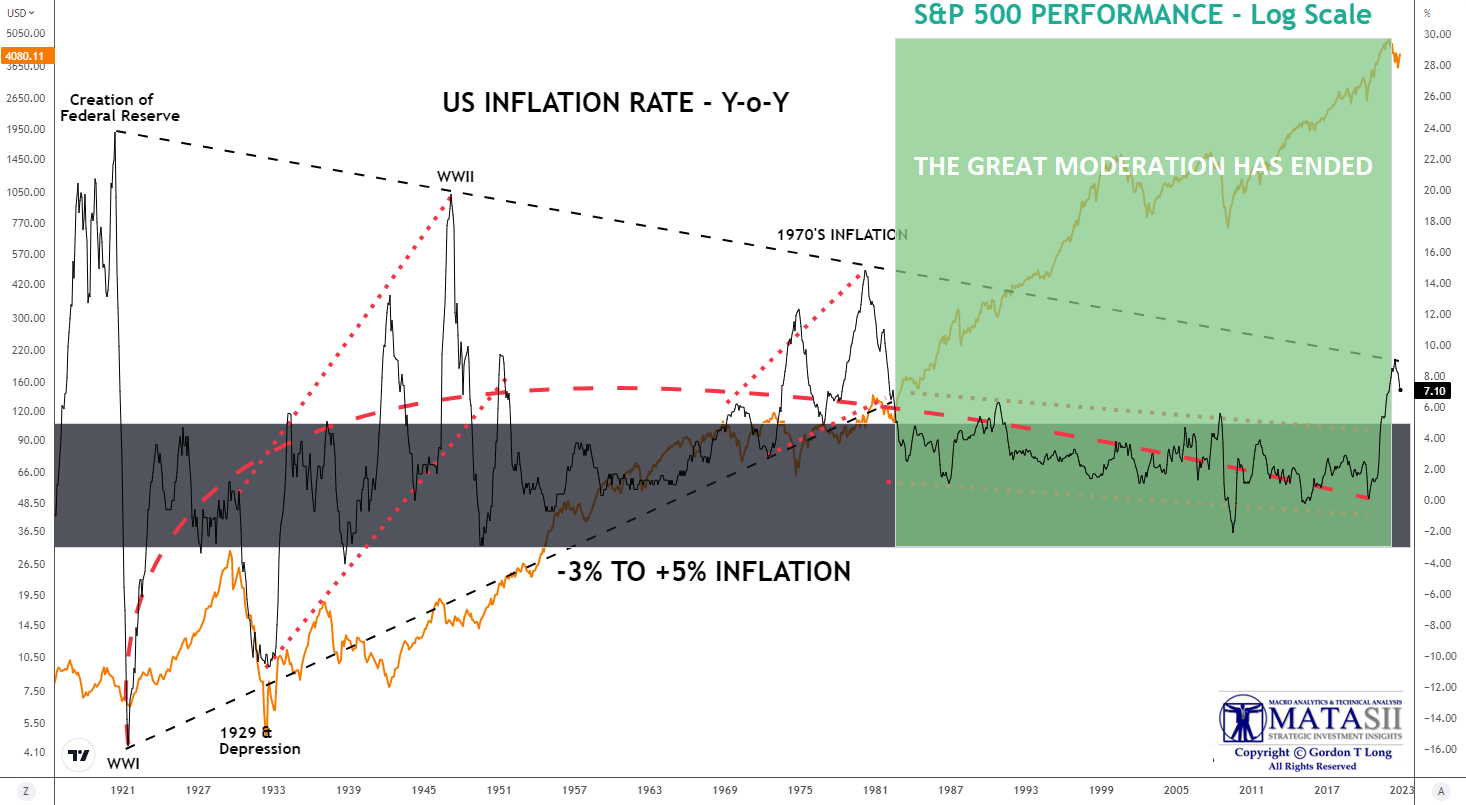
- The spike of Inflation above a sustained 5% level (Great Moderation chart above) as well as the current historical low pricing of risk suggested by the spread between US BBB Corporate Rated Bond Yields and the US 90 day T-Bill Yield are evidence that a more appropriate pricing of risk is ahead of us.
-
The fully expected and overdue recessionary deflationary scare is soon to arrive in H2 2023.
=========
HOW MUCH MORE PAIN CAN THE US CONSUMER TAKE?
As consumers continue depleting cash reserves and borrowing costs are rising, the growth in consumer spending will keep slowing. Since that accounts for roughly two-thirds of GDP, this doesn’t bode well for the economy. We explore this below.
Just how much pain is the consumer feeling? The average family has lost about $6,000 in annual purchasing power under current US Public Policy, because prices have risen so much faster than wages. Higher interest rates have increased annual borrowing costs by $1,400, so that the average family effectively has $7,400 less in their annual budget.
But that’s just the average. Someone trying to buy a median priced home today will have a monthly mortgage payment that is 80 percent higher than when Biden took office. That means spending an extra $9,500 a year for the same house. It’s no wonder people are financially strapped and taking on second or third jobs in this economy.
Meanwhile, federal nondefense spending grew 11.2 percent in the fourth quarter, another example of politicians feeding the federal budget while starving the family budget.
If you’ve ever driven a car that ran out of gas, you may have noticed the engine rev up right before stalling out. That seems to be what we are witnessing with the economy—an engine running on fumes, about to stop.
It is becoming increasingly obvious we might want to consider following the winning formula laid out by President Ronald Reagan and Fed Chair Paul Volcker, which brought the economy back from the grip of stagflation in the 1970’s. President Ronald Reagan scaled back government while Volcker stopped the monetary manipulation and allowed interest rates to seek their natural level.
Will this happen? No it won’t! Instead you can be assured we will only continue to expand money supply.
THE WORST SINCE HEIGHT OF THE GREAT DEPRESSION IN 1932
TIGHTENING CONSUMER CREDIT
With credit payment delinquencies rising, banks’ loan officers are now tightening consumer credit quickly.
Residential investment fell off a cliff, dropping 26.7 percent as consumers were unable to afford the combination of high home prices, high interest rates and falling real incomes. No wonder homeownership affordability has fallen to the lowest level in that metric’s history.
But the growth in inventories, which accounted for half the GDP growth in the fourth quarter, is not a good sign, either. It is the result of businesses being unable to sell off existing inventories at current prices. Liquidating that inventory at discounts will mean lower profits, a further drag on future growth.
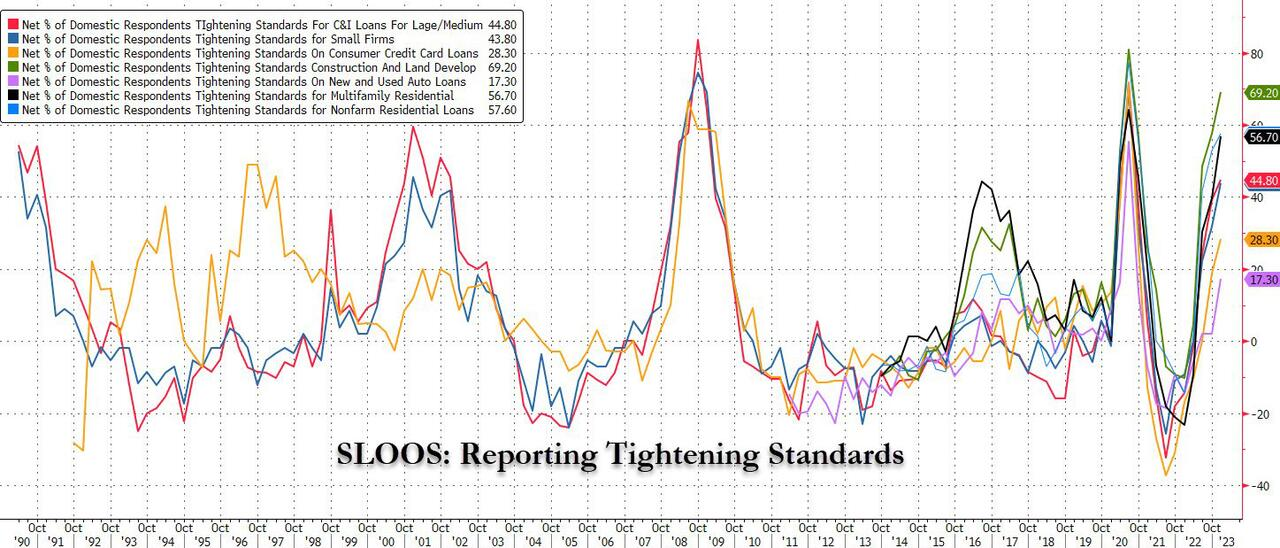
SLOOS = Senior Loan Officer Opinion Survey (specifically to Bank Lending Practices)
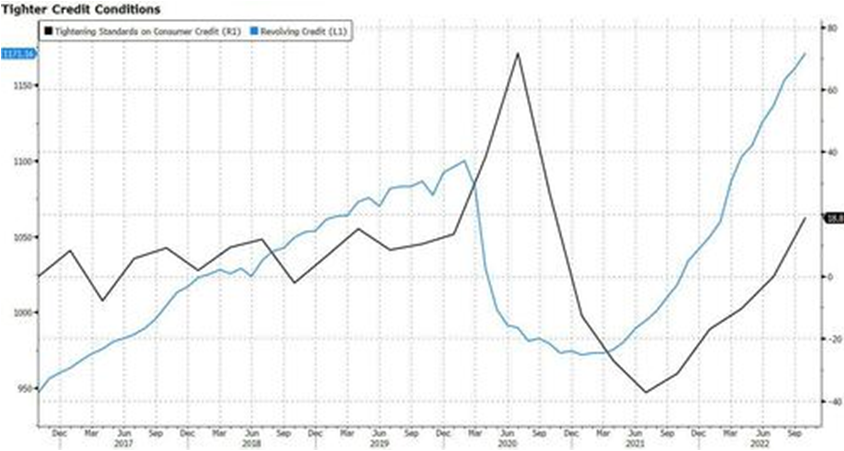
As revolving credit (credit card debt) exploded higher (turquoise line), Consumer Credit has been steadily tightened (black line).
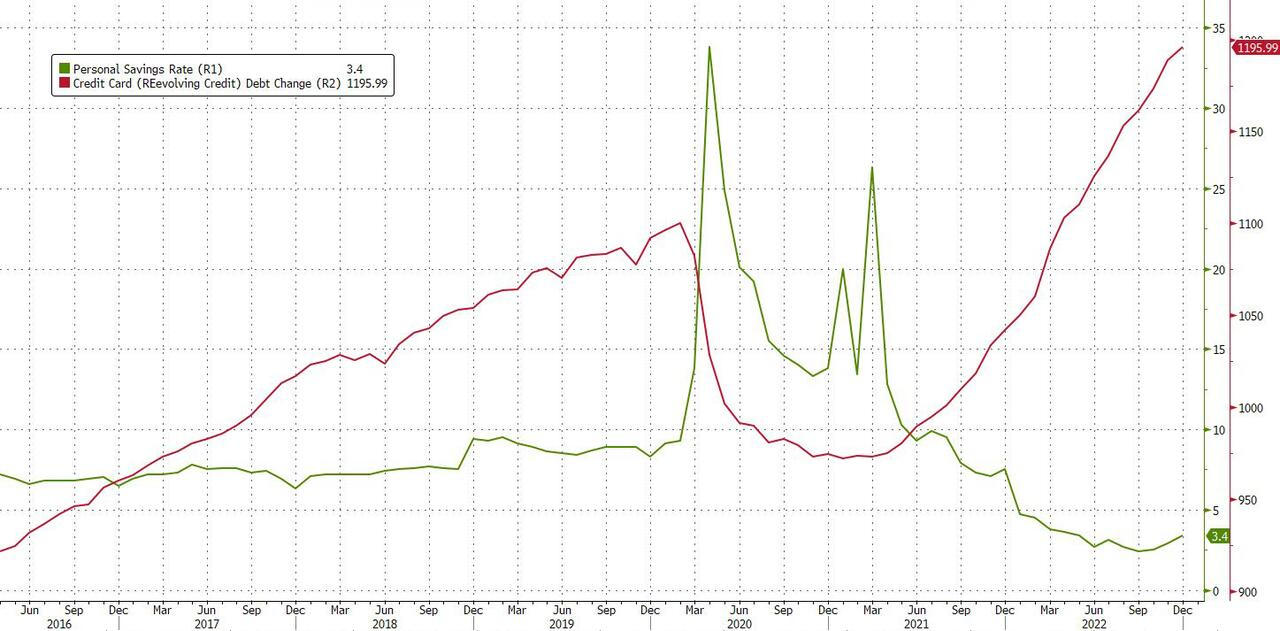
US savings (especially excess covid savings) were spent long ago and flatlined near record lows in recent months. It has all been up to credit cards and other sources of (repurposed) credit – like pretending one’s student loans are actually going to studying when instead they were used to buy iPhones, TVs, booze and only fans subs.
THE “TOLL BOOTHS” NEAR CONSTRUCTION
THE GREAT DEPRESSION & “DIRTY THIRTIES”
I have two vivid economic recollections as a youngster growing up in the prairie fields of Saskatchewan! My grandfather’s stories of surviving the Great Depression and the realities of the nearby town that was nearest us. Both resonate with me as the daily economic and financial developments unfold in front. Maybe there is something in his wisdom that holds true for today’s environment?
MY GRANDFATHER
My grandfather had no formal education, fought in the trenches throughout WWI and immigrated to Canada on the promise of 160 acres of land on the frontiers of Canada. He lived in a self constructed sod shack in -30F winters as he slowly cleared the land to gain rightful ownership. No funding, no guarantees just a dream. As he grew his farm the Great Depression and “Dirty Thirties” arrived. It was devastating but he and my family survived and continued to prosper as those around him lost their land, livelihoods and way of life as the “eastern” banks foreclosed on them.
My grandfather stressed with me to never trust banks. “They talk nice to entice you to borrow, to grow and proper, then they take everything the moment the storm clouds threaten. Unless you expect storms to stop occurring, never trust a bank as suddenly they are a bigger problem than the storm!”. Sage advise?
My grandfather prospered as everything failed around him. He had a reputation of always being around to help fellow farmers when the banks were squeezing them. He offered to help with his labor or often by taking a horse they could not feed nor keep before it died. He always gave money for the horse and people laughed because his money always smelled “mildewy” like it had just came out of the ground. When he died during WWII as my father was fighting in Europe, it was discovered how wealthy my grandfather was. It turned out he was bringing the horses back to health and shipping them to growing eastern cities (by the box car load) to pull ice and milk carts.
Lesson:
-
- Cash is King – Credit is Serfdom when times are tough.
Action:
-
- You need to decide if there are storm clouds on the horizon? If so, are you prepared?
SMALL TOWN SASKATCHEWAN
The town closest to the family farm was the same as were seen all across the prairies of western Canada when I was growing up in the 1950’s.
The Grocery & Hardware store was the “Coop” (The Cooperative),
The Bank was the “Credit Union”
The Grain Elevator where you sold your crop was the “Wheat Pool”.
What do they all have in common? They were all owned by the famers who learned some hard lessons during the Great Depression! Reduce your exposure to people who don’t understand nor care about your plight! Westerns never wore Blue Suits (for decades), as they were the “cloth” of eastern bankers!
HISTORY DOESN’T REPEAT BUT IT OFTEN RYHMN!
YOU DON’T OWN A FARM TODAY BUT YOU HAVE A SIMILAR EXPOSURE!
As my father fought Fascism (Mussolini’s merger of Government and Corporations) in Europe during WWII, I am sure he would be warning me now about the worrying control Governments and Banks have constructed around us.
Specifically, as governments in an almost unrestricted fashion print money which has launched Inflation pressures not seen since the Vietnam War was charged to the country’s credit card, President Lyndon Johnson’s Great Society financial shock and OPEC raised prices for a weakening and distrusted US$. Sound familiar?
Today’s problems are centered around what I will call collapsing real disposable income versus non-discretionary spending! Your spending needs are in the hands of the Government and Banks!
- There are certain expenses you just can’t cut when inflation happens. They are hard stops with no realistic alternatives. They are called “Gotcha” by those who have you cornered:
-
- Rising Credit Card Charges – Fed taking Up Rates to Fight Inflation – Government spent money it didn’t have, caused inflation and now you pay for it not only in everything you buy but through your “What you need” card.
- Rising Utility Bills – Government legislated pricing is being driven by government driven inflation.
- Government Fees, Licenses, Assessments & Penalties – Leaving Federal & State Income Taxes and Property Taxes out we face arbitrarily government set charges.
- The commonality of these costs considered “Unsecured”, are all actually secured through “Wage Earnings” versus Collateral versus Guarantees. When income falls, these Bank or Government claims become immediate “Cash” grabbers.
Will you be able to handle these as they explode higher? If not, what will you lose? Maybe not a farm, but you will lose something – especially if Inflation stays with us and / or you lose your job!
Let’s consider some reality of both – First Inflation, then Job losses!
EXPECT CONTINUED INFLATION
It seems no one actually reads anymore! Everyone simply trumpets headlines, or retweets articles, without looking at the data.
The latest and most glaring example of this is the claim that “inflation has peaked.” Everywhere you look in the media (and on social media), people repeat this statement as if it is a fact. It is not. Inflation has not peaked, and the data confirms this.
ENERGY
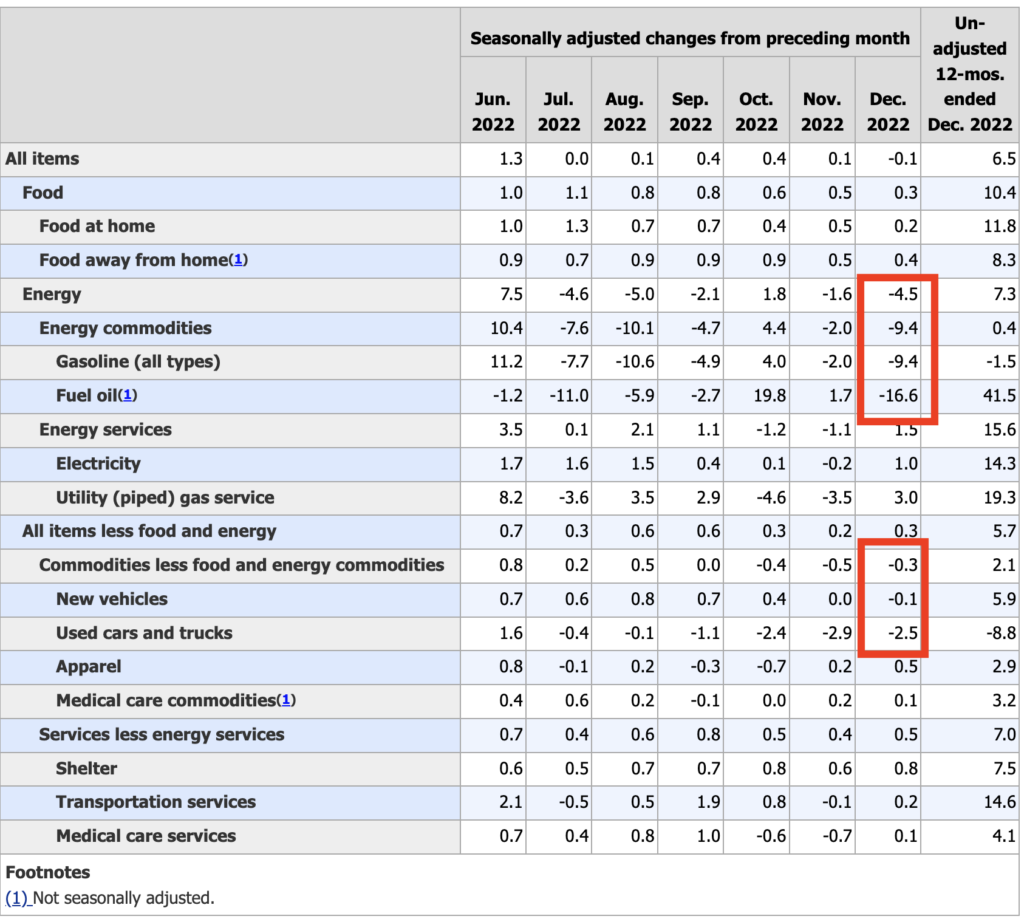
Almost ALL of the drop in inflation data has come from energy prices falling. Energy prices have fallen because the Biden administration dumped over 250 MILLION barrels of oil from the Strategic Petroleum Reserve (SPR).
To put this into perspective, it’s nearly 40% of the SPR. The Biden admin dumped it in the span of less than two years. THAT is why energy prices dropped, which accounts for almost ALL of the drop in inflation data.
See for yourself. Outside of the drop in energy prices, the only significant drop in prices occurred in used car vehicles. Everything else is still RISING in price year over year.
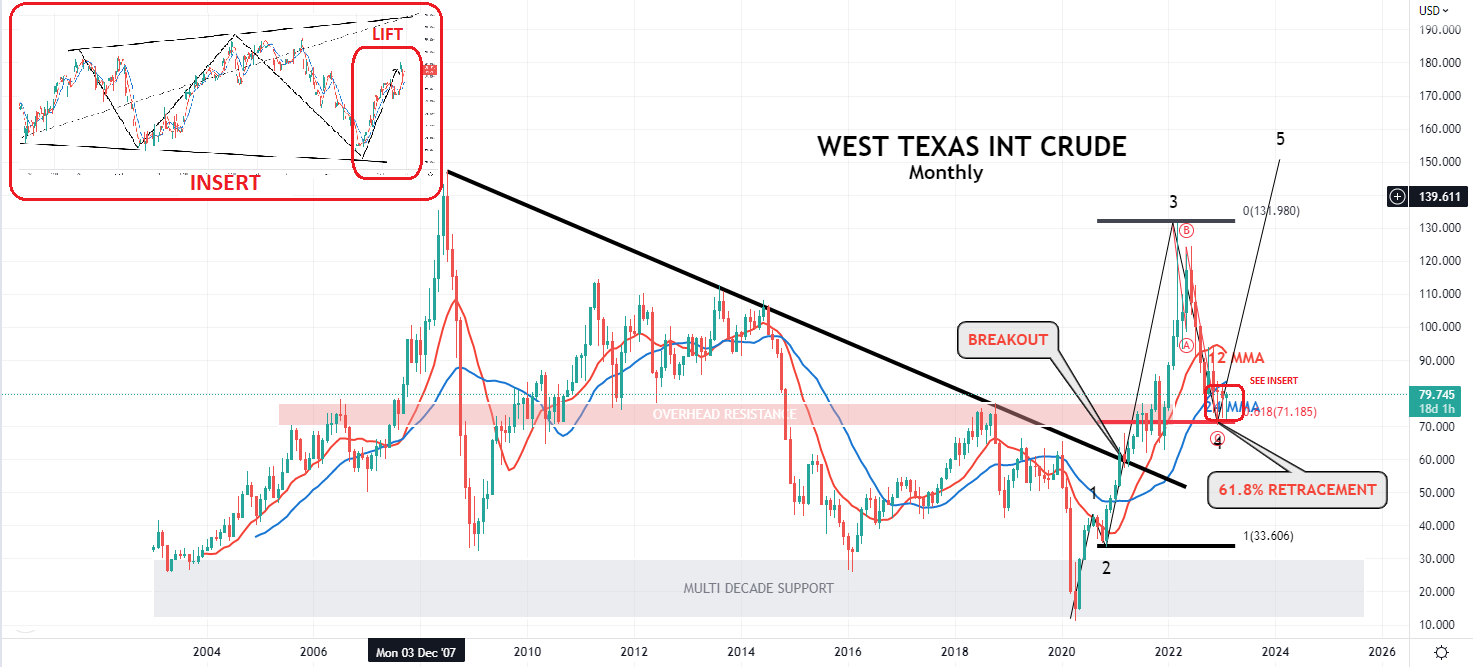
bring all of this up because now that the Biden administration is no longer dumping tens of millions of barrels of oil on the open market, energy prices are bottoming.
Oil has bottomed and is starting to turn up (See Insert below).
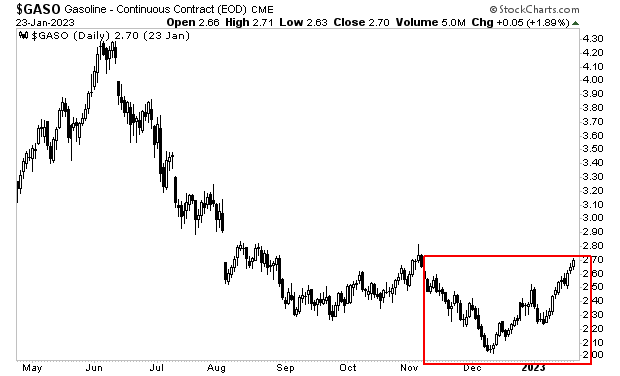 The situation is even uglier for gasoline (right).
So, unless President Biden wants to empty the SPR to zero, this “inflation has peaked” narrative is over. Inflation is coming back in a big way. And NO ONE is positioned for it.
- The only inflationary data that has dropped is in the energy space (that and used cars).
- The only reason energy prices have dropped is because a) China was in lockdown for Zero Covid and b) the Biden administration dumped 250 million barrels of oil onto the market.
- Both a) and b) are over. China has reopened and the Biden admin has already depleted the U.S.’s emergency stash of oil by 40%.
- The markets are confirming this, with both oil and gasoline prices bottoming in the last two months.
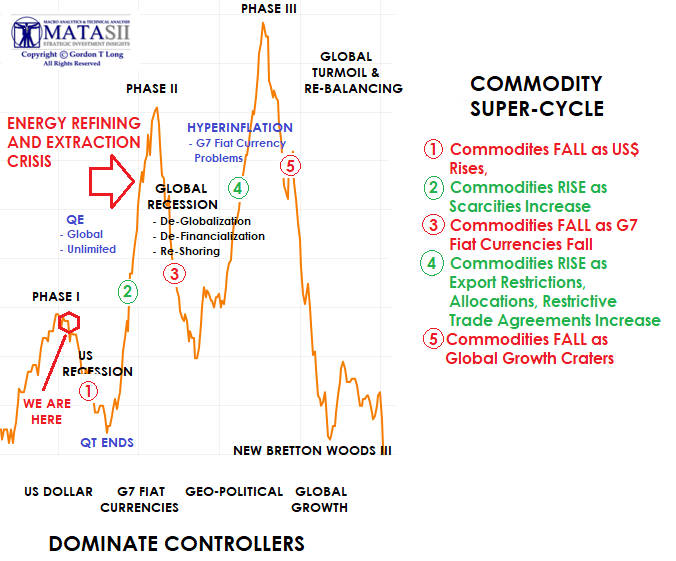
BELOW: We have ended Phase I and are in Leg 1 down with Energy easily able to diverge from other commodities during Wave 1 down.
FINANCIAL CONDITIONS INDEX
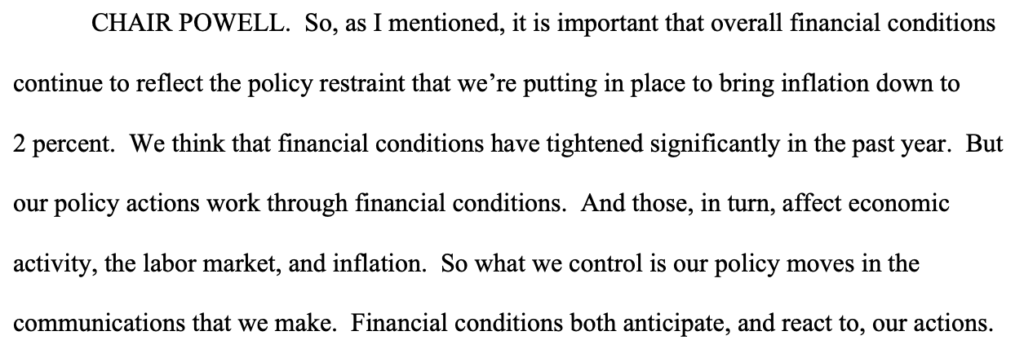 Fed Chair Jerome Powell has stated multiple times (most recently on December 14th 2022) that the Fed focuses on financial conditions. See for yourself (RIGHT).
With that in mind, it’s worth noting that financial conditions are now the easiest they’ve been in nearly a year. To put that into perspective, it means financial conditions are back to where they were BEFORE the Fed ended QE and began raising interest rates (BELOW).
This confirms that inflation is not gone in any meaningful way. If anything, we’re in the midst of a resurgence courtesy of energy prices and loose overall Financial Conditions (other than tighter Consumer Credit who’s credit is suspect because it depends on exposed collateral and the expectations of keeping their job – more on that in a moment).
STOP THE SPENDING!
If you want to find out what is causing inflation… and why it won’t be going away anytime soon no matter what the Fed does, look no further than the below chart from the Federal Reserve itself. This is a chart of government spending since 2013. As you can see, government spending was in a clear trend right up until the pandemic, at which time it went absolutely bonkers.
h/t to Graham Summers – Gains, Pains & Capital
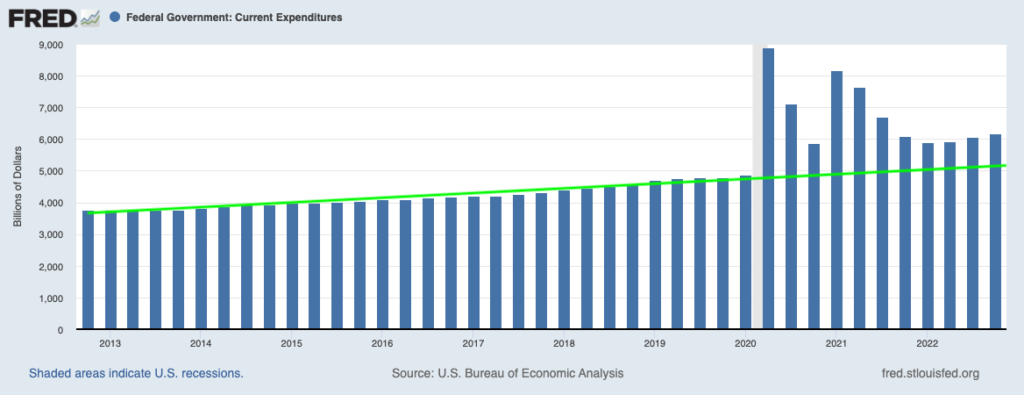
Now, according to the economic data, the recession triggered by the pandemic ended in June 2020. And yet, both the Trump and the Biden administrations continued to spend at a pace FAR exceeding the historic trend.
How much exactly?
Some $20 TRILLION, or roughly 87% of U.S. GDP.
Bear in mind, we’re not talking about $20 trillion in total spending… we’re talking about $20 trillion in ABOVE-trend spending by the government.
Even worse, there is no sign that this above-trend spending is slowing down. If anything, it’s starting to accelerate again.
So, the Fed can raise rates and shrink its balance sheet all it wants. It won’t accomplish much while the government is pumping an extra $1+ TRILLION in above-trend spending into the economy every single year.
And rest assured, this spending isn’t going into productive endeavors. It’s going into paying people not to work, boondoggles, and various inflationary schemes.
Want to end inflation? Stop overspending and printing money. It’s really quite simple.
A NEW ERA OF JOB PRESSURES
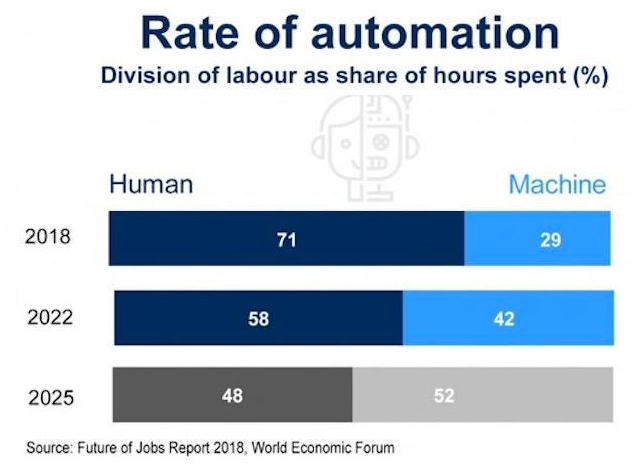 Corporations faced with an inflation driven wage price spiral, slowing sales and margin pressures need a more encompassing answer than just layoff employees. Employees levels are already thin and this is why I have been stressing that today it is more about the percentage of the total population corporations are laying off. But that is still not the answer as they have long ago taken out “the fat” in their relentless job cuts and are now cutting into “the bone”. The concurrent problem CEO’s are facing is that productivity is also plummeting! They are increasingly desperate to endorse almost any solution.
A NEW PARADIGM IS ABOUT TO HAPPEN AS ChatGPT GIVES A GLIMPSE OF WHAT IS AHEAD
 OpenAI has trained and launched a free model called ChatGPT which interacts in a conversational way. In its early free release it already has over 100 Million subscribers!
The dialogue format makes it possible for ChatGPT to answer follow-up questions, admit its mistakes, challenge incorrect premises, and reject inappropriate requests. ChatGPT is a sibling model to InstructGPT, which is trained to follow an instruction in a prompt and provide a detailed response.
ChatGPT can generate speeches, songs, marketing copy, news articles and student essays. It is currently free for people to use in Beta form. Experts suggest that the AI chatbot has the ability to replace Google search in the future. How many job rich service industries such as writers, graphic artists, financial analysts … and the list goes on … will be replaced? Let your imagination go with this one!
One of the applications of AI chatbot is its ability to write codes and help developers in solving coding-related problems. Using OpenAI’s language model to write Python code for geo-data science, programmers have realized that it can give responses using text so you can actually ask it to write code as well. This is available already with still early Beta releases.
ChatGPT appears good at producing short blocks of code. It might be able to create a function that you can use to do something specific within your software application. But in reality it is not going to suddenly be a threat to programmers tomorrow or even possibly in the next few years – but it is coming!

CONCLUSION
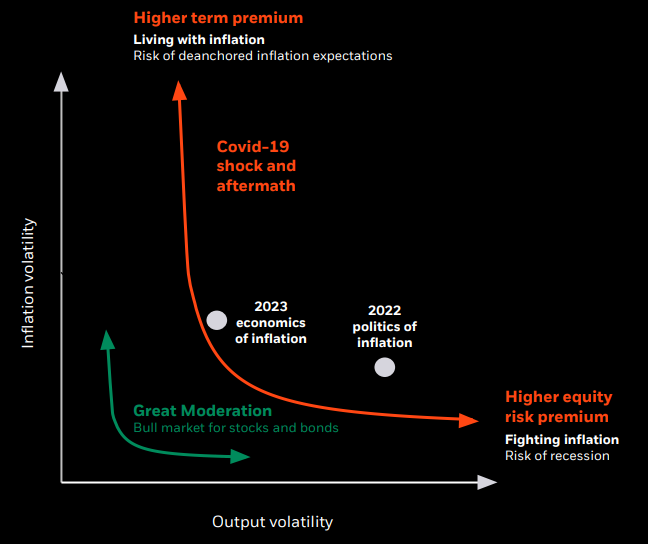 We have come to the conclusion we are in the midst of a structural shift in the pricing of Risk! Signs of that shift are all around us as we see it is bond yields, spreads, equity valuations, lending rates and even the pricing of lending (valuing of income , collateral and guarantees).
That shift is being driven by three primary changes as the great moderation comes to an end.
DRIVERS OF THE PRICING OF RISK:
We should expect a change of rate, and potential reversal, of each of the long term drivers of the global economy & financial markets.
CHART TO THE RIGHT Shows the expected results of these structural changes (more in this month’s video)
THE GREAT MODERATION
1-GLOBALIZATION: Reduced Costs
-
-
-
- LABOR ARBITRAGE, CHEAP COMMODITIES
-
-
2-FINANCIALIZATION: Reduced Rates & Looser Financing
-
-
-
- FALLING RATES SINCE 1980 to ZERO BOUND
-
-
3-MERCANTILISM: Reduced US Bond Rates (Global Risk Benchmark)
-
-
-
- HIGHER VALUED US $$$ – ENGINEERED CONSUMPTION
-
-
CYCLICAL v STRUCTURAL v SECULAR
These changes are Structural in nature.
CYCLICAL: A repeating oscillating pattern
STRUCTURAL CHANGE
-
- A change in the rate of Trend of the Cyclical pattern either up or down, or
- The change of Amplitude of the Cyclical pattern, or
- The change of Frequency of the Cyclical pattern, or
- A change in the rate of a trend or the rate of change of either cyclical or secular pattern.
SECULAR: A trend that is likely to continue moving in the same general direction for the foreseeable future.
-
-
- A lasting change in the Cyclical pattern,
- A new Pattern of performance
-
We have a STRUCTURAL CHANGE underway!
The spike of Inflation above a sustained 5% level (Great Moderation chart above) as well as the current historical low pricing of risk suggested by the spread between US BBB Corporate Rated Bond Yields and the US 90 day T-Bill Yield are evidence that a more appropriate pricing of risk is ahead of us.
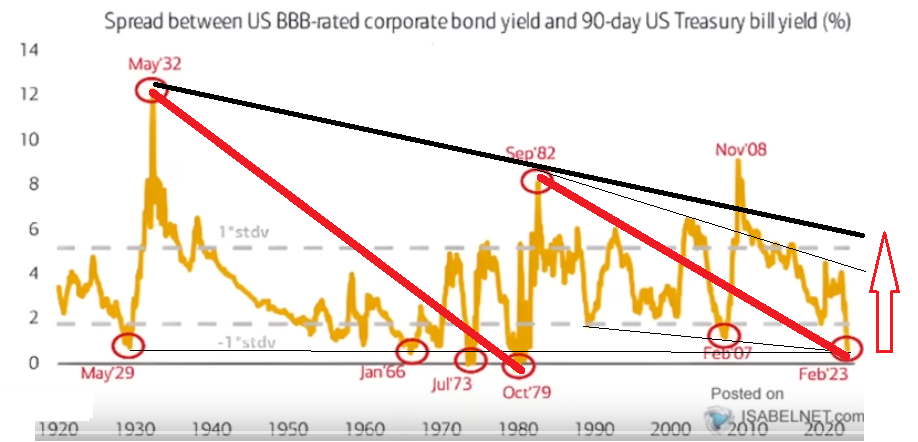
NOTE: What is particularly alarming is that high quality AAA and AA Corporate bonds now account for less than 10% of the sector with banks owning ~44% of them which they require for capital requirement needs – increasing “Toll Rates”?
CPI THE MARKET MOVER THIS WEEK
 Long-duration assets are best avoided when inflation risk is high. Investors re-embracing higher-duration stocks is a signal they are also embracing the disinflationary narrative, one endorsed by the Fed and priced in to inflation swaps.
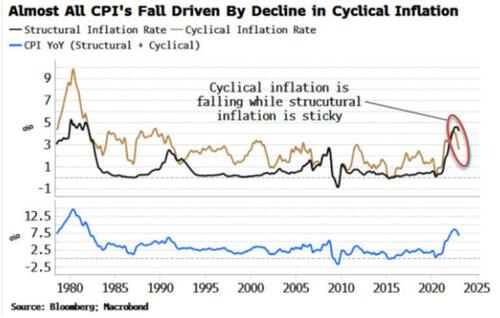
That narrative may soon run into trouble though. Headline inflation is falling, but this is almost all due to the drop in cyclical inflation. We can estimate cyclical and structural inflation by looking at the sub-components of CPI that are persistently above trend (structural) and those that are not (cyclical).
This chart (above right from Bloomberg) shows that:
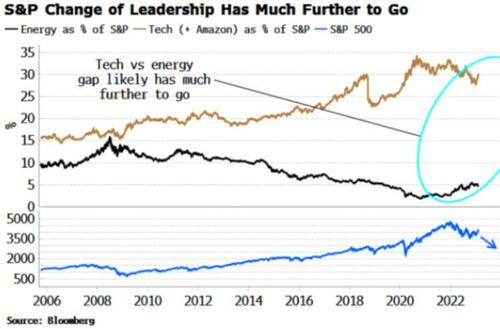 “while cyclical inflation has fallen, structural inflation is barely off its peak. What is likely to happen is that cyclical inflation will keep falling in the near term, taking headline CPI lower. But structural inflation will remain stubborn, meaning CPI will make a higher low. At this point, cyclical inflation will begin rising again, taking headline inflation with it. This would be a rude awakening for tech and consumer discretionary and other high-duration sectors that have risen this year. The bigger trend of lower-duration sectors outperforming – encapsulated in the energy vs tech stock rotation – is likely to re-assert itself sooner rather than later, taking the market lower with it.”
NOTE: See our WTIC chart in the “Energy” section above
Our MATASII 10Y Treasury Yield (TNX) chart (BELOW) reflects the market preparing for a “Sticky” CPI report this week.
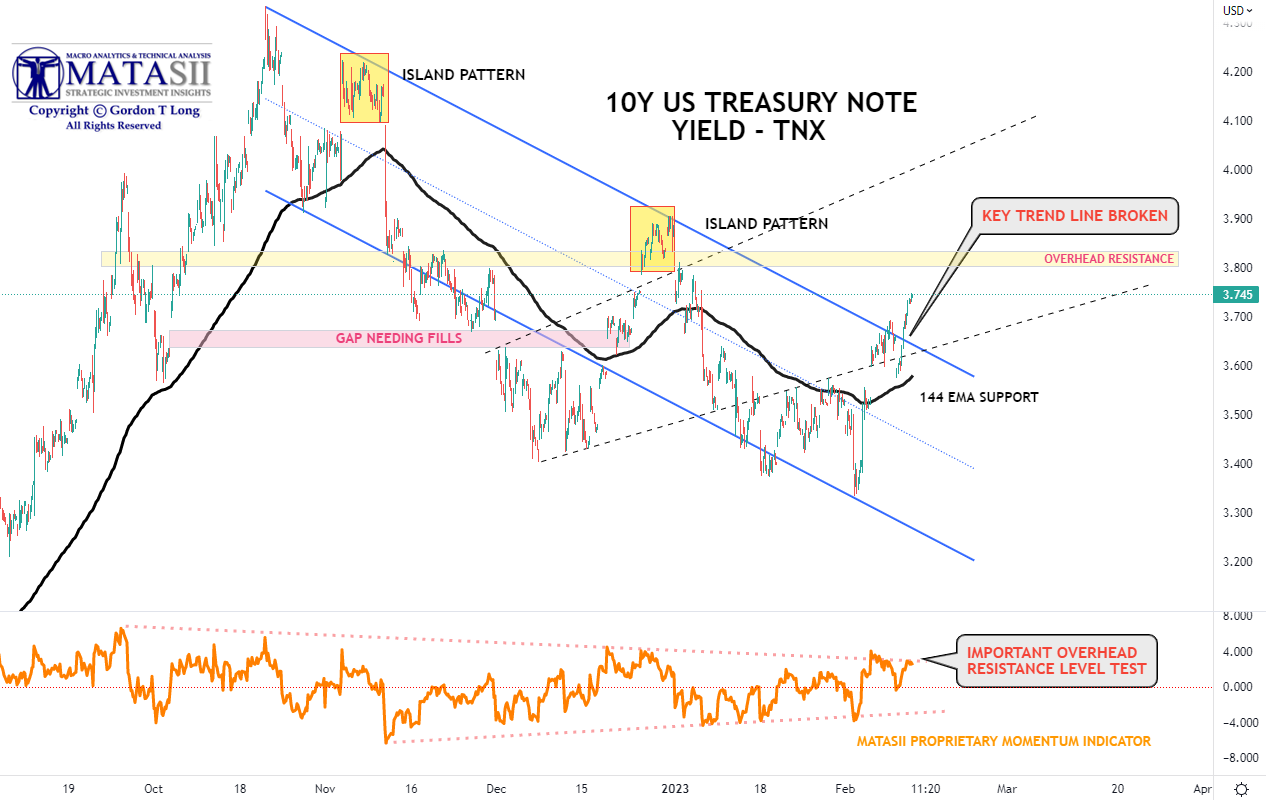
YOUR DESK TOP / TABLET / PHONE ANNOTATED CHART
Macro Analytics Chart: SUBSCRIBER LINK
FAIR USE NOTICE This site contains copyrighted material the use of which has not always been specifically authorized by the copyright owner. We are making such material available in our efforts to advance understanding of environmental, political, human rights, economic, democracy, scientific, and social justice issues, etc. We believe this constitutes a ‘fair use’ of any such copyrighted material as provided for in section 107 of the US Copyright Law. In accordance with Title 17 U.S.C. Section 107, the material on this site is distributed without profit to those who have expressed a prior interest in receiving the included information for research and educational purposes. If you wish to use copyrighted material from this site for purposes of your own that go beyond ‘fair use’, you must obtain permission from the copyright owner.
NOTICE Information on these pages contains forward-looking statements that involve risks and uncertainties. Markets and instruments profiled on this page are for informational purposes only and should not in any way come across as a recommendation to buy or sell in these assets. You should do your own thorough research before making any investment decisions. MATASII.com does not in any way guarantee that this information is free from mistakes, errors, or material misstatements. It also does not guarantee that this information is of a timely nature. Investing in Open Markets involves a great deal of risk, including the loss of all or a portion of your investment, as well as emotional distress. All risks, losses and costs associated with investing, including total loss of principal, are your responsibility.