Gordon T Long
Global Macro Research | Macro-Technical Analysis
MATA – TECHNCIAL ANALYSIS
PATTERNS
YOU CAN ONLY MANIPULATE THE DATA SO LONG!
Economic reality is starting to overwhelm the data games that the government statisticians can resort to, which would buy time the Federal Reserve desperately needs to raise rates. This needs to sufficiantly both attempt to combat Inflation and have enough ammunition to fire the “bazooka” that will soon be required.
We have long argued that until the Unemployment rate started to rise the next leg of the Bear Market would not resume. Our similar analogies of 1974 (inflation) and 2008 (unemployment) have been pretty clear on this. The market is mistaken in believing that when the Fed’s Pivot finaly occurs and rates begin falling, the market will rise. History shows us that the market will follow the crippling economic damage to lower levels.
=========
WHAT YOU NEED TO KNOW
 YOU CAN ONLY MANIPULATE DATA SO LONG! We along with many others were quite vocal recently on how manipulated US Economic Job reporting from the BEA and Commerce Department (Video: Right) had become. However, it turned out to be successful in buying the much required time for the Federal Reserve to raise rates further and allow time for inflation to potentially weaken further. Now, even though we see markets finally reacting to the realities that “Bad News is actually Bad News”, it is still latently pricing in another 25 bps from the Fed. Never underestimate the power of the media even when your “lying eyes” tell you something different!
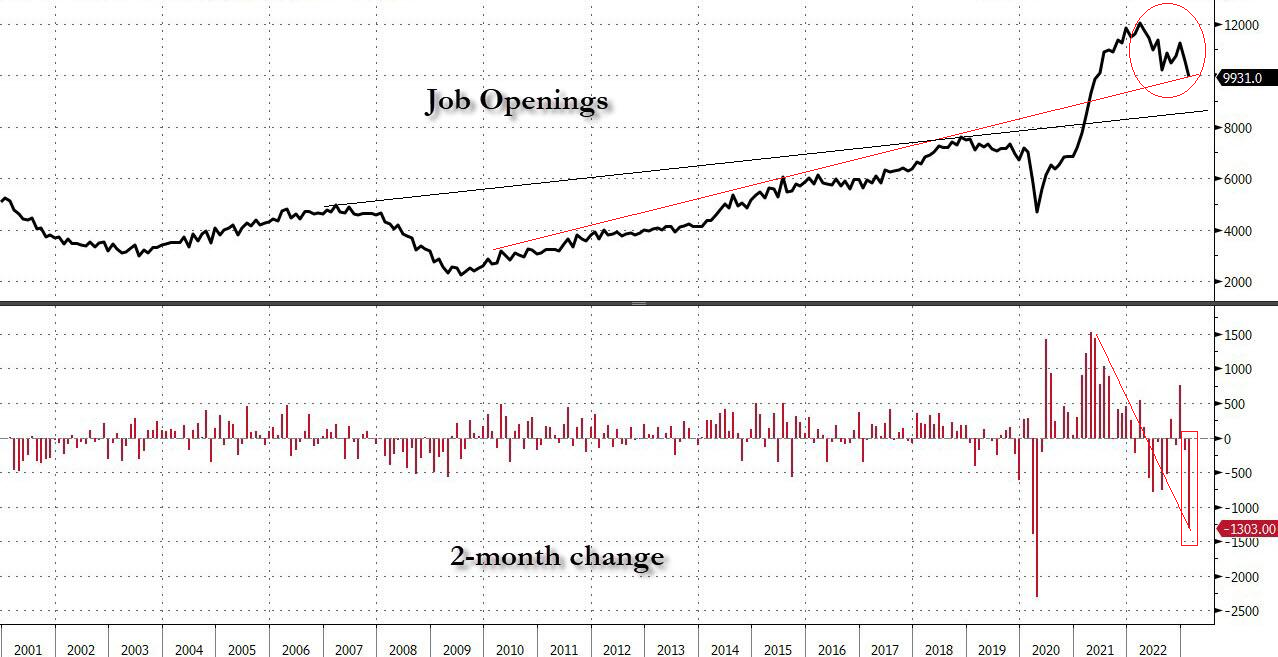
JOB OPENING ABRUPTLY BEGIN FALLING: JOLTS Report a Real Shocker
-
- The JOLTS Report was a shocker. Job Openings and Hires crashed to the lowest since May 2021 while missing every estimate.
- The 2-month drop in job openings was 1.3 million, the second highest on record, surpassed ONLY by the economic shutdown during the covid crash!
- The long overdue plunge in job openings means that there are now just 3.995 million more jobs than unemployed workers, down sharply from last month’s 5.13 million preadjustment, which has now been adjusted to 4.869 million.
- There were just 1.67 job openings for every unemployed worker, down from 1.86 last month.
- HIRES: The number of hires also plunged by dropping to 164K in February to 6.163 million, the lowest since May 2021.
- GOLDMAN SACHS FELT COMPELLED TO POINT OUT THE MALFEASANCE OCCURRING IN US DATA – PRIOR TO FRIDAY’S LABOR REPORT (On a Holiday Shortened Work Day).
- “Timelier alternative measures of job openings track official data reasonably well in most countries, but the official JOLTS job openings measure looks relatively high in the US.”
- Once the JOLTS report confirmed that the recent trend was spurious (at best), everyone then expected Friday’s jobs report to also come in far below the January level, and an extension of the previous downward sloping trendline.
- In addition to Goldman Sachs, this was something which BofA already expected as did Morgan Stanley, who wrote that it expects “re-normalization of the economic data, starting with the payrolls print. . THIS HAPPENED.
LABOR REPORT: Expected “Forced” Adjustments Are Now Happening
-
- The Labor Report (NFP) was the lowest in 27 months -The BLS has finally stopped defending the “strong labor market” myth. However through effective narrative control the jobs report was the 11th monthly beat in a row!
- The March payrolls print came in at 236K, just above the 230K expected and below last month’s upward revised 326K (up from 311K). The last time we had a lower monthly print was December 2020 when they tumbled 268K.
- The real surprise in the NFP report was the continued drop in hourly earnings, which came in at 4.2% Y/Y, down from 4.6% in February and below the 4.3% expected?
JOB OPENINGS v UNEMPLOYMENT RATE: The Hidden Trigger to Watch!
-
- Watch the Job Openings and Layoffs closely for a triggering shift in Investor Sentiment.
- A sudden loss in confidence could trigger a reaction function that the Federal Reserve will be helpless to stop without major longer term damage being incurred.
- The markets have become too concentrated into the market valuations of a few major participants. Historically , this has only happened to this degree on two other occassions – n 1929 and 1974.
- The Fed desperately wants to be in a position which would foster the markets to continue buying the dips and any perceived weaknesses, being buying opportunities to assist their recessionary recover efforts. The degree of current bearish sentiment has historicaly ignited major upward market moves.
 CONCLUSION
BAD NEWS IS BAD NEWS – Again!
-
- It now seems the “r” word is a bigger problem for the marginal-buyer.
- Also couple that with another inflationary impulse from oil and we see stagflation just got another check” in-the-box.”
- Additionally, CEO of JP Morgan, Jamie Dimon was out warning that “the current crisis is not yet over, and even when it is behind us, there will be repercussions from it for years to come.”
MATASII LAYOFF TRACKING: its a Global Problem!
-
- Layoffs are accelerating with a noticable pick-up globally by International Conglomerates.
566 tech companies w/ layoffs ∙ 168,582 employees laid off so far in 2023
(Click Link to See Global Detail)
=========
JOB OPENINGS ABRUPTLY BEGIN FALLING
 After five consecutive beats of expectations and an unprecedented 27 beats in the the past 29 months, February is when the BLS’ “seasonally-adjusted” BS finally came crashing down. Not only was the February print below all sellside estimates, but it was the 3rd biggest miss of expectations on record!
It has been abundantly clear for months that at a time when the US economy is careening into a hard landing recession, the manipulated, seasonally-adjusted, and politically goalseeked job openings data released as part of the Department of Labor’s JOLTS report was sheer rubbish. The BLS has finally been forced to come somewhat clean!
-
- In February there were just 9.931 million job openings, the first sub-10 million print since May 2021.
- Had the BLS not drastically slashed the January number, the drop would have been almost 1 million job openings.
- January job openings was cut to 10.563 million from 10.824 million originally reported.
- TRANSLATION: The 2-month drop in job openings was 1.3 million, the second highest on record, surpassed only by the economic shutdown during the covid crash!
- The long overdue plunge in job openings means that there are now just 3.995 million more jobs than unemployed workers, down sharply from last month’s 5.13 million preadjustment, which has now been adjusted to 4.869 million.
- There were just 1.67 job openings for every unemployed worker, down from 1.86 last month.
INSIGHTS FROM FACEBOOK/META LAYOFFS
The Facebook/META layoff announcements gives us a glimpse into some of the realities of the recent hiring surge and why now the sudden layoffs:
META STARTS CLEANIONG HOUSE – AXES 1,500 RECRUITING & HR JOBS
-
- In a memo sent to employees, Meta CEO Mark Zuckerberg outlined plans to reduce its workforce by laying off 10,000 employees and eliminating 5,000 vacant positions. A previous round of job cuts was announced in November of around 11,000 people or 13% of its staff.
- A Former Meta employee says she was paid $190k ‘to do nothing’. She claims the massive tech company was “hoarding talent” in order to starve out their competition. Madelyn Machado posted a video responding to claims that Google and Meta had over-hired thousands of employees to do “fake work.”. Machado suggested she had been hired by Meta in the Fall of 2021, which she “hated” before eventually getting fired.
- “Getting paid $190k to do nothing at Meta” she said in a TikTok video. She added that new recruiters would be explicitly told that they would not hire any new employees within their first 6 months or to a year. She said what they actually did was mostly onboarding, training, and team meetings.
- “Every recruiter I knew had been reached out to by Meta, and they had been interviewed by Meta. I got my offer so quickly I thought it was a scam,” she said. “They had the most recruiters out of everybody, and they were doing that, so they could hire all the talent, and if no other companies had great recruiters because they were all doing nothing, getting paid 200-400-500-thousand dollars at Meta to do nothing, they’re not going to your company. That’s true, it worked, it was a great strategy.”
HIRES
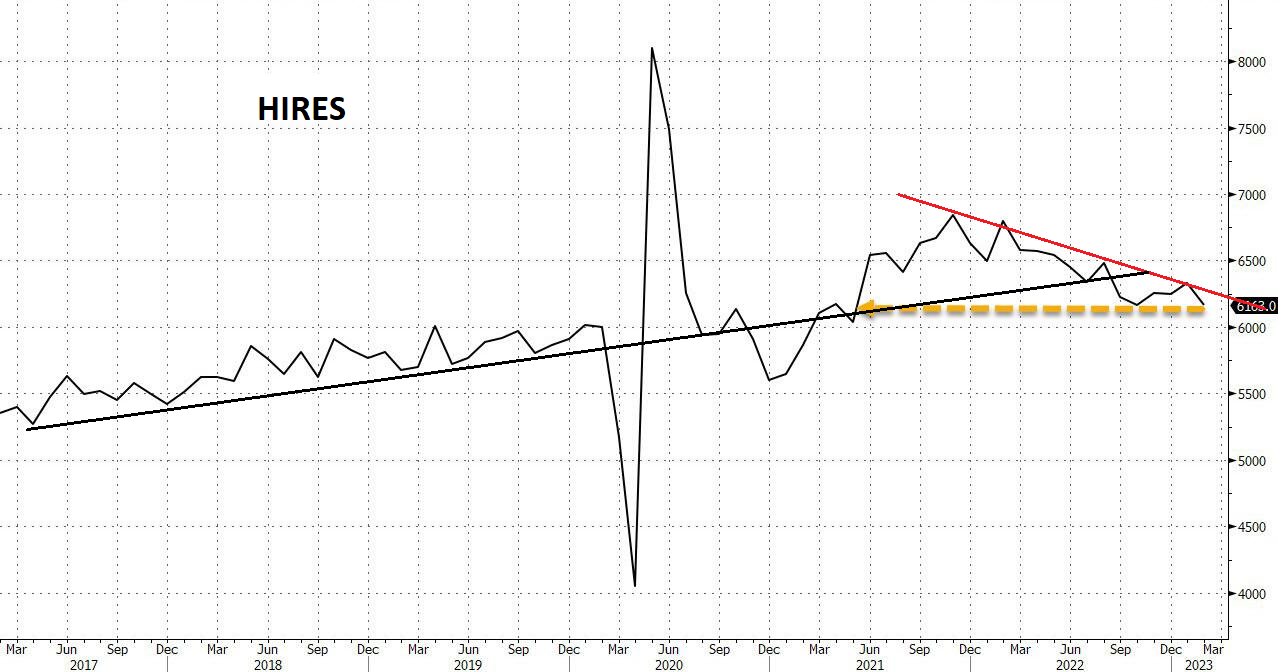 The number of hires also plunged by dropping to 164K in February to 6.163 million, the lowest since May 2021.
The hires number tumbled even though Biden did everything in his power to keep it high: the only place hires increased notably was in federal government (+8,000).
-
- The BLS reported that in February, small establishments (those with 1 to 9 employees) saw little change in their job openings rate, hires rate, and total separations rate; but the layoffs and discharges rate decreased.
- Establishments with more than 5,000 employees saw little change in their hires rate and total separations rate, while the job openings rate decreased.
NOTE: The real number of job openings highly likely remains still far lower since half of it – or some 70% is guesswork. As the BLS itself admits, while the response rate to most of its various labor (and other) surveys has collapsed in recent years, nothing is as bad as the JOLTS report where the actual response rate has tumbled to a record low 31%.
GOLDMAN SACHS FELT COMPELLED TO POINT OUT THE MALFEASANCE OCCURRING IN US DATA – PRIOR TO FRIDAY’S LABOR REPORT (On a Holiday Shortened Work Day)
All the JOLTS manipulated reporting was highlighted by Goldman Sachs who felt compelled to expose it.
Goldman has also found that the number of job openings signaled by the JOLTS report is also delayed in showing the true state of the labor market (at best), or simply rigged, and in a report by the bank’s chief economist Jan Hatzius, he writes that while “timelier alternative measures of job openings track official data reasonably well in most countries, but the official JOLTS job openings measure looks relatively high in the US.” (See Chart Below)
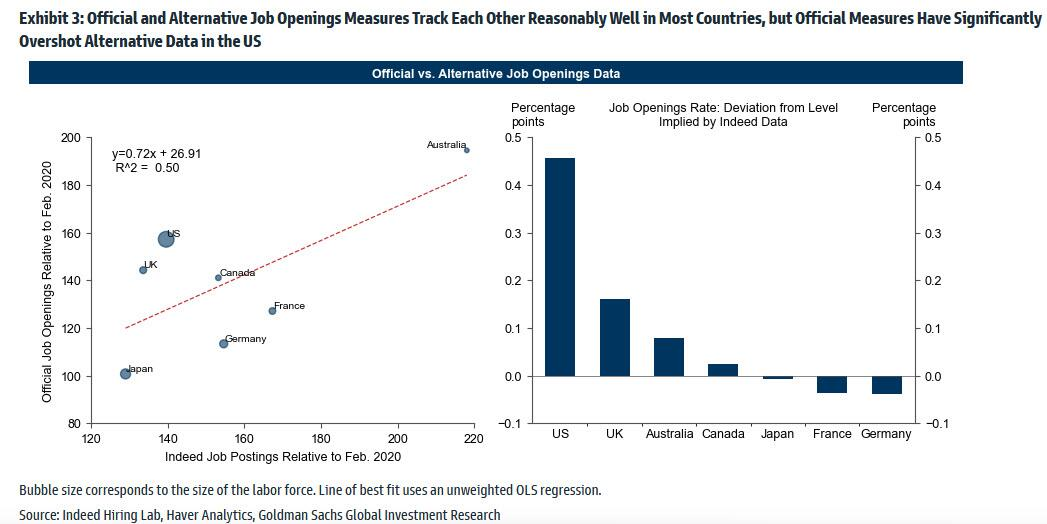
Its almost as if there is a political mandate under the Biden administration to fabricate data with the purpose of making the labor market appear stronger than usual. Of course, Goldman would never admit that political apparatchiks planted in the Dept of Labor and BLS have been tasked with “seasonally adjusting” numbers to make Biden look good. Instead it offers the following two explanations why the official data no longer represents reality.
GOLDMAN’S CONCLUSIONS
Since the BLS will find it difficult to rig the data any longer, various adjustments fall out in the latest dataset, the bank sees “scope for a large pullback in official job openings in the US and forecasts that job openings will fall by 800k to 10.2mn in next week’s January JOLTS report.” HAPPENED
A nearly 1 million drop in JOLTS will quickly reprice much of the recent tightening driven by expectations of “no landing” ,which has sent the terminal rate to 5.65% and the 2s10s below -100bps. HAPPENED
And once the JOLTS report confirms that the recent trend was spurious (at best), expect Friday’s jobs report to also come in far below the January level, and an extension of the previous downward sloping trendline, something which BofA already expects… HAPPENED
LABOR REPORT: Expected “Forced” Adjustments Happening
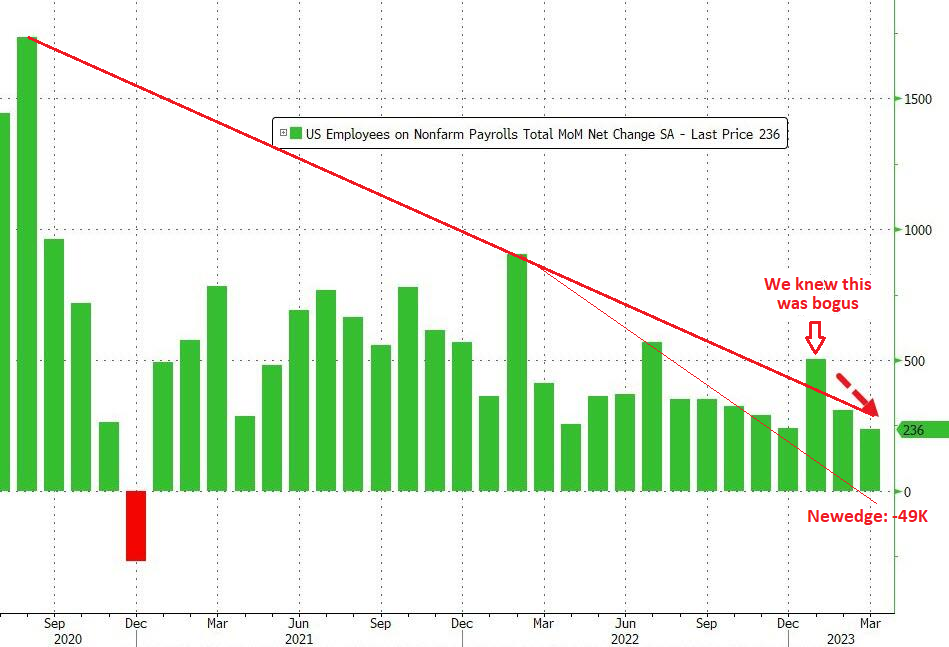 The BLS has finally stopped defending the “strong labor market” myth. However through effective narrative control, the jobs report was the 11th monthly beat in a row!
WHAT WAS REPORTED:
-
- Lowest In 27 Months
- The March payrolls print came at 236K, just above the 230K expected, and below last month’s upward revised 326K (up from 311K).
- The last time we had a lower monthly print was December 2020 when they tumbled 268K.
- The change in total nonfarm payroll employment for January was revised down by 32,000, from +504,000 to +472,000.
- The change for February was revised up by 15,000, from +311,000 to +326,000.
- These revisions, employment in January and February combined are 17,000 lower than previously reported.
- This was all thanks to 47K government jobs! Private payrolls were only 189K, missing the consensus print of 218K and below February’s 266K.
REMINDER: Newedge Warned: “based on a linear regression of jobless claims, ISM employment, NFIB hiring, ADP, JOLTs, conference board, and Indeed/ZipRecruiter surveys that predict a negative 49K.”
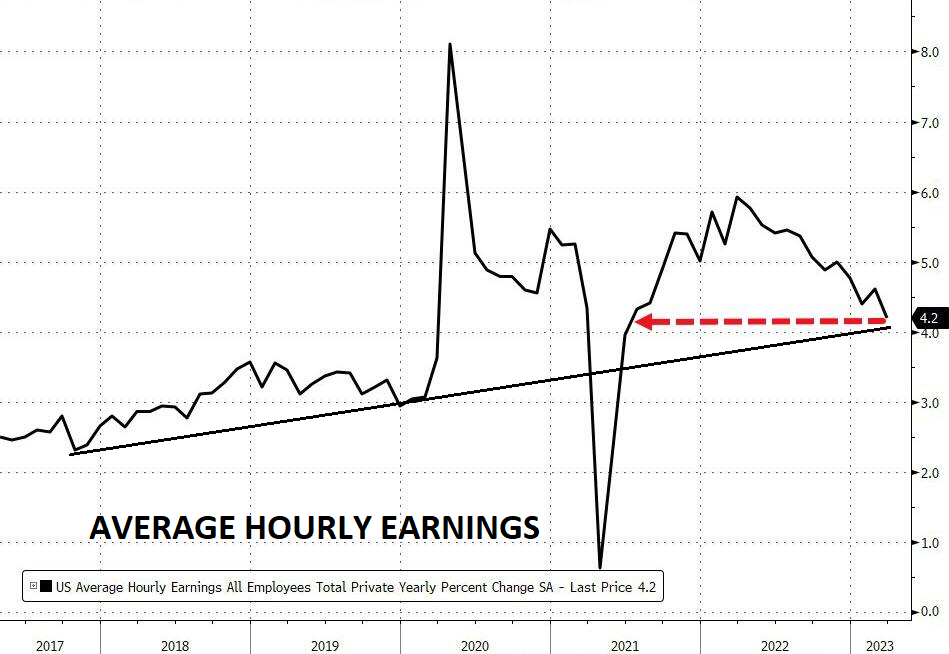
The real surprise in today’s report, however, was the continued drop in hourly earnings, which came in at 4.2% Y/Y, down from 4.6% in February and below the 4.3% expected.
JOB OPENINGS v UNEMPLOYMENT RATE: The Hidden Trigger to Watch!
We continue to stress the importance of monitoring developments in Unemployment through the deteriorating Job Openings and Layoff reporting since the BLS reporting is highly questionable. The BLS’s claim that the Unemployment Rate FELL this past month from 3.6% to 3.5% defies any rartional logic. The important point for investors is to know the numbers will be forced to resemble reality at some point and should be prepared for it in advance, because it is highly likely to be a precursor to a major market dislocation.
The official Job Openings (JOLTS Report) shown below by the Federal Reserve’s FRED System shows a significant recent delcine in the number of Job Openings. As the chart illustrates (in red), it normally is an indicator that the recession is underway, though it won’t be officially labeled as such until long after the fact.
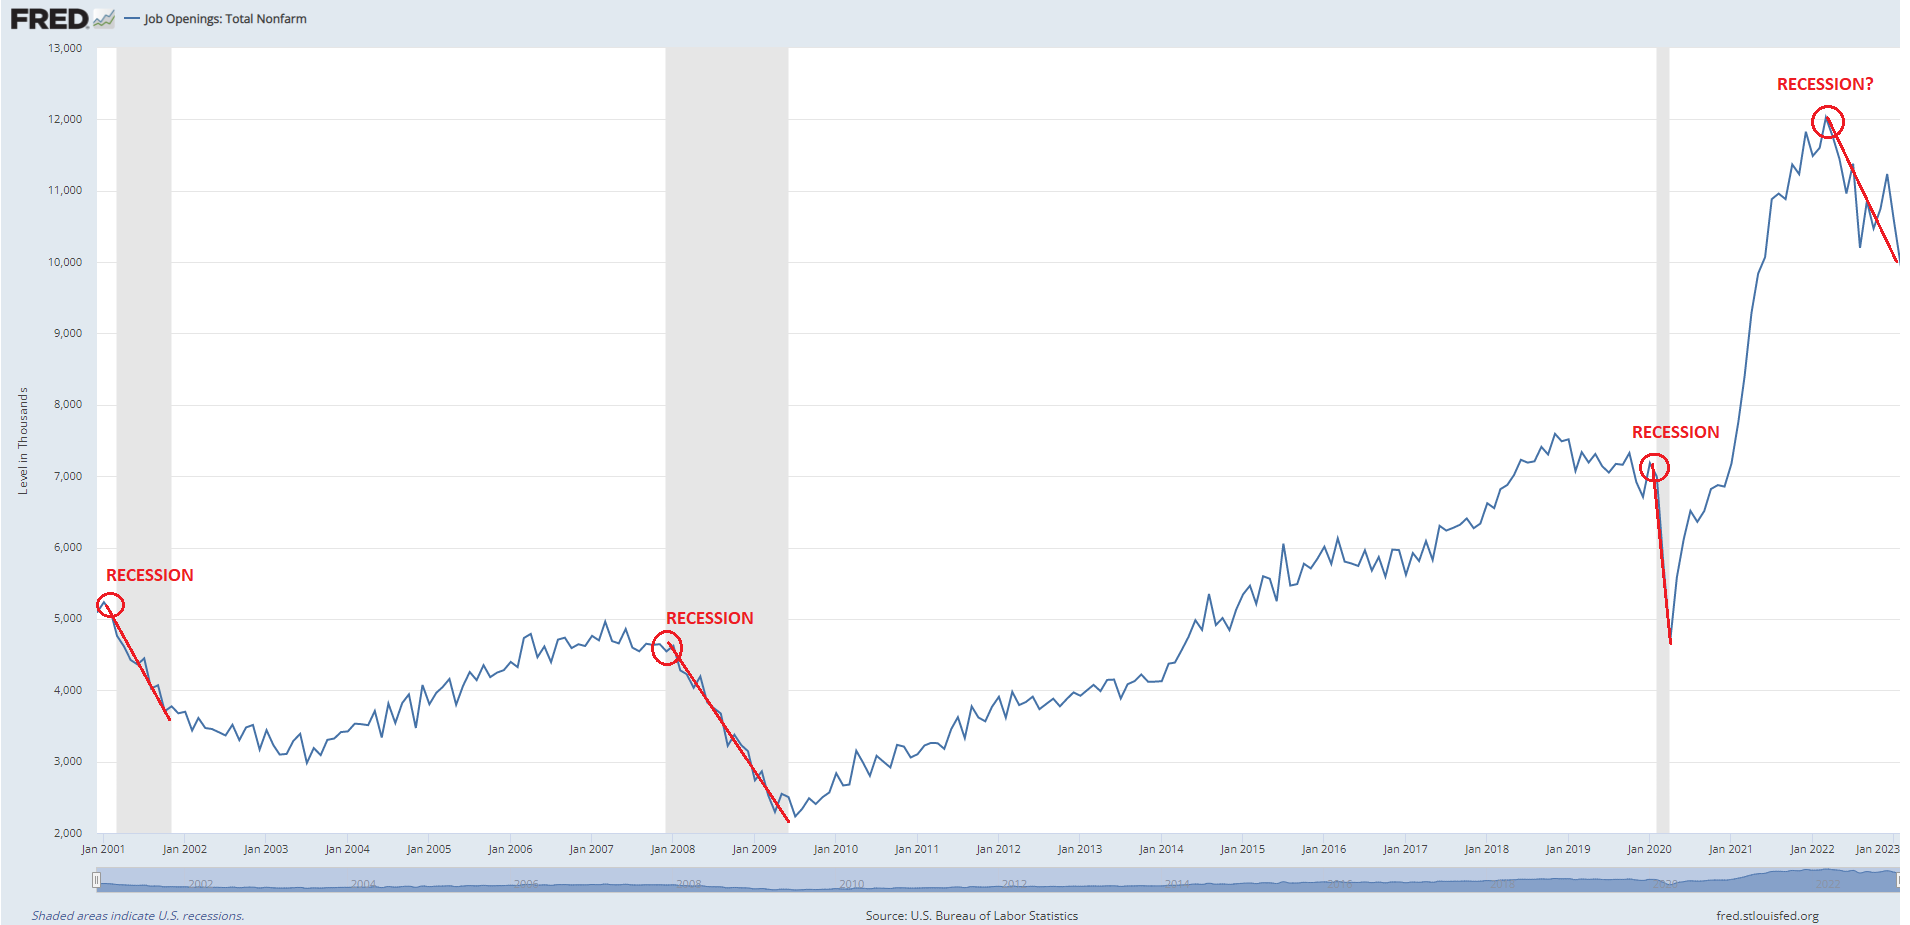
I have inverted the Job Openings data (blue line) so we can better compare it with the government’s Unemployment rate. They historically mirror each other very closely – up until recently? This divergence is confusing the markets! Though it is obvious why the powers to be would want to temporarily “message” the numbers, why are they going to extremes we have not seen in prior end of cycle periods. What makes the current situation so perilous for them?
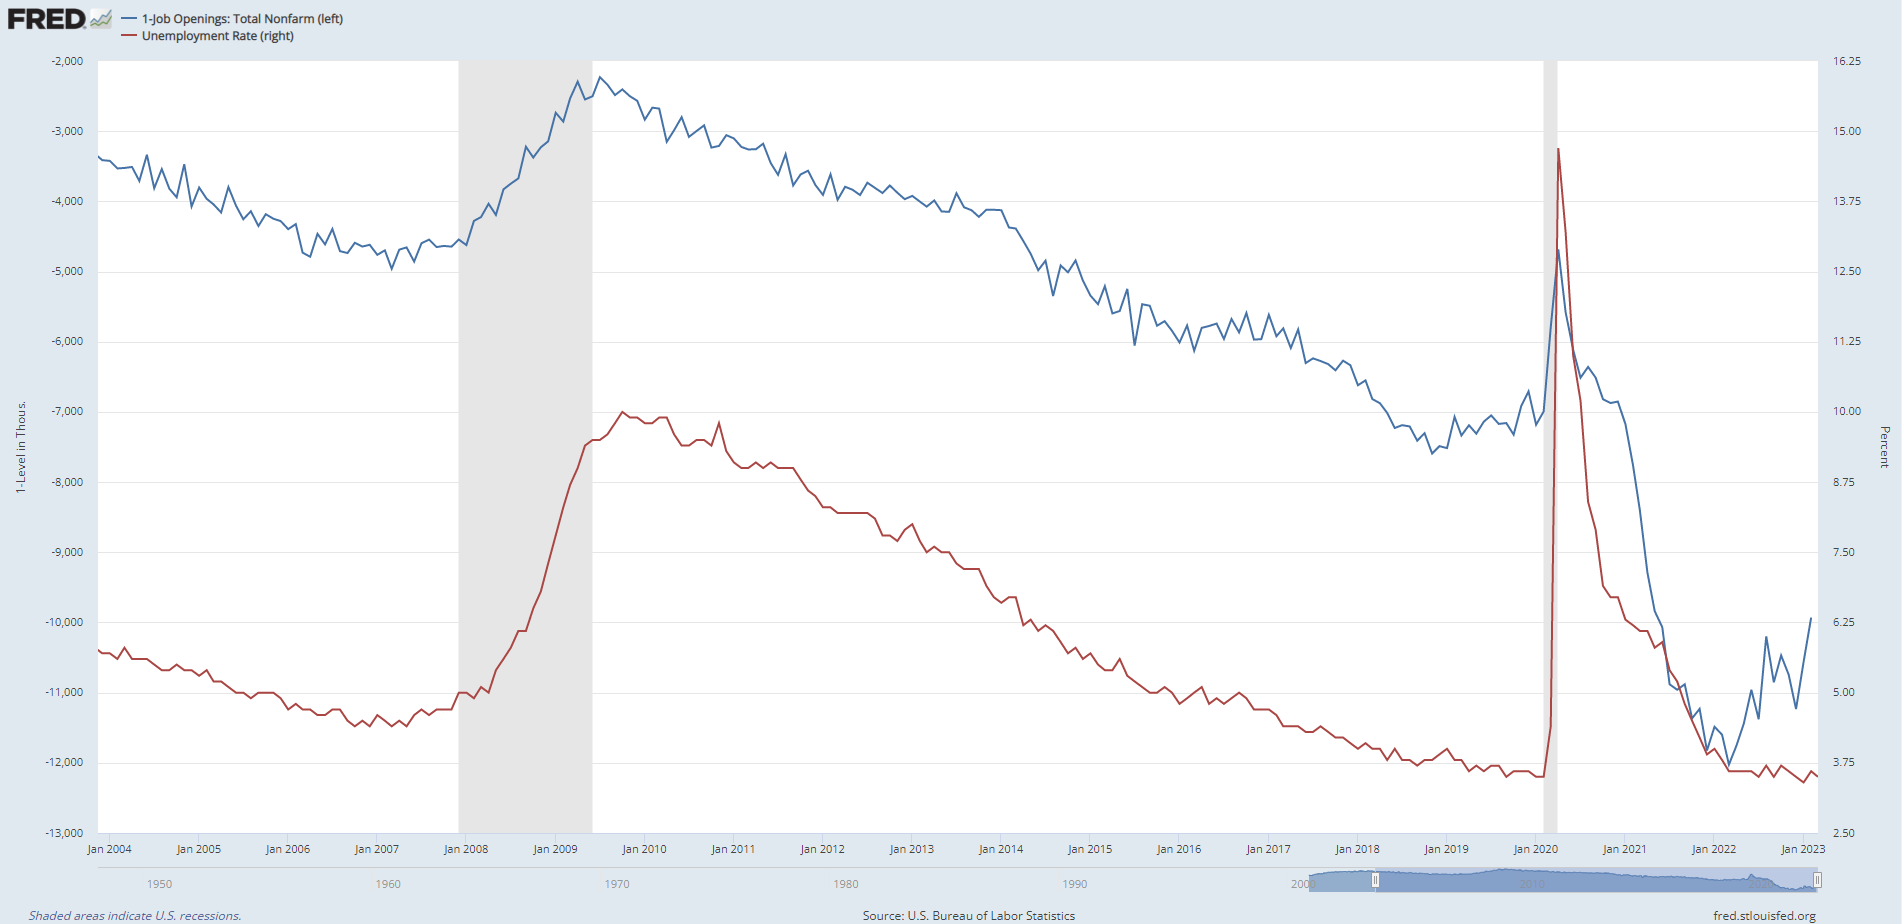
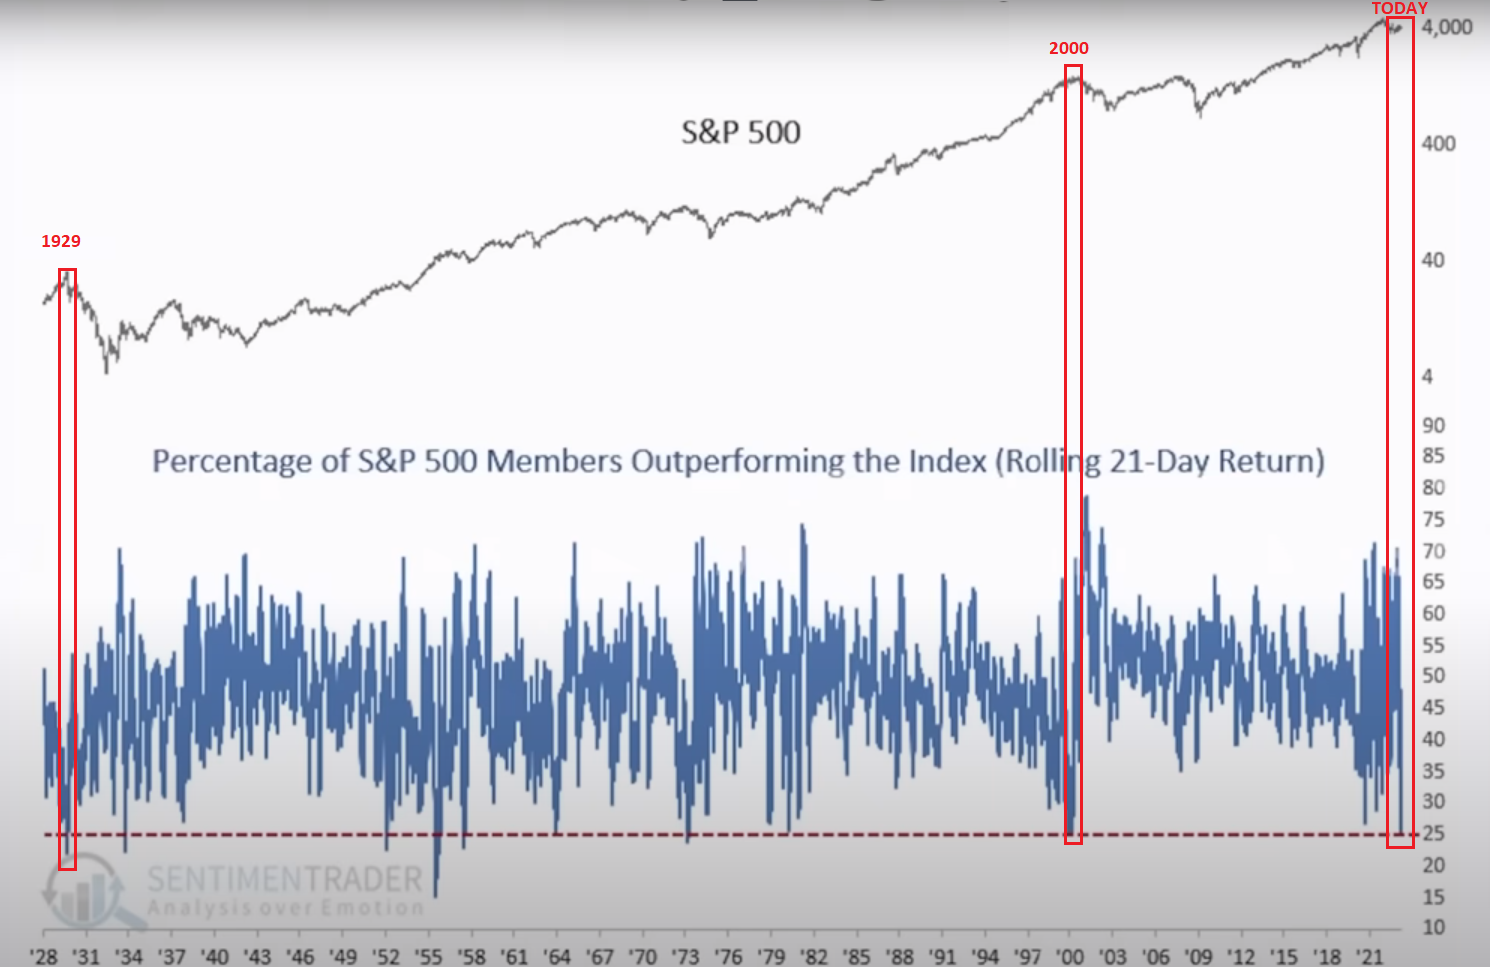
The answer lies in the degree of exposure the financial markets have to a sudden loss in confidence, which could trigger a reaction function that the Federal Reserve will be helpless to stop without major longer term damage being incurred. Specifically, the markets have become too concentrated into the market valuations of a few major participants. Historically, this has only happened to this degree on two other occassions – n 1929 and 1974.
The first chart below shows these three points, as market highs after protracted run-ups against the percentage of S&P 500 members, outperform the index on a rolling 21 day return.
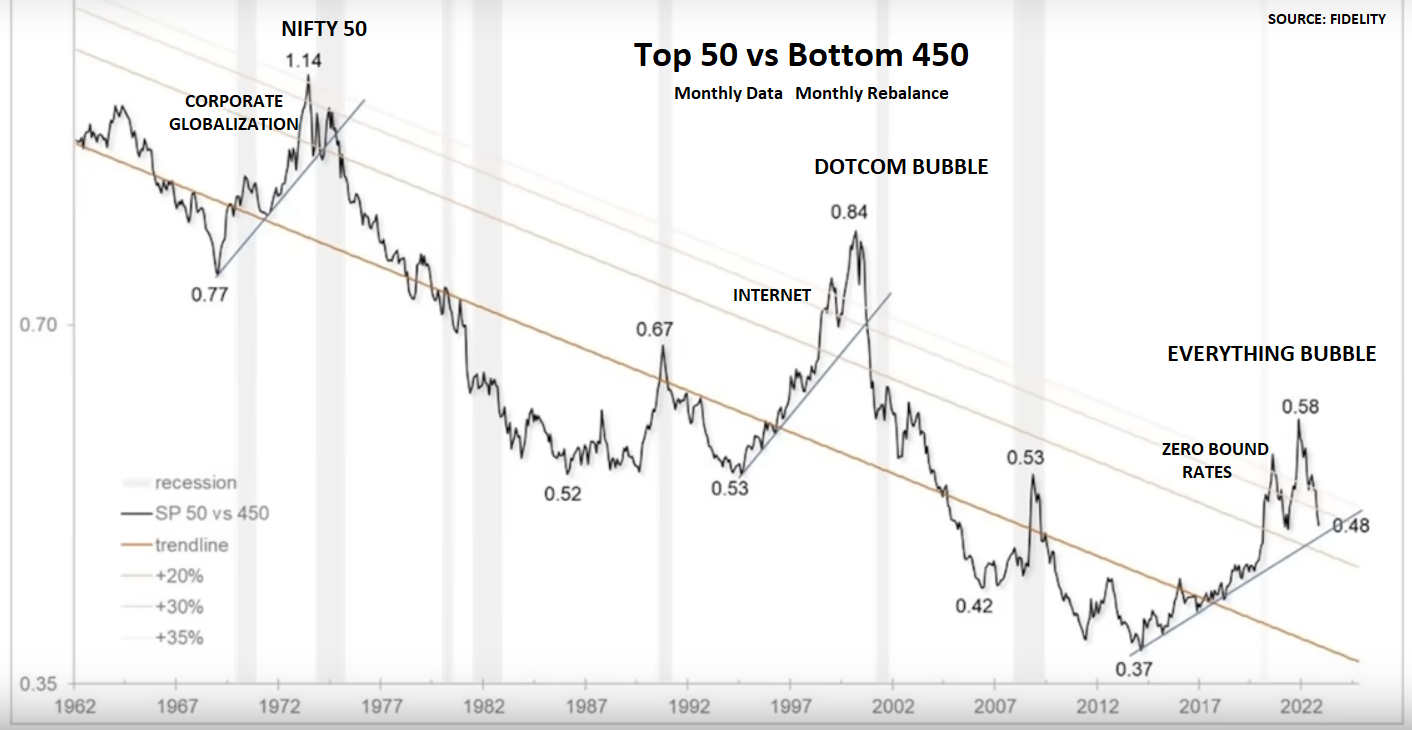
Another way of looking at the problem is by comparing the Top 50 versus Bottom 450 to obtain a better graphical representation of the degree of problem during the post WWII era. The only way to combat this will be for the Federal Reserve to have as big a War Chest as is possible as measured by: i) How many bps the Fed Funds Rate is above the Zero Bound and ii) How the small the Fed’s Balance Sheet is prior to being forced to dramatically raise it to much higher levels than ever previously imagined.
A FEW PLAYERS CONTROL THE MARKET
-
- 1974: NIFTY 50
- 2000: BIG INTERNET
- 2023: FAANG + MNT (See Market Perspective section in our last newsletter)
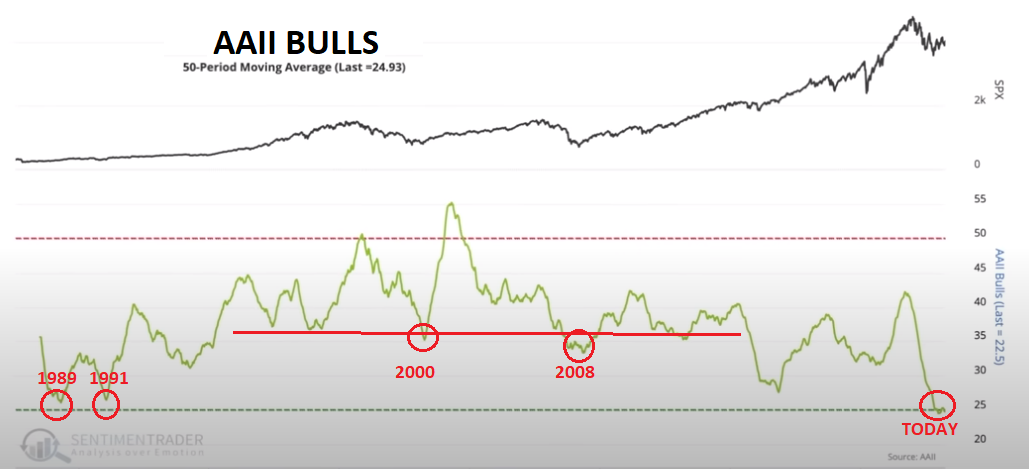
The Fed desperately wants to be in a position, as shown below, which would foster the markets continung to buy the dips and any perceived weaknesses being buying opportunities to assist their recessionary recover efforts. The degree of current bearish sentiment shown below (bottom right) has historicaly ignited major upward market moves. The problem this time is that the bearish sentiment is low, because anyone paying attention can see the seriousness and magnitude of the current storm clouds!
When the Unemployment rate finally starts increasing it will be an “all hands on deck” for the Fed and Biden Administration!
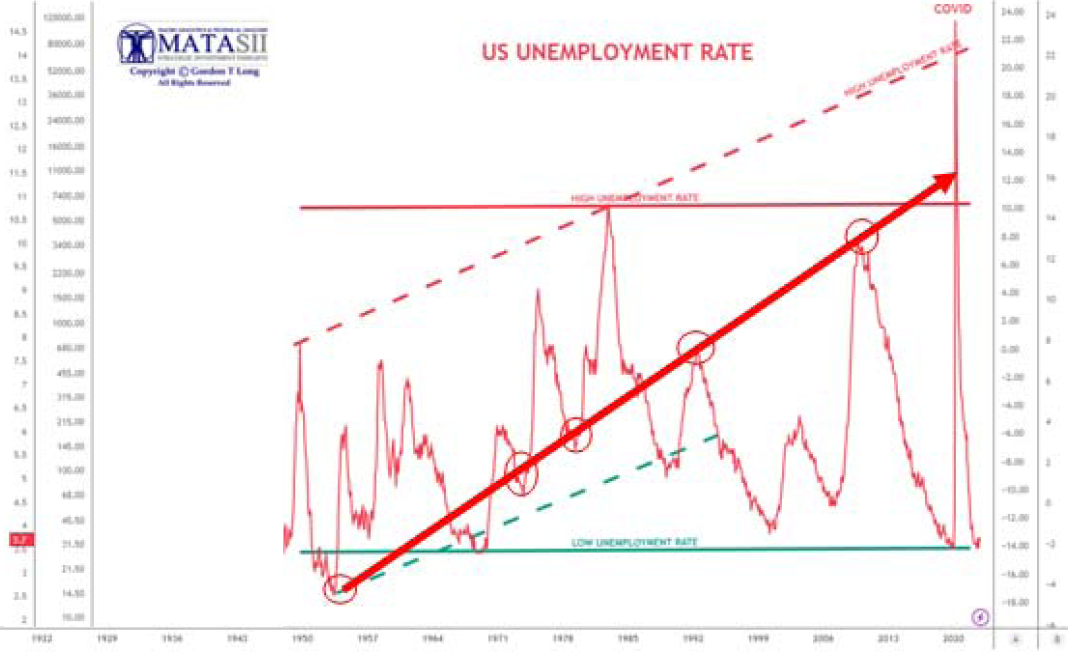
NOTE: Chart to the right from this year’s Thesis paper analysis suggest the Unemployment Rate is likely to rise to over 10% during the coming recession unless the Fed has its economic “Bazooka” fully loaded!
CONCLUSION
BAD NEWS IS NOW BAD NEWS – AGAIN!
CEO of JP Morgan, Jamie Dimon, was out warning this week that “the current crisis is not yet over, and even when it is behind us, there will be repercussions from it for years to come.”
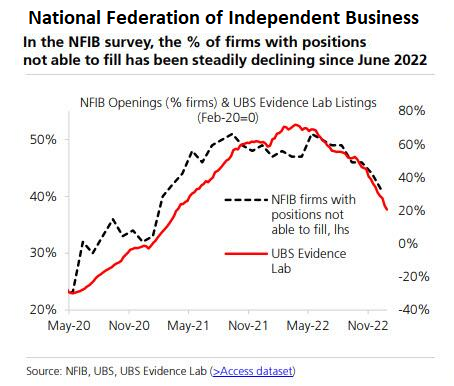
Chart Right: Job Openings in Small Business continuing to steadily deteriorate?
MARKETS
It now seems the “r” word is a expanding problem for the marginal-buyer.
When coupled with another inflationary impulse from oil, we see that stagflation just got another check “in-the-box”.
566 tech companies w/ layoffs ∙ 168,582 employees laid off so far in 2023
EARNINGS SEASON BEGINS!WILL WE GET MAJOR EARNINGS SURPRISES?
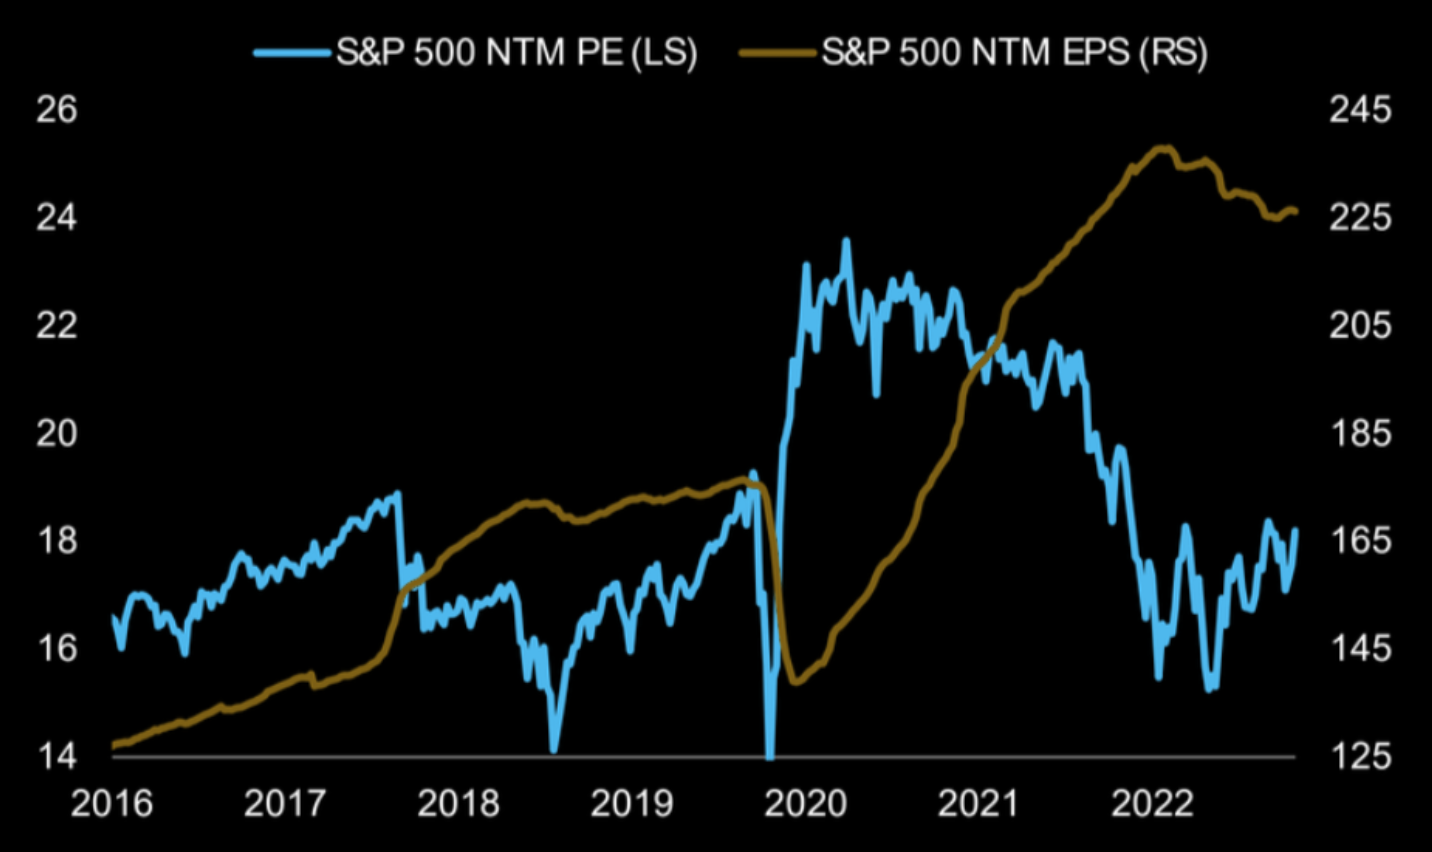
ABOVE:Valuation bounces higher as EPS cuts continue.
ABOVE: How Do Valuations keep rising while sales and margins are being taken down?
EARNINGS: The impact of recessions can depend on many factors including duration and severity of the recession. Our analysis leads us to currently believe this recession will be both extended and a hard landing.
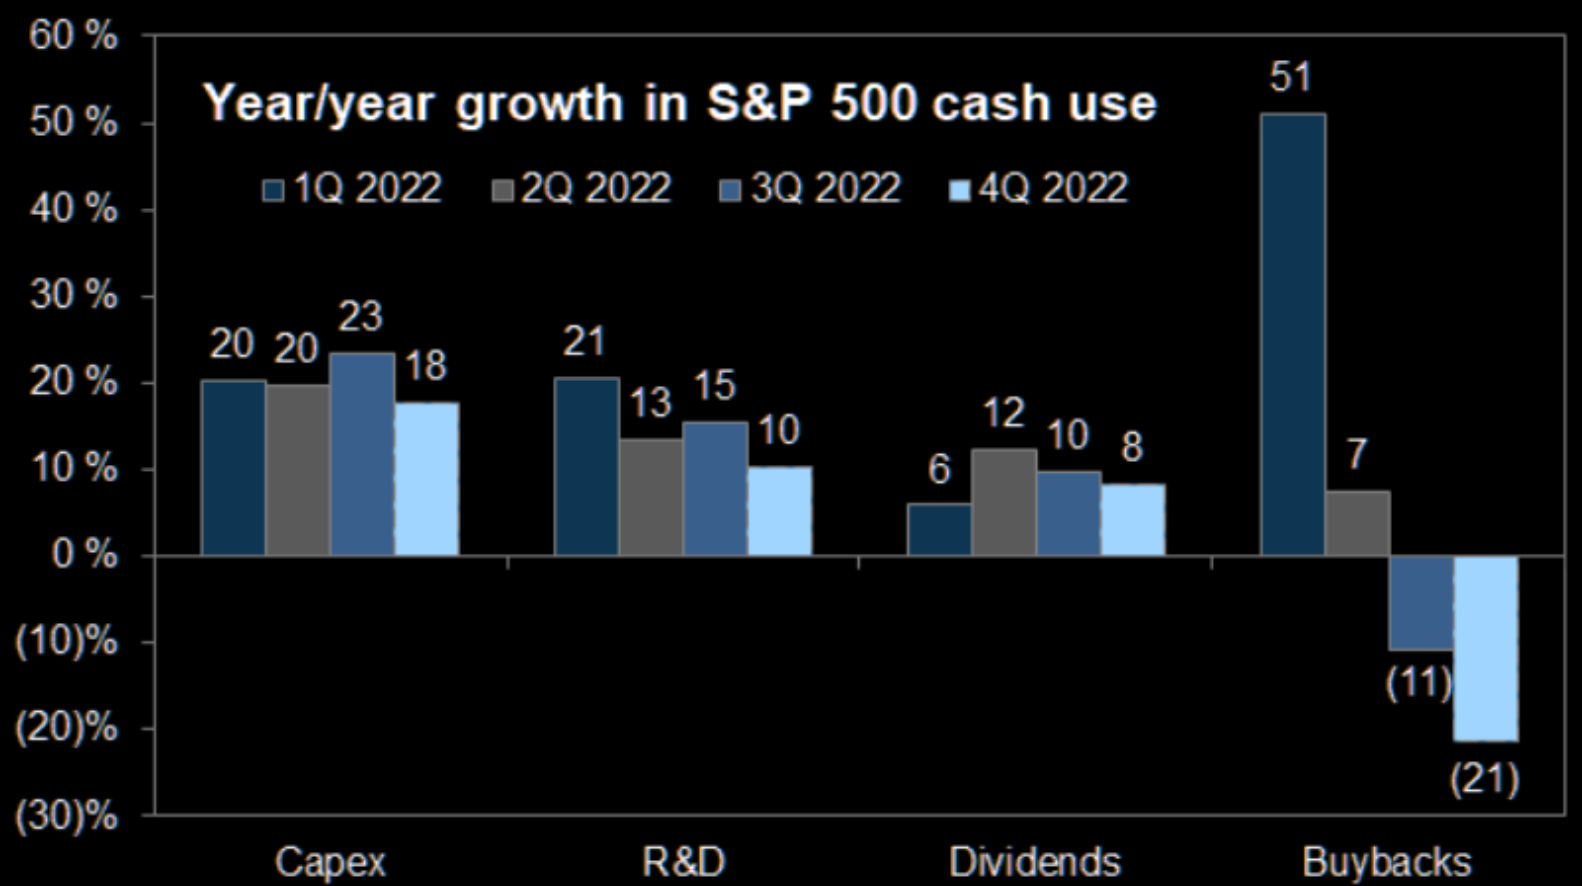
DIVIDENDS & BUYBACK PROGRAMS: The decline is already underway for both Dividend payout and stock Buyback programs, which we expect to materially accelerate in 2023. We are in the midst of a technical “Consolidation Triangle”. Traditionally these are continuation signals where the prior trend direction is completed adn the initial trend is resumed. The prior direction before entering into this “Consolidation Trangle” was DOWN. There are a number of Elliott Wave patterns counts that currently apply:
|
|
|
Both are detailed below.
However, caution is strongly advised until the upper overhead resistance trend line (in black) shown on all charts below is decisively broken!
Earning season can be full of surprises especially with the economy clearly slowing and the earning impacts only beginning to be felt!
The reality is we are going into an earnings season in the midst of a Banking Crisis, which is seriously impacting lending standards. Normally such a situation can be expected to result in corporations quickly tightening cash flow spending to protect on-going liquidity. It is simply a matter of survival and is Step 1 in being a Chief Fiinancial Officer. As earnings come down (whether priced in or not), it means some level of reduced discounted free cashflow. Expect Dividends and Buybacks, which have been pillars of the markets for the last 10 years, to increasingly be under pressure. We suspect that this is the element at the margin which the markets are not yet fully discounting!
The charts below suggest caution is advised, as we suspect the markets are signalling something isn’t quite right somewhere and hope the earnings conference calls will shed further required insights.
S&P 500 ELLIOT WAVE HEAD & SHOULDERS
The S&P 500 Head & Shoulders formation pattern is still very much in play! Indications suggest we have a POTENTIAL “coiling” of smaller Sub-Degree 2 Waves developing.
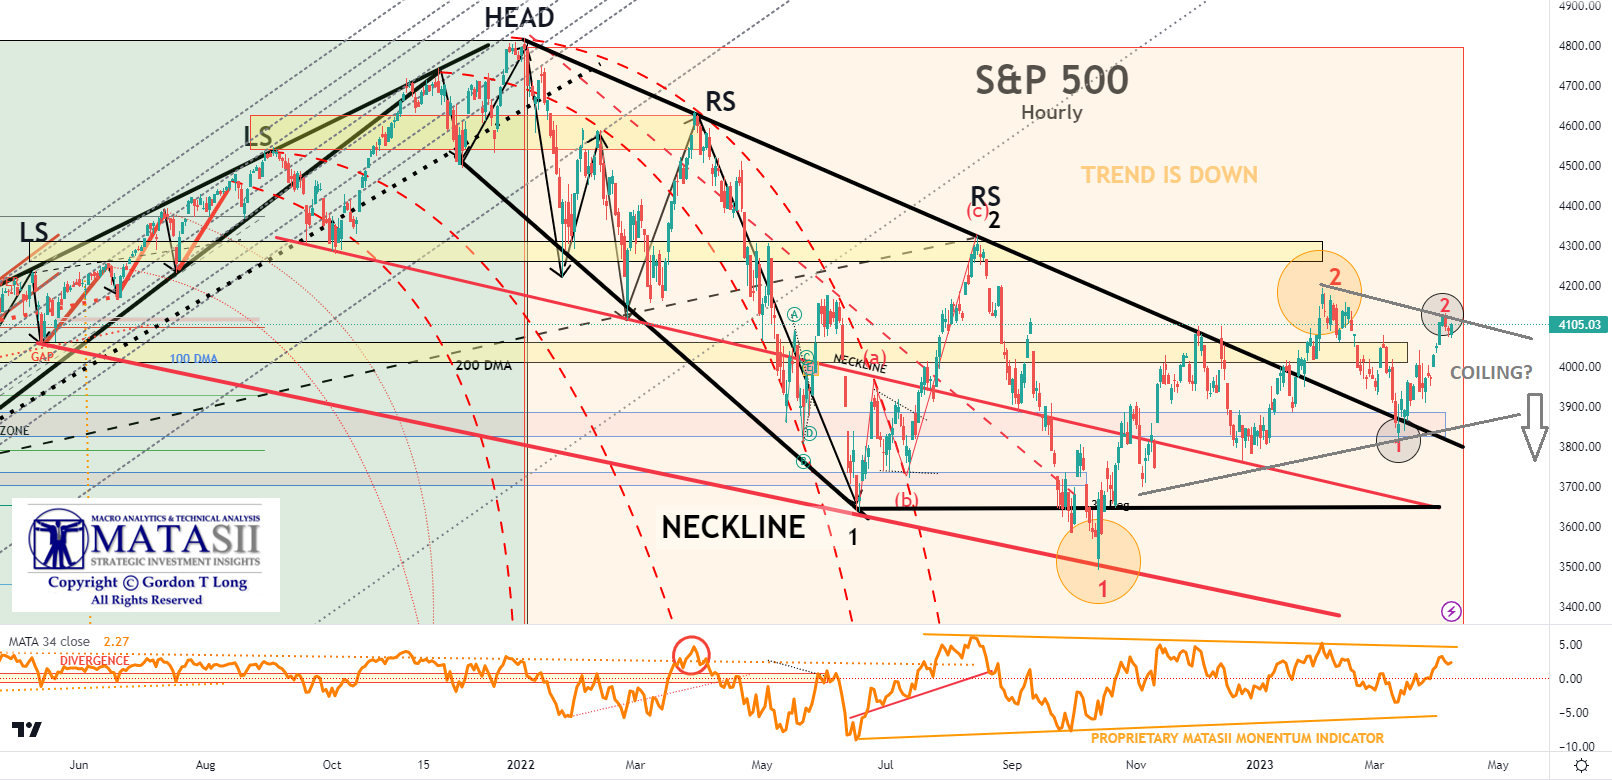
YOUR DESK TOP / TABLET / PHONE ANNOTATED CHART
Macro Analytics Chart Above: SUBSCRIBER LINK
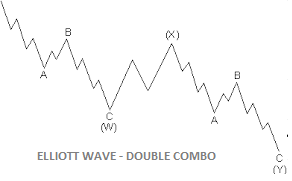
S&P 500 ELLIOT WAVE DOUBLE COMBO PATTERN
We continue to believe that the current Macro Market situation is best labelled by what Elliott Wave terms a “Double Combo” or classic ZigZag corrective pattern. It historically often occurs in these current types of market environments. If correct we are only half way through the pattern to the downside. Currently we are in the “X connector leg between the first “W” wave down and the coming “Y” leg down.
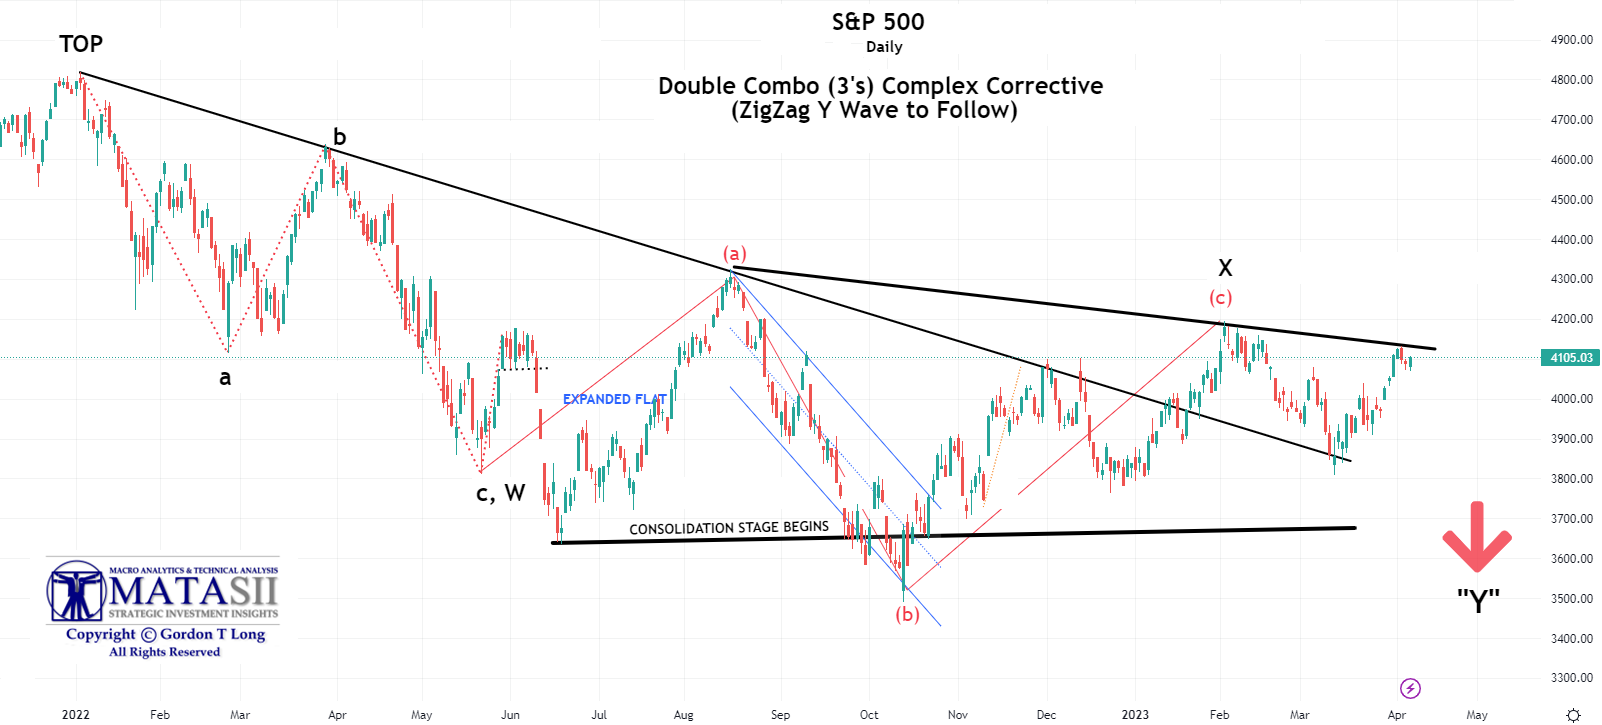
YOUR DESK TOP / TABLET / PHONE ANNOTATED CHART
Macro Analytics Chart Above: SUBSCRIBER LINK
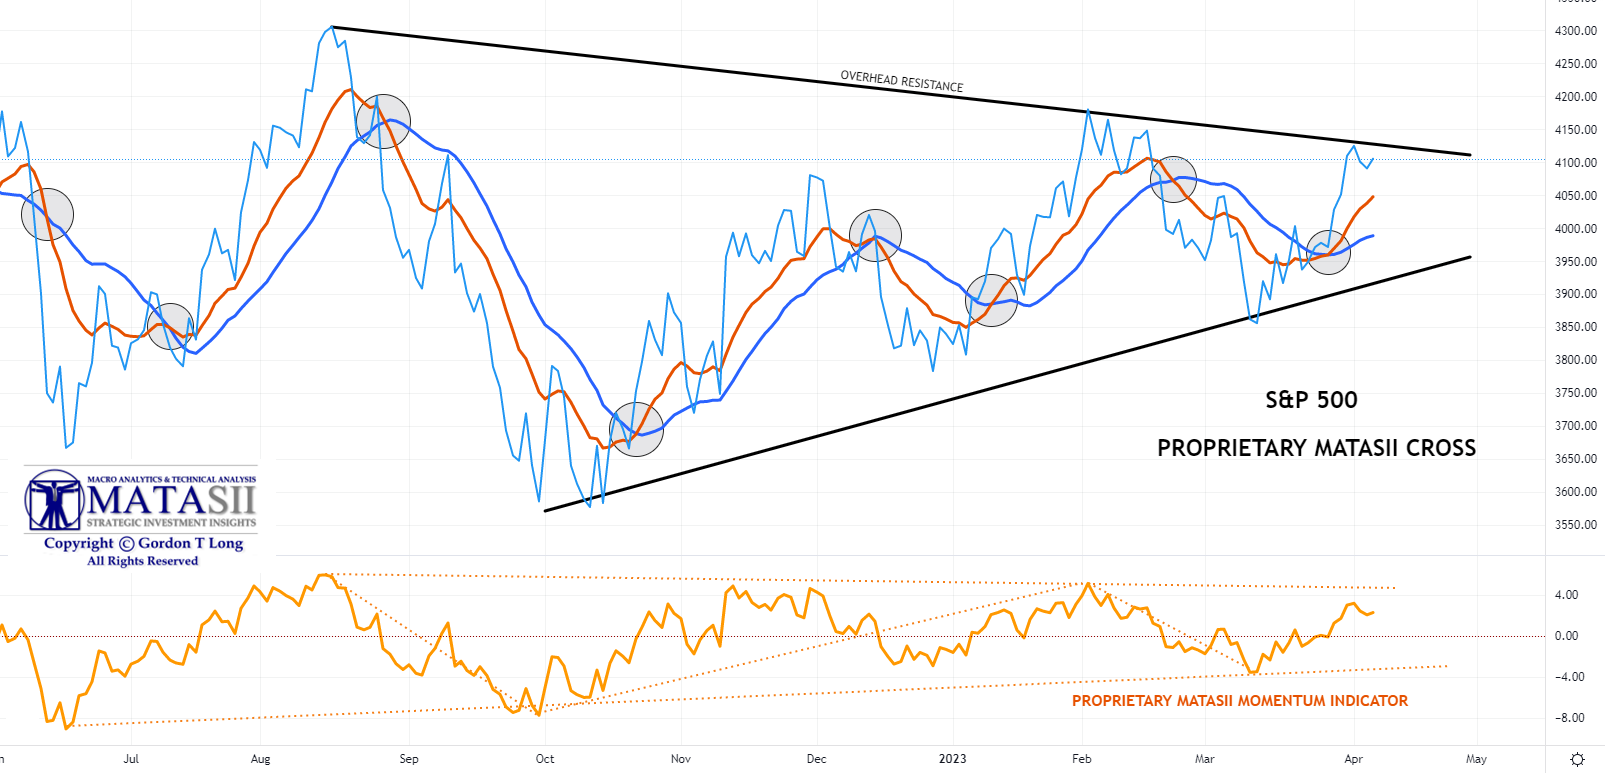
PROPRIETARY MATASII CROSS
Though the proprietary MATASII Cross is currently giving a BUY signal, caution is advised until the upper overhead resistance level is decisively broken!
FAIR USE NOTICE This site contains copyrighted material the use of which has not always been specifically authorized by the copyright owner. We are making such material available in our efforts to advance understanding of environmental, political, human rights, economic, democracy, scientific, and social justice issues, etc. We believe this constitutes a ‘fair use’ of any such copyrighted material as provided for in section 107 of the US Copyright Law. In accordance with Title 17 U.S.C. Section 107, the material on this site is distributed without profit to those who have expressed a prior interest in receiving the included information for research and educational purposes. If you wish to use copyrighted material from this site for purposes of your own that go beyond ‘fair use’, you must obtain permission from the copyright owner.
NOTICE Information on these pages contains forward-looking statements that involve risks and uncertainties. Markets and instruments profiled on this page are for informational purposes only and should not in any way come across as a recommendation to buy or sell in these assets. You should do your own thorough research before making any investment decisions. MATASII.com does not in any way guarantee that this information is free from mistakes, errors, or material misstatements. It also does not guarantee that this information is of a timely nature. Investing in Open Markets involves a great deal of risk, including the loss of all or a portion of your investment, as well as emotional distress. All risks, losses and costs associated with investing, including total loss of principal, are your responsibility.