Gordon T Long
Global Macro Research | Macro-Technical Analysis
MACRO - US ECONOMY
ECONOMIC INDICATORS
BROADENING & DESTABILIZING SHOCK WAVES
We have mistakenly and naively inserted Instability into a World of Incredible Complexity. The result has been and will continue to be broadening cascading shocks!
SEQUENTIAL SERIES OF BROADENING CASCADING SHOCKS:
- SHOCK 1: COVID-19 – Policy Mishandling & Financial Spending
- SHOCK 2: SUPPLY – Global Supply Chain Shutdown
- SHOCK 3: INFLATION – 50 Year High Inflation
- SHOCK 4: CREDIT – Credit & Lending Tightening
- SHOCK 5: BANKING – Unrealized Capital Losses
- SHOCK 6: LIQUIDITY -Tightening Lending Standards (We are Here)
- SHOCK 7: COLLATERAL – Reverse Wealth Effect
CONTINUATION OF NAIVE & FAILING FISCAL IRrESPONSIBILITY
The congressional games played are those of children playing with matches. The last Congress passed the Omnibus Bill (and other Bills) knowing full well they significantly exceeded the debt ceiling. Now the spending addicts yell it is irrepsonsbile not to pass the debt ceiling. If this money is in fact required, wouldn’t a responsible and accountable approach be to argue the merits and detailS of the spending in excess of the established debt ceiling? Of course not, because this avoids the accountability for the irresponsible spending that has destabilized the system through Inflation, Increased fiscal defcits and a potential debt downgrade.
The results of this are clear in the Economic Indicators outlined in this week’s newsletter below.
=========
WHAT YOU NEED TO KNOW
 WRECKING HAVOC WHILE TRYING TO HOLD IT ALL TOGETHER!
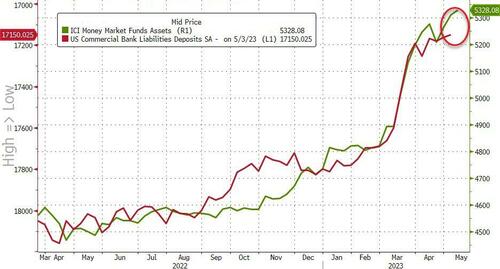
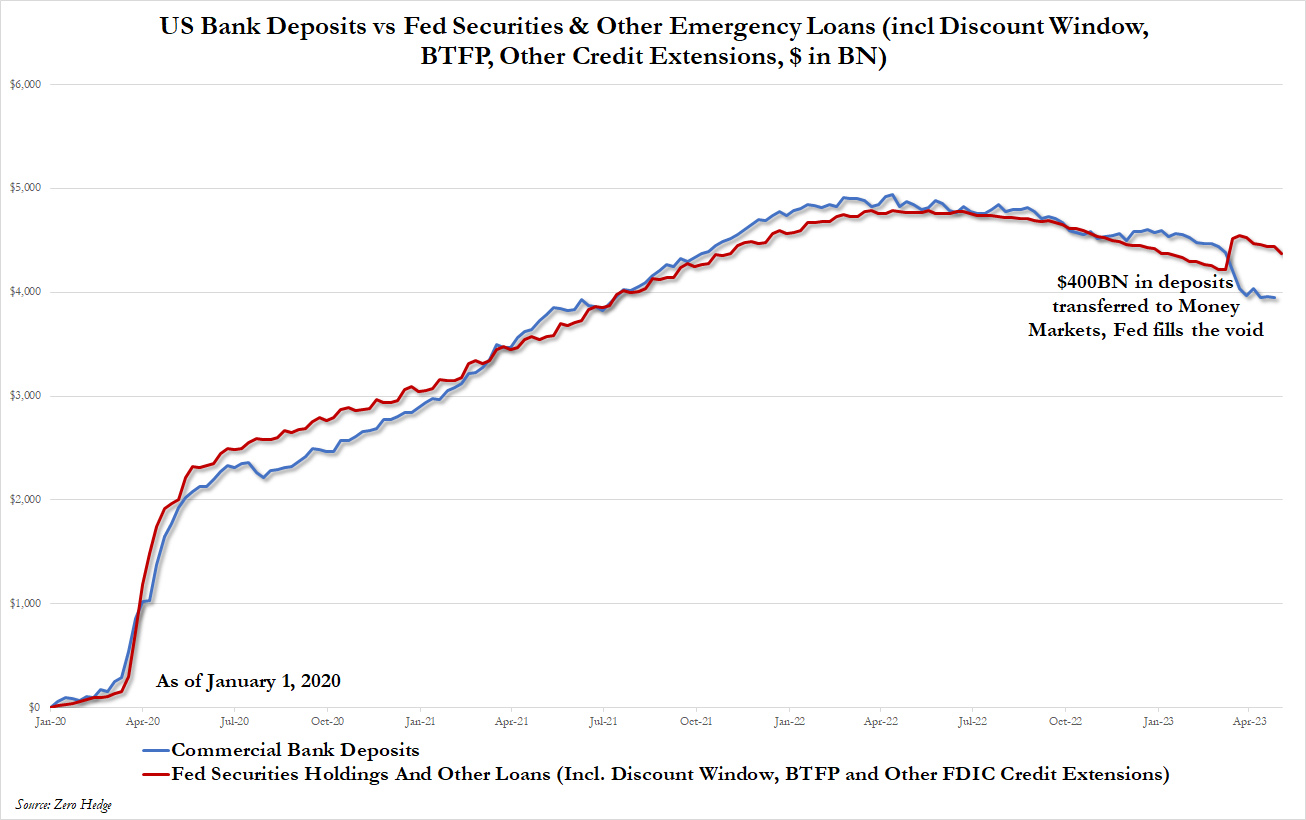
Money Market Funds saw $18.3 billion of inflows, pushing the aggregate to a record high of $5.328 TRILLION. That is almost $120 billion of inflows in the last three weeks! Retail funds saw over $12 billion in inflows while institutional was $6 billion. This is money coming out of bank deposits which has been lent out by the banks at the regulated 10X (actually much more). This means the banks have BIG liquidity, profit and capittal adequacy problems that are only getting worse every day the fed funds rate stays elevated!!
DESTABILIZING SHOCK WAVES – Sequential Series of Broadening Cascading Shocks
-
- Through poor Monetary, Fiscal & Pubic Policy we have inserted Instability & Complexity into a fragile Global Financial System.
- This has and continues to manifest itself into a broadening series of cascading financial shocks.
- The Federal Reserve’s Securities and Emergency Loans have abruptly mitigated a significant amount of the efforts of Quantitative Tightening (QT). The Federal Reserve has effectively lost control of Monetary Policy due to fighting inflation caused by excess historic Fiscal Spending.
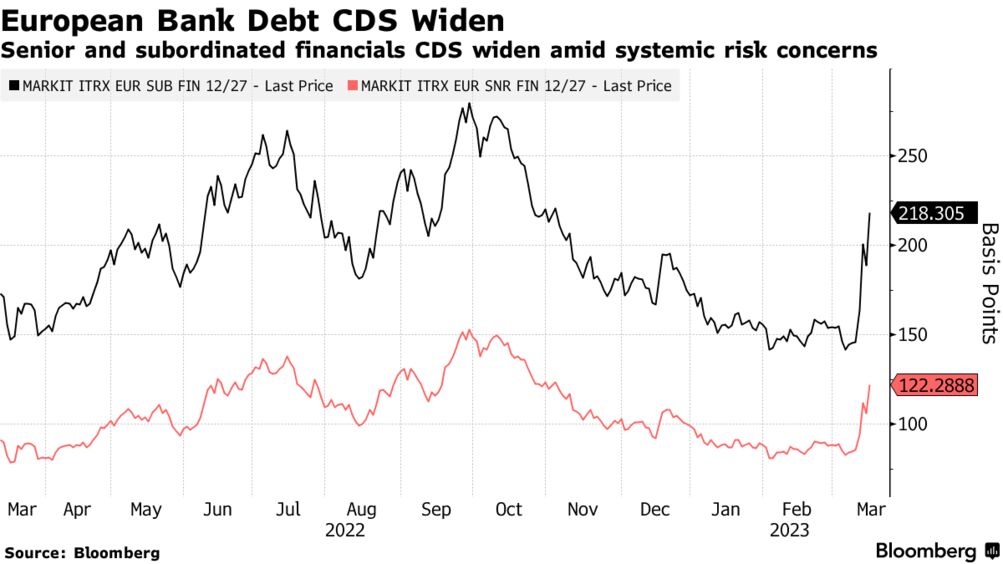
EUROPEAN BANKS – Riskier Than US Banks
-
- European banks have strengthened their balance sheet with a very risky and volatile instrument called contingent convertible hybrid bonds. This may seem irrelevant, but if they can change fast and when they do, it takes years to recover, as we saw in the 2011 crisis.
- Convertible Hybrid Bonds currently look incredibly attractive due to the high yield they have, but they can create a negative domino effect on the equity of the firm when things turn sour. Furthermore, European banks’ core capital, though stronger than in 2009, can deteriorate rapidly in a declining market.
- Another distinct exposure within European banks is how fast the ratio of non-performing loans has historically shown to deteriorate.
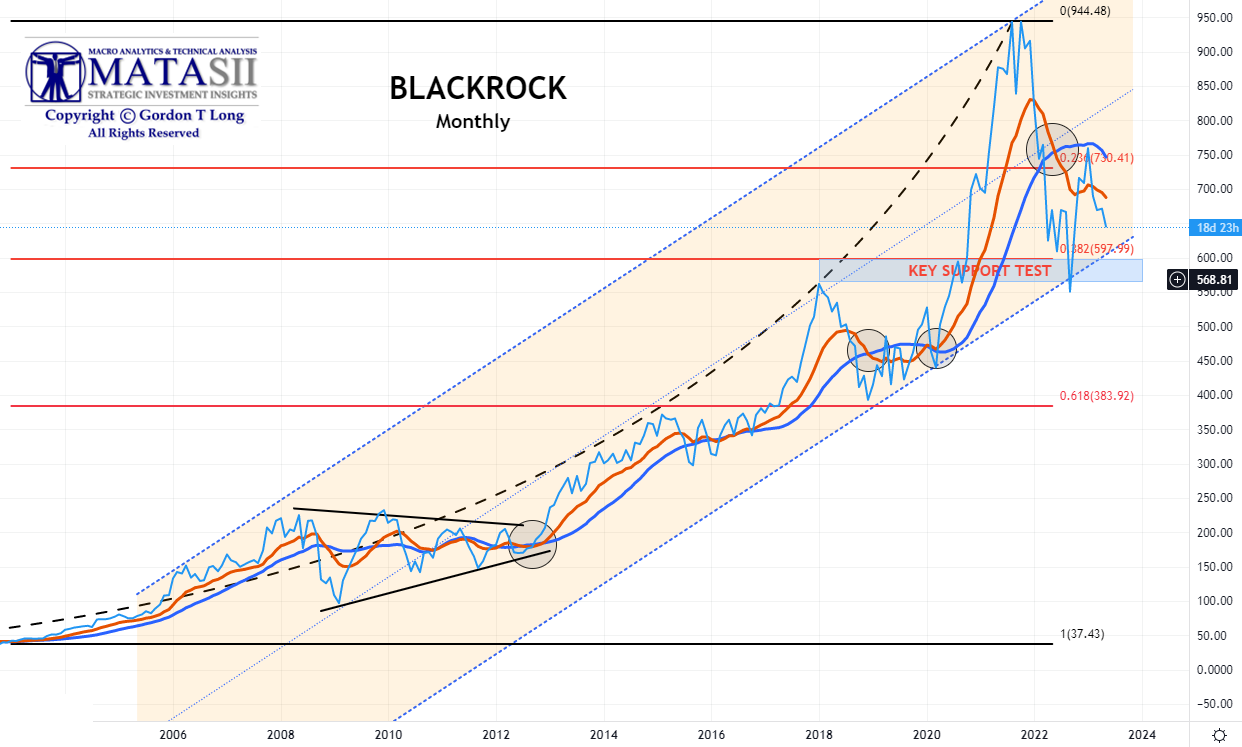
- Keep BlackRock on your radar as a catalyst for European Banking Problems. Blackrock is more heavily exposed to Europe than the US pension systems (still heavily exposed to both) with ~ 9 TRILLION in AUM. Blackrock’s deteriorating balance sheet, falling asset prices, ESG backlash, rising rates and falling cash flow have placed it in a very tenuous position.
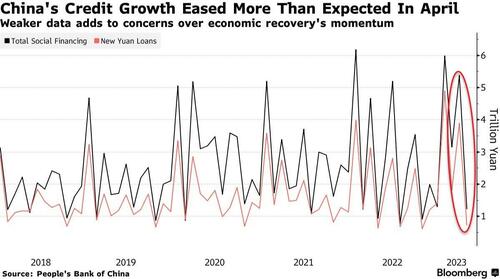
CHINESE CPI/PPI & TRADE – Increasingly Seen Not To Be The Global Economic Saviour 2023 /2024
-
- The Chinese Trade Balance widened to USD 90.21B in April (exp. 71.6B, prev. 88.19B).
- Export growth slowed in April, reversing almost all of the increase in March, indicating weak global demand.
- Import volumes unexpectedly dropped to their lowest levels in 12 months.
- China’s trade surplus is likely to decline with a recession expected within most developed economies later this year.
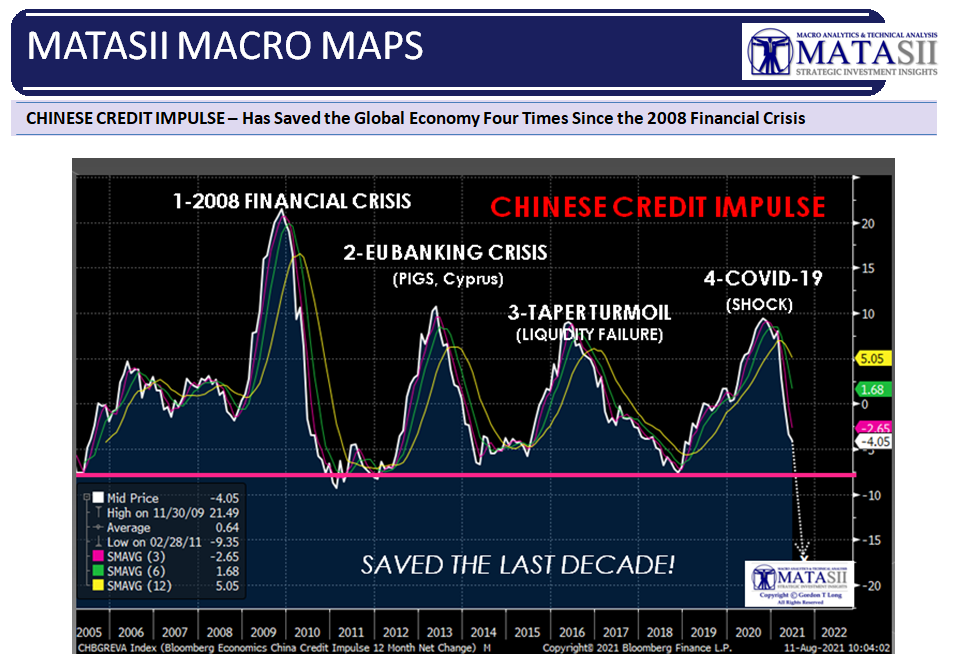
- China and the Chinese Credit Impulse is increasingly showing that its post Covid reopening is not going to be able to save the global economy for the fourth time in a decade and half. This is likely to mean a “hard landing’ for the US Economy.
US ECONOMIC INDICATORS – Weakening Inflation With Increasing Jobless Claims
INFLATION
-
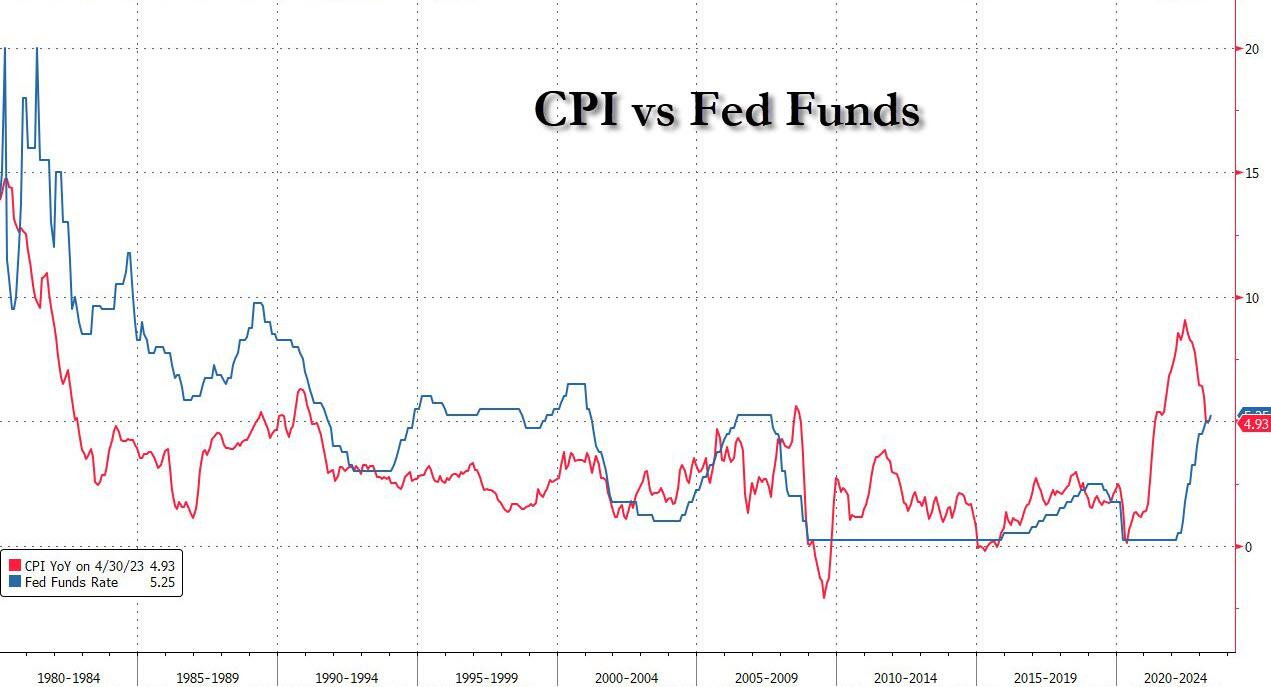
- CPI: Headline April CPI came in slightly cooler than expected at 4.9% Y/Y, the first sub-5% figure since April 2021 and against the expected unchanged pace of 5.0%, coming also on the low end of analyst forecasts that ranged between 4.8-5.2%.
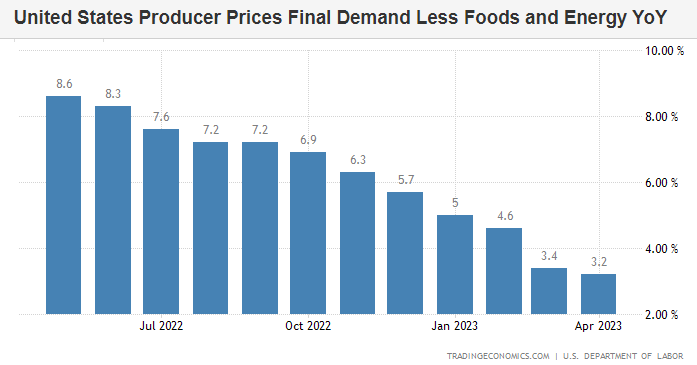
- PPI: US producer prices in April rose 0.2% M/M, less than the expected 0.3% rise, while the prior month was revised to a 0.4% decline from an initial 0.5% decline. The Y/Y figure fell to 2.3% from 2.7%, a larger fall than the expected 2.4%, remaining at the lowest levels since January 2021.
EMPLOYMENT
-
- INITIAL JOBLESS CLAIMS: Initial jobless claims soared to 264k (exp. 245k, prev. 242k) above the upper end of the expected forecast range of 260k. Meanwhile, continued claims rose to 1.813mln (prev. 1.801mln), but short of the 1.82mln consensus.
- SLOOS: Banks cited a less favorable or more uncertain economic outlook, reduced tolerance for risk, deterioration in collateral values, and concerns about banks’ funding costs and liquidity positions.
CONFIDENCE & SENTIMENT
-
- U of M SENTIMENT: MICHIGAN SURVEY: The prelim UoM survey for May saw sentiment fall to 57.7 from 63.5, well beneath the expected 63.0, printing the lowest since July 2022. Current conditions and forward-looking expectations also disappointed, falling to 64.5 (exp. 67.0, prev. 68.2) and 53.4 (exp. 59.8, prev. 60.5), respectively.
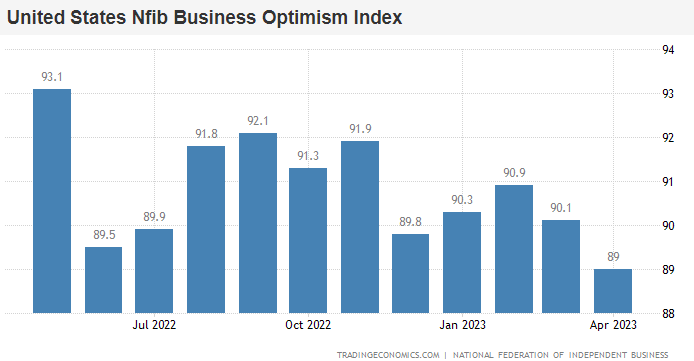
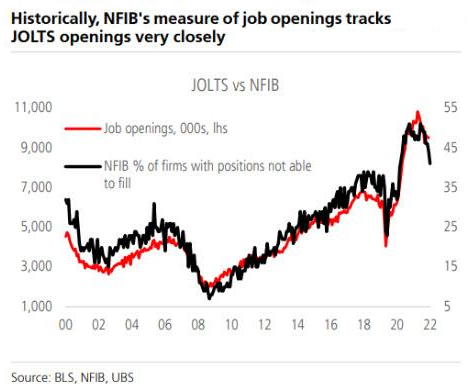
- SMALL BUSINESS: The NFIB measure of small business optimism fell to 97.4 in April from 98.7 in March, hitting a decade low with the report noting continued difficulties for small firms in finding experienced workers, with inflation still a major issue, albeit easing somewhat.
CONCLUSION
 THE NEGLIGENT MIS-APPRECIATION OF INSTABILTY & COMPLEXITY
INSTABILITY CREATION
-
- QE – Decade of Easy Money
- COVID-19 – Historic Fiscal Spending
- RATES Historic Rate of Interest Rates and Credit tightening.
GLOBAL COMPLEXITY
-
- Unintended Consequences & Moral Hazard
- A Decentralized and Unregulated World
- Global Expansion of Financialization, Globalization & Mercantilism
US IMPORT & EXPORT PRICES SIGNAL MASSIVE DEFLATIONARY IMPLUSE
-
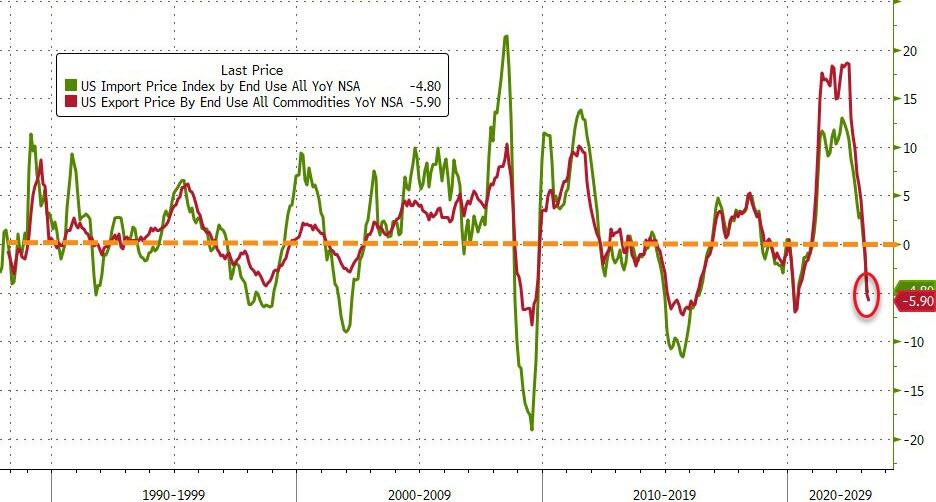
- US Import and Export price inflation utterly collapsed in April, down 4.8% YoY and 5.9% YoY respectively (chart below). A massive deflationary impulse is evidently heading into US inflation data.
DESTABILIZING SHOCK WAVES – Sequential Series of Broadening Cascading Shocks
 WITCH’S BREW OF INSTABILTY & COMPLEXITY
WE HAVE INSERTED INSTABILITY
-
-
- QE – Decade of Easy Money
- COVID-19 – Historic Fiscal Spending
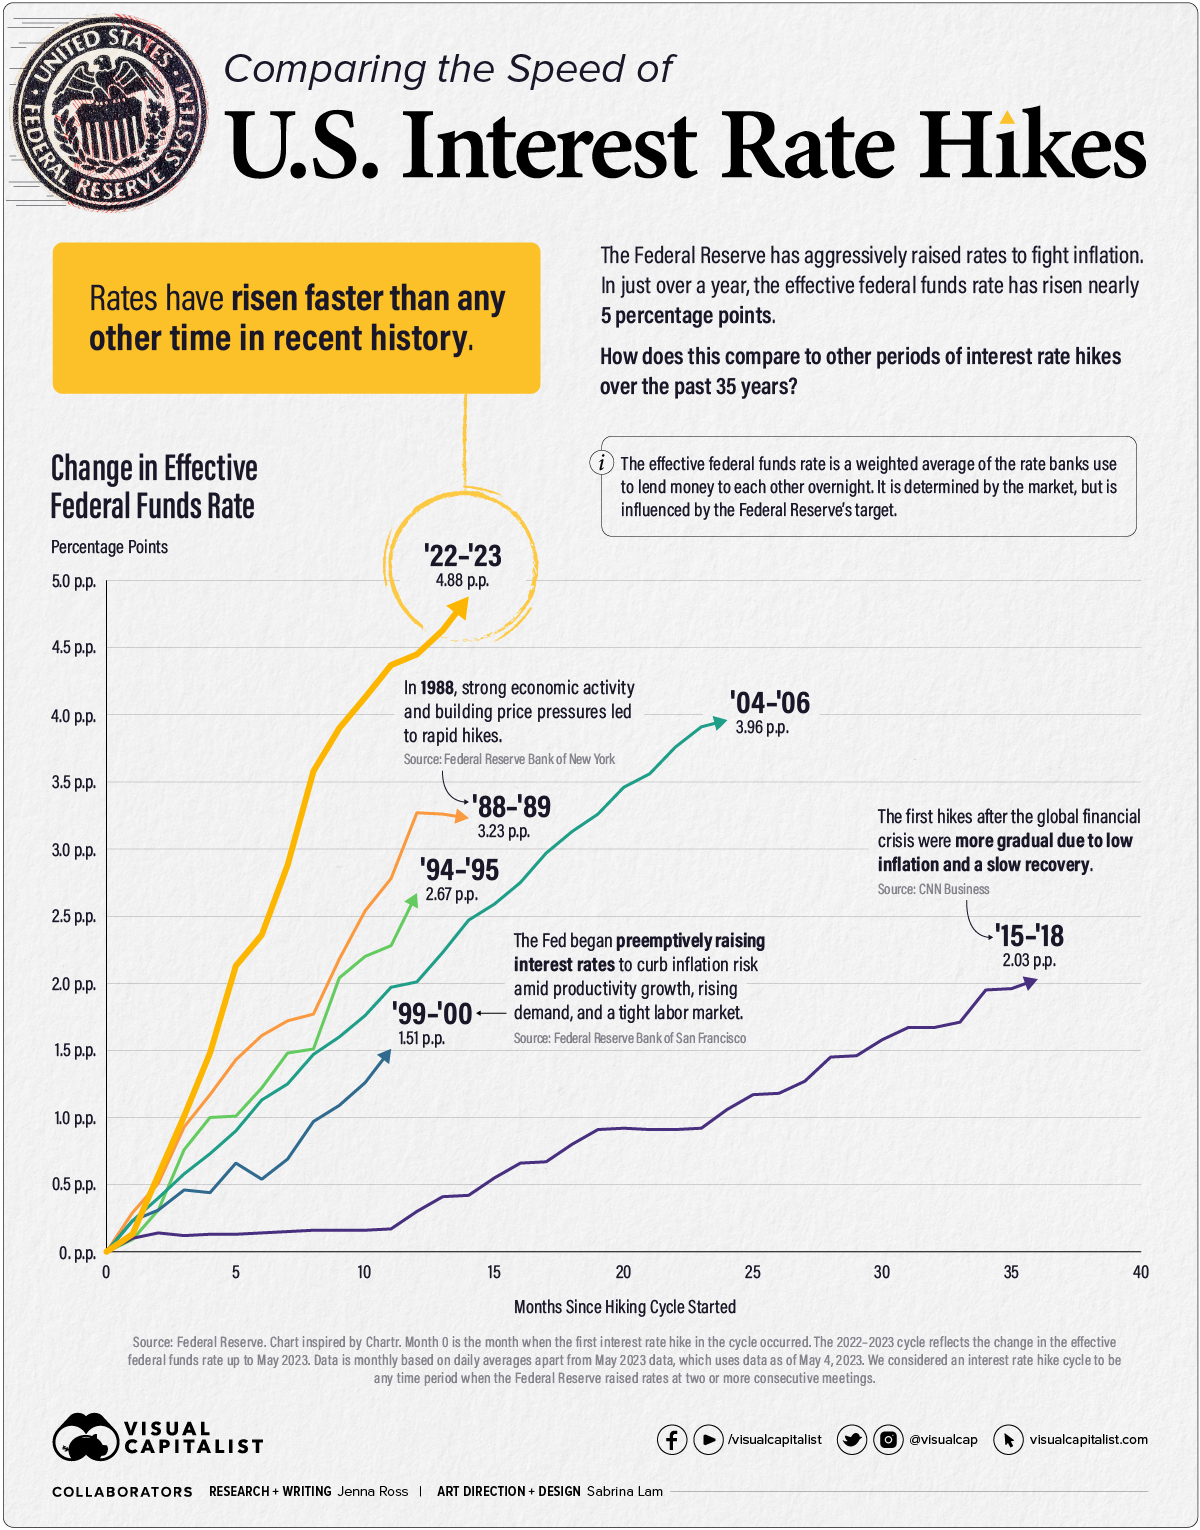
- RATES Historic Rate of Interest Rates and Credit tightening (Chart Right)
-
INTO A WORLD OF COMPLEXITY
-
-
- Unintended Consequences & Moral Hazard
- A Decentralized and Unregulated World
- Financialization, Globalization & Mercantilism
-
SEQUENTIAL SERIES OF BROADENING CASCADING SHOCKS:
SHOCK 1: COVID-19 – Policy Mishandling & Financial Spending
SHOCK 2: SUPPLY – Global Supply Chain Shutdown
SHOCK 3: INFLATION – 50 Year High Inflation
SHOCK 4: CREDIT – Credit & Lending Tightening
SHOCK 5: BANKING – Unrealized Capital Losses
SHOCK 6: LIQUIDITY -Tightening Lending Standards (We are Here)
SHOCK 7: COLLATERAL – Reverse Wealth Effect
WRECKING HAVOC WHILE TRYING TO HOLD IT ALL TOGTHER
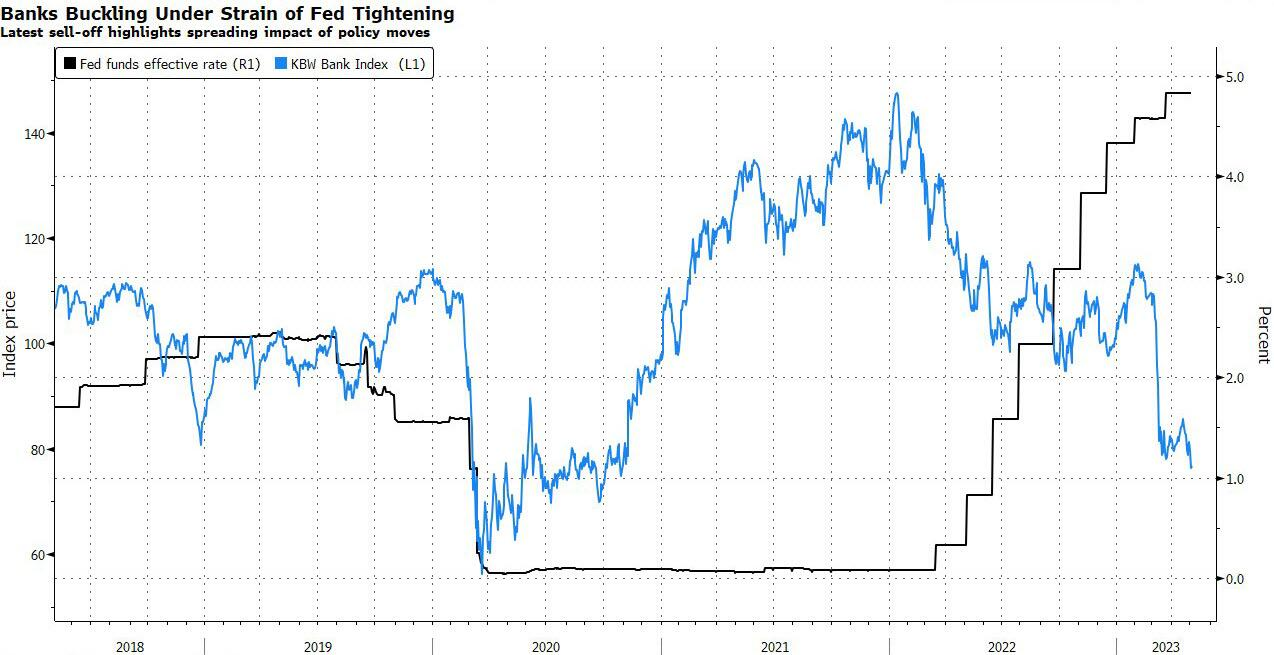
CHART ABOVE: In a world of finance built on Borrowing Short and Lending Long it is systemically exposed to an sustained inverted yield curve, where short term rates are higher than longer term rates.
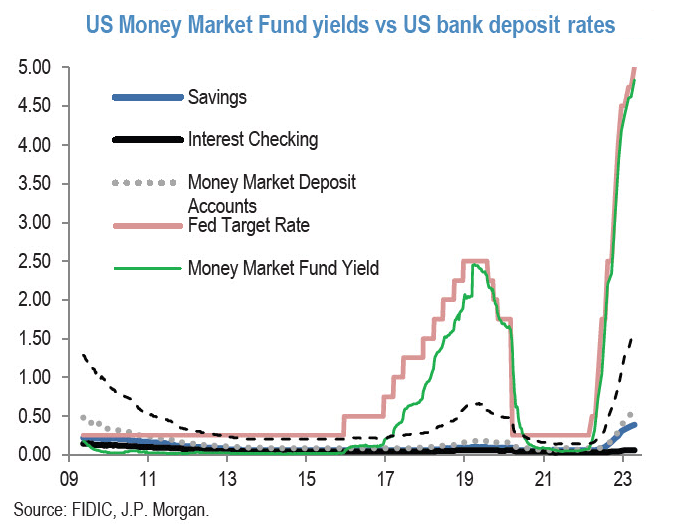
CHART ABOVE: Bank Deposits continue to flee to high earning Money Market Funds, leaving banks with excess loan assets. This is forcing accelerated tightening of lending standards at a historic rate. The resut is a destabilizing shock to the financial and economic system.
CHART BELOW
The Federal Reserve’s Securities and Emergency Loans have abruptly mitigated a significant amount of the efforts of Quantitative Tightening (QT). The Federal Reserve has effectively lost control of Monetary Policy due to fighting inflation caused by excess historic Fiscal Spending.
A CASCADING WATERFALL HAS BEEN TRIGGERED
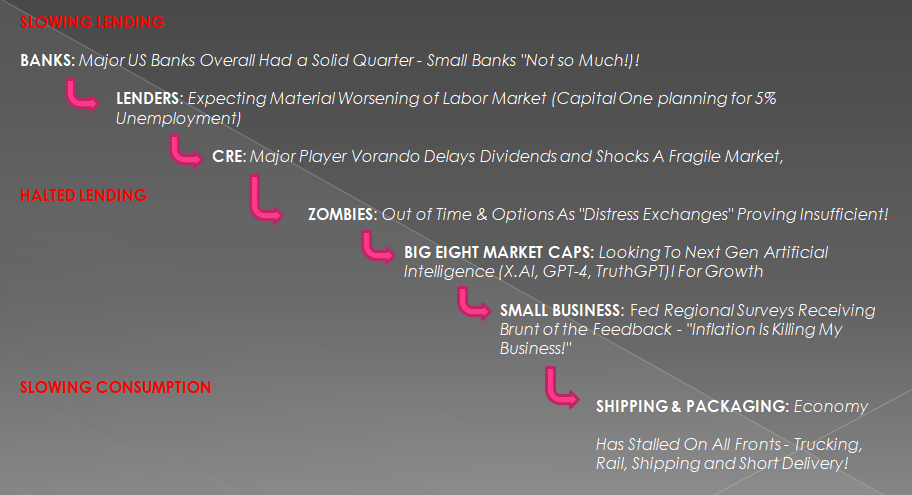 In the last newsletter we laid out some of the details we witnessed during the first three weeks of Q1 Earnings season regarding the following elements. A simplistc way of looking at what is underway is to consider them in the context of a “Waterfall”.
SLOWING LENDING
-
- BANKS: Major US Banks Overall Had a Solid Quarter – Small Banks “Not so Much”!
- LENDERS: Expecting Material Worsening of Labor Market (Capital One planning for 5% Unemployment)
- CRE: Major Player Vorando Delays Dividends and Shocks A Fragile Market
HALTED LENDING
-
- ZOMBIES: Out of Time & Options As “Distress Exchanges” Proving Insufficient!
- BIG EIGHT MARKET CAPS: Looking To Next Gen Artificial Intelligence (X.AI, GPT-4, TruthGPT) For Growth
- SMALL BUSINESS: Fed Regional Surveys Receiving Brunt of the Feedback – “Inflation Is Killing My Business”
SLOWING CONSUMPTION
-
- SHIPPING & PACKAGING: Economy Has Stalled On All Fronts – Trucking, Rail, Shipping and Short Delivery!
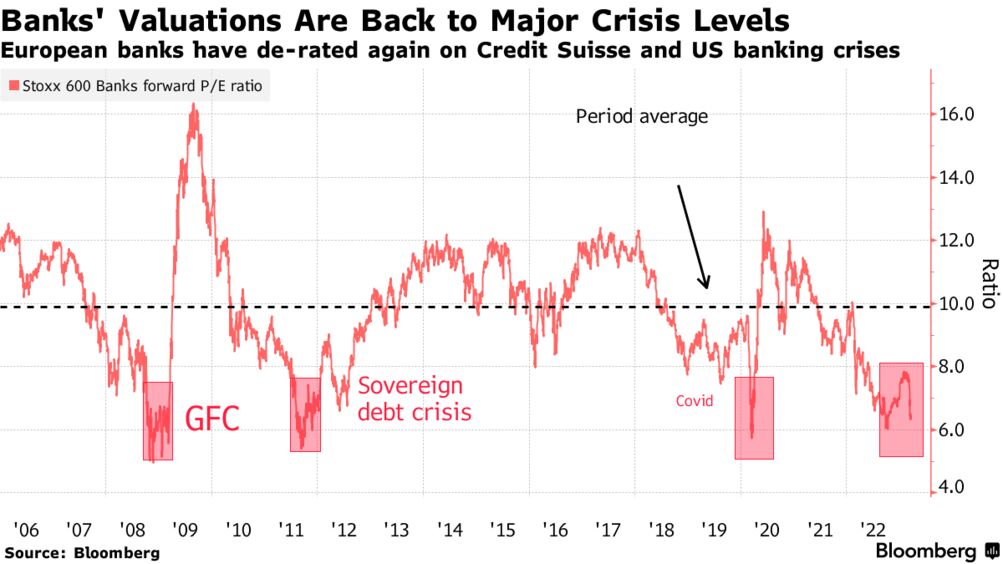
EUROPEAN BANKS – Riskier Than US Banks
 GLOBAL BANKS OVERALL
Years of negative real rates and expansionary monetary policy have created numerous bubbles. This leaves banks with loans supported by collateral that may suddenly be insufficent, as we saw in the 2008 GFC with housing prices.
-
- The risk in the banks’ balance sheet is not just on diminishing deposits on the liability side, but a declining valuation of the profitable and investment part of the assets.
- Banks are so leveraged to the cycle and the expansion of monetary policy that they simply cannot offset the risk of a 20% loss on the asset side, a significant rise in non-performing loans or the write-off of the riskiest investments.
- The level of debt is so high that few banks can raise equity when things get worse.
 EUROPEAN BANKS
-
- European banks have strengthened their balance sheet with a very risky and volatile instrument, contingent convertible hybrid bonds. These look incredibly attractive due to the high yield they have, but they can create a negative domino effect on the equity of the firm when things turn sour. Furthermore, European banks’ core capital is stronger than in 2009, but it can deteriorate rapidly in a declining market.
- European banks lend massively to governments, public companies and large conglomerates. The contagion effect of a rising concern about sovereign risk is immediate. Additionally, many of these large conglomerates are zombie firms that cannot cover their interest expenses with operating profit. In periods of monetary excess, these loans seem extremely attractive and negligible risk, but any decline in confidence in sovereigns can rapidly deteriorate the asset side of the financial system rapidly.
- According to the ECB, euro area banks’ exposures to domestic sovereign debt securities have risen significantly since 2020 in nominal amount. The share of total assets invested in domestic sovereign debt securities has increased to 11.9% for Italian banks and 7.2% for Spanish banks, and close to 2% for French and German banks. However, this is only part of the picture. There is also a high exposure to state-owned or government-backed companies. One of the main reasons for this is that the Capital Requirements Directive (CRD) permits a 0% risk weight to be assigned to government bonds.
- European banks have strengthened their balance sheet with a very risky and volatile instrument – contingent convertible hybrid bonds. This may seem irrelevant, but it changes fast and when it does it takes years to recover, as we saw in the 2011 crisis.
- Another distinct feature of European banks is how fast the ratio of non-performing loans may deteriorate. When the economy weakens or stagnates, loans to small and medium enterprises and families become riskier and the lack of a diversified and alternative lending system like the U.S. has, means that the credit crunch hurts the real economy in a deeper way. We can all remember how non-performing loans went quickly from a manageable 3% of total assets to up to 13% in some firms in two years between 2008 and 2011.
- European banks’ assets are more exposed to sovereign risk and the worsening of solvency in small businesses, but also significantly exposed to large zombie industrial firms.
- The latest lending survey of the ECB shows that credit standards are tightening across the board for enterprises, households and real estate lending. When the real economy is 80% financed through bank loans and banks are heavily exposed to sovereign risk, the domino effect of a weaker economic environment on the financial system comes from all sides. Most specifically from the allegedly low-risk government link, and the higher risk small and medium sized businesses.
- So far, analysts are saying -again- that the banking crisis has nothing to do with Europe, because regulation is stronger and capitalization is more robust. The same consensus was evident and is being repeated from 2008.
- Depositors have withdrawn €214bn from eurozone banks over the past five months, with outflows hitting a record level in February, according to the FT and the ECB. It is not true that deposit flight is not an issue in Europe.
- The biggest mistake European authorities and investors can make is to think again that this time is different, and the banking crisis will not hit the euro area system.
- It is important to strengthen the core capital base, buy-back the convertible bonds that may wipe out the equity and put in place strong procedures to avoid a sovereign-to-real economy negative effect.
- The combination of ignorance and arrogance led Europeans to believe they were immune to the 2008 crisis, because they believed in the miraculous power of their bureaucratic and bloated regulation. No amount of regulation helps when the rules are all designed to allow rising exposure to almost-insolvent governments under the excuse that it requires zero capital and has no risk.
- Sovereign risk is the worst risk of all. European banks should not fall into the trap of thinking that tons of rules will eliminate the risk of a financial system crisis.
BLACKROCK EXPOSURE – Keep BlackRock On Your Radar!
Blackrock is more heavily exposed to Europe than the US pension systems (still heavily exposed to both) with ~ 9 TRILLION in AUM. Blackrock’s deteriorating balance sheet, falling asset prices, ESG backlash, rising rates and falling cash flow have placed it in a very tenuous position.
All of that $9T AUM rests on a very slim pile of shareholder equity, $38.2 billion to be precise. Stripping out things like “Goodwill” and “Intangible Assets” from the asset side of the balance sheet, which accounts for $33.6B (since these are simply piles of ‘value’ leftover from previous M&A activity, brand equity, etc., that may or may not have any real value), it leaves Larry Fink and Blackrock with less than $5 billion in shareholder equity. .
It is also staring at more than $55 billion in “Other liabilities” which is very likely derivative exposure that the company can play very fast and lose with, since it was over $90 billion in 2021, and $120 billion in both 2019 and 2020.
These are some pretty big exposures!!. Does Blackrock actually have any equity today to continue or is there a much bigger game going on here?
Last year when the UK pension crisis developed which took out Prime Minister Liz Truss and forced the Bank of England to intervene, the one holding the bag on the failing assets there was none other than Blackrock. They were the ones in trouble who sold these leveraged CLOs — Collateralized Loan Obligations — to the UK state pensions which ran out of money to pay pensioners.
Now, is Blackrock, which was built on the same premise as Silicon Valley Bank, using non-balance sheet activity to resist being regulated as a SIFI? is BlackRock staring at a crisis if yields keep rising? ANSWER TO BOTH: YES!!!
BLACKROCK REMINDS ME OF the WORST OF
AIG + LEHMAN + BEAR STEARNS in 2008!
CHINESE CPI/PPI & TRADE
 CPI / PPI
-
- Chinese CPI rose +0.1% Y/Y in April (exp. 0.4%, prev. 0.7%), the slowest rate of increase since February 2021; the monthly measure fell 0.1% (expectations unchanged).
- Producer prices declined -3.6% Y/Y in April (exp. -3.2%, prev. -2.5%).
- Pantheon Macroeconomics noted that inflation was weak as the country reopened and the recovery was lopsided amid feeble global demand and increased output. Consumers were found to be spending more on restaurants, leisure services and tourism, after the ending of zero-Covid policy, but less so on goods.
- “The divergence between services and goods inflation is likely to continue, as the services rebound outpaces domestic spending on goods,” Pantheon says, “the government is likely to provide only targeted consumption measures in the next couple of months, but we see an increasing chance that slowing growth in Q2 will prompt a broader policy response in H2.”
TRADE
-
- The Trade Balance widened to USD 90.21bln in April (exp. 71.6bln, prev. 88.19bln). Capital Economics notes that export growth slowed in April, reversing almost all of the increase in March, indicating weak global demand. Import volumes unexpectedly dropped to their lowest levels in 12 months, but CapEco said a rebound was expected due to the reopening of the economy driving domestic demand. Still, it thinks that China’s trade surplus is likely to decline, and a recession is expected in most developed economies later this year. ING notes that crude oil imports in April fell to an average of 10.36mln BPD (vs prev. 12.37mln, and 10.52mln Y/Y), which it attributes to lower operating rates due to maintenance.
CHINA WILL NOT LIKELY BE ABLE TO SAVE THE GLOBAL ECONOMY FOR THE FOURTH TIME IN THE LAST DECADE AND A HALF!
ECONOMIC INDICATORS
INFLATION
 CPI
CPI
-
- EXPECTATIONS: Going into the CPI release for April consensus was a rise of 0.4% M-o-M leading to an annual increase of 5.0%; for core inflation, consensus expectations were for a 0.3% print, and a 5.5% annual increase. Within core inflation, BofA expected core goods inflation to rise by 0.2% M-o-M and core services inflation increased by 0.4% M-o-M.
- ACTUAL: Headline April CPI came in slightly cooler than expected at 4.9% Y/Y, the first sub-5% figure since April 2021 and against the expected unchanged pace of 5.0%, coming also on the low end of analyst forecasts that ranged between 4.8-5.2%. The M/M reading rose 0.4%, in line with expectations but accelerating from the 0.1% print in March. Meanwhile, the services less rent of shelter rose 0.1%, accelerating from the prior 0.0%. The core metrics were in line with expectations with Y/Y at 5.5% cooling from 5.6%, and the M/M rose 0.4%, matching the prior pace. The cooler headline helped offset fears into the release of a hot print, and keeps the door open for the Fed to initiate a pause in June. However, there is plenty of data left between now and the June FOMC, including another CPI and NFP report, the April PCE, and two PPI reports. Fed’s Barkin (non-voter), speaking to AP News, said the latest figures reflected some one-time fluctuations — sharp drops in airline fares and hotel room prices, for example, and a spike in the cost of used cars — that may not persist, “just looking through all that it still paints a picture of inflation that is stubbornly high”. Meanwhile, WSJ’s Timiraos penned a piece saying the report reinforces the Fed’s plans to pause.
CHART BELOW
With the CPI falling to 4.93% and the Fed Funds Rate at 5.25%, this finally gives the Federal Reserve a little “breathing room” in its fight against inflation. The Fed will now likely maintain this level until the broadening liquidity crisis forces them to “pivot”. We suspect they ideally woud like to see 2-3 more monthly CPI prints before they are forced to “pivot”. Why?
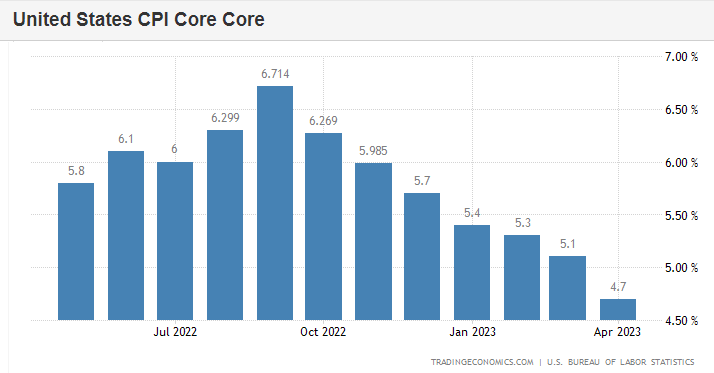
The problem and the inconvenient truth is that Core CPI remains at 5.5% (which is exactly where it was back at the end of a very spirited 2021). US headline CPI averaged … 1.6%; over the past six months, Core CPI has averaged … 6.0%.
 PPI
PPI
-
- EXPECTATIONS: The consensus expected a 0.3% M/M headline PPI increase following the 0.5% drop in March. This would result in the y/y rate falling to 2.5% from 2.7%. The increase would be driven by a rise in energy and food prices. Excluding food and energy, core PPI would rise by a modest 0.2% m/m, reversing the prior month’s decline. However, this would lead the y/y rate to fall to 3.3% from 3.4%. Trade services (margins) were a big drag on core PPI in March, declining by 0.9% m/m, but BofA expected a more modest decline of 0.2% m/m this month. Last, look for core-core PPI, which excludes food, energy and trade services, to rise by 0.2% m/m or 3.4% y/y.
- ACTUAL: US producer prices in April rose 0.2% M/M, less than the expected 0.3% rise, while the prior month was revised to a 0.4% decline from an initial 0.5% decline. The Y/Y figure fell to 2.3% from 2.7%, a larger fall than the expected 2.4%, remaining at the lowest levels since January 2021. The headline figures were weighed on by deflation in final demand foods and transportation and warehousing, while inflation forces came from the rebound in energy prices. Meanwhile, Core PPI rose 0.2% M/M, as expected, and unwinding last month’s 0.1% decline, with core services component alarmingly rising to +0.4% from +0.2% while core goods were more contained at +0.2%. The Core Y/Y rose 3.2%, beneath the expected 3.3% rise and down from the prior 3.4%.
EMPLOYMENT
I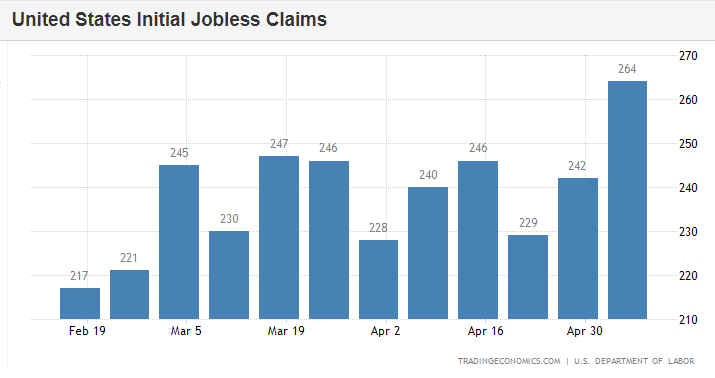 NITIAL JOBLESS CLAIMS:
-
- ACTUAL: Initial jobless claims soared to 264k (exp. 245k, prev. 242k) above the upper end of the expected forecast range of 260k. Meanwhile, continued claims rose to 1.813mln (prev. 1.801mln), but short of the 1.82mln consensus. Although the April jobs data surprised to the upside, the latest jobless claims data are consistent with loosening labour market conditions. It is worth noting, with the rise higher in claims it pushed the four-week moving average to 245k, the highest since August 2022. As such, Oxford Economics, “evidence of cooling demand for labor will allow the FOMC to refrain from raising rates at the June meeting”.
SLOOS:
We believe that today’s Senior Loan Officer Opinion survey (SLOOS). was the week’s most important event. The SLOOS is a leading indicator to virtually every key US data metric.
-
- EXPECTATIONS: Goldman expects that the lending standards measure for commercial and industrial (C&I) loans in the Fed’s April Senior Loan Officer Opinion Survey tightened by 15.4pt to 60.2, reflecting an increase of 33.3pt to 77.0 for small banks and a more modest increase of 10.3pt to 56.0 for large banks. This would bring the SLOOS’s measure of C&I lending standards to a level tighter than the dot-com crisis, if still less extreme than during the financial crisis or the height of the pandemic. A few more bank failures, however, and we will have a new record print. The April SLOOS typically reflects responses collected between the last week of March and the first week of April.
-
- ACTUAL: Banks cited a less favorable or more uncertain economic outlook, reduced tolerance for risk, deterioration in collateral values, and concerns about banks’ funding costs and liquidity positions.
-
- Banks reported expecting to tighten standards across all loan categories.
- Banks most frequently cited an expected deterioration in the credit quality of their loan portfolios and in customers’ collateral values, a reduction in risk tolerance, and concerns about bank funding costs, bank liquidity position, and deposit outflows as reasons for expecting to tighten lending standards over the rest of 2023.
- In other words, while today’s SLOOS may not have been as dire as some had expected, the credit crunch is just starting as banks expect “to tighten standards across all loan categories.”
- All of this assumes there will be no more bank failures which, as we explained earlier today, is simply idiotic since the Fed continues QT…
SPECIAL QUESTION ON COMMERICAL REAL ESTATE (CRE) CONCERNS
The April SLOOS included a special question inquiring about banks’ changes in lending policies for CRE loans over the past year; about the reasons why banks changed standards for all loan categories over the first quarter; and about banks’ expectations for changes in lending standards over the remainder of 2023 and reasons for these changes.
-
- Banks reported having tightened all the terms surveyed on all categories of CRE loans.
- For construction and land development loans, major net shares of banks widened the spread on loan rates, lowered loan-to-value ratios and increased debt service coverage ratios.
- Significant shares of banks decreased maximum loan size and market areas covered.
- A moderate net share of banks shortened the length of interest-only payment periods, and a modest net share of banks decreased maximum loan maturity.
- For nonfarm nonresidential loans, major net shares of banks widened the spread on loan rates and lowered the loan-to-value ratio; significant net shares of banks increased debt service coverage and decreased maximum loan size and market areas served; moderate net shares of banks shortened length of interest-only payment period and decreased the maximum loan maturity.
- For multifamily loans, major net shares of banks widened the spread on loan rates and lowered the loan-to-value ratio; significant net shares of banks increased debt service coverage and decreased maximum loan size; and moderate net shares of banks decreased the length of interest-only payment periods, market areas served, and maximum loan maturity.
- BOTTOM LINE: This should come as a surprise to nobody, banks reported tightening lending policies for all categories of CRE loans over the past year, with the most frequently reported changes pertaining to wider spreads of loan rates over banks’ cost of funds and lower loan-to-value ratios.
CONFIDENCE & SENTIMENT
-
 I have warned for years that the banks could start collapsing for the precise reason that they’re collapsing now. The Fed kept interest rates at zero for so long. That’s what allowed these financial institutions to load up on overpriced, low-yielding Treasuries, mortgage-backed securities and other loans. Plus, US government auditors from the FDIC encouraged the banks to buy these long-term Treasuries and mortgage-backed securities, because they gave them favorable accounting treatment. The banks didn’t have to mark them to market as long as they could pretend they would hold them to maturity. So, the whole house of cards was erected by the Fed and the US government. And now it’s collapsing, and they’re acting like they have nothing to do with it. They’re trying to figure out how to put out a fire that they lit. And of course, they’re not putting out the fire. They’re pouring gasoline on it.
UNIVERSITY OF MICHIGAN – SENTIMENT
-
- ACTUAL: MICHIGAN SURVEY: The prelim UoM survey for May saw sentiment fall to 57.7 from 63.5, well beneath the expected 63.0, printing the lowest since July 2022. Current conditions and forward-looking expectations also disappointed, falling to 64.5 (exp. 67.0, prev. 68.2) and 53.4 (exp. 59.8, prev. 60.5), respectively. Meanwhile, 1yr inflation expectations fell slightly to 4.5% (prev. 4.6%), but the longer term 5-10yr rose to 3.2% (prev. 3.0%), the highest since 2011.
SMALL BUSINESS:
-
- ACTUAL: The NFIB measure of small business optimism fell to 97.4 in April from 98.7 in March, hitting a decade low with the report noting continued difficulties for small firms in finding experienced workers, and inflation still a major issue, albeit easing somewhat. Oxford Economics highlights the lack of signs in the report of a significant credit crunch, with just 6% of firms reporting credit is hard to get in April. Nonetheless, “that measure lags the Senior Loan Officer Survey (SLOOS) measure of bank lending standards, which points to a sharp drop in bank lending over the second half of the year.” Meanwhile, despite firms reporting tight labour markets, “wage and price setting expectations continue to moderate, consistent with an ongoing slowdown in wage and price inflation”, the consultancy concludes.
CONCLUSION
THE NEGLIGENT MIS-APPRECIATION OF INSTABILTY & COMPLEXITY
CREATION OF INSTABILITY
-
- QE – Decade of Easy Money
- COVID-19 – Historic Fiscal Spending
- RATES Historic Rate of Interest Rates and Credit tightening.
.. inserted into:
GLOBAL COMPLEXITY
-
- Unintended Consequences & Moral Hazard
- A Decentralized and Unregulated World
- Global Expansion of Financialization, Globalization & Mercantilism
… results in:
RESULT
-
- A HIGH PROBABLITY SYSTEMIC FAILURE
US IMPORT & EXPORT PRICES SIGNAL MASSIVE DEFLATIONARY IMPLUSE
US Import and Export price inflation utterly collapsed in April, down 4.8% YoY and 5.9% YoY respectively (chart below).
A massive deflationary impulse is evidently heading into US inflation data.
-
- Import prices ex-petroleum fell 0.1% m/m after falling 0.6% in March
- Capital goods prices fell 0.1% m/m after falling 0.1% in March
- Auto prices unchanged m/m after falling 0.2% in March
- Import prices ex-fuels unchanged m/m after falling 0.5% in March
- Industrial supplies prices rose 1.5% after falling 2.4% in March
- Consumer goods prices rose 0.2% m/m after falling 0.3% in March.
The S&P Is Up 8% In 2023; Without AI It Would Be Down 2%, Below 3,800
BEAR MARKETS HISTORICALLY HAVE DEVELOPED
WITH THE SAME TECHNICAL PROFILE!
BEAR MARKET TECHNICAL PROFILES
1- PARALLEL CHANNELS (We explored this last week.)
Last week I illustrated how predictive a basic technical analysis tool such as parallel trend channels can be. If drawn correctly and used in concert with other analytics it has proven to be extremely predictive. I have found them to be particularly accurate in long term set-ups. It is the old adage, the more data the more accurate the prediction!
Bear Markets are normally long term events. We believe we have entered one in the US S&P 500. To illustrate that, last week we explored 5 MAJOR LONG Bear Markets going back to 1966 (1966, 1973, 2000, 2008 & Today).
If history is any indication, then we should now be entering the “Capitulation” leg of this Bear Market taking us to new lows!
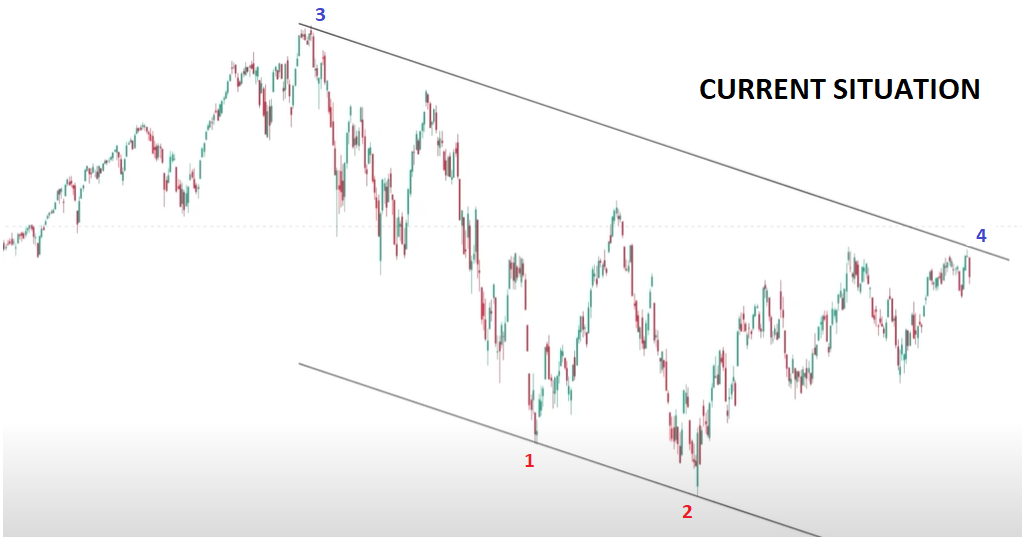
As the Bear Market develops we draw in the lower trend line when we have two strong points of support. This gives us the rate of decline allowing a projection of both time and price. We label those as point 1 and 2 in red above. Wth that, we then draw a parallel channel beginning with what we believe to be the beginning of the Bear Market. It is labeled by point 3 in blue above. The Bear Market is confirmed when price subsequently rises back to the parallel channel. We have labeled that point 4 in blue above. At that point the Bear Market begins its “Capitulation” leg down to new lower lows.
2- MOVING AVERAGES (This Week’s Focus)
Last week we left off with the establishment of the critical point 4 (above). As reliable as this point has been in Bear Markets, it requires further analytics to ensure that the markets don’t have more going on and that we are about to have a break away (in the case above – to the upside). What is required is the proper use of Moving Averages.
Moving Averages need to be used on three different time frames as measured minimally by Daily, Weekly and Monthly charts. Below we consider the current S&P 500 on a Daily basis with 50 / 100 / 200 DMAs, on a Weekly basis with 20 / 40 /80 WMAs and on a Monthly basis with 12 / 24 / 48 MMAs.
THE 200 DMA
As the long term S&P 500 indicates below, as represented by the SPY and produced by Real Investment Advice, it is quite clear that a distinctive relational pattern can be seen regarding the SPY’s price action. The 200 DMA acts as a “regression magnet”.
-
- When the price trend is either up or down the SPY then consistently stays above or below the correspondingly trending 200 DMA trend.
- There are examples where the price trend reverses and breaks through the 200 DMA trend. Importantly however, unless the 2000 DMA reverses, price action will quickly resume its prior trend relationship with the 200 DMA.

-
- When the market trades above its 200-day moving average, the average daily returns are much greater than the average since 1970, and volatility is much lower.
- Conversely, bear markets produce horrible returns, higher volatility and a more abnormal distribution of returns.
What is critical to understand is the trend reversal actions and process of the 200 DMA to know whether a trend reversal is actually occurring or that price action will resume its prior relationship?
The short-term graph below shows the SPY, its 200-DMA and the slope of the DMA. Slope quantifies the rate and direction in which the 200-dma is headed. The chart would suggest that the 200 DMA trend may be reversing, but is still down and somewhat flattening. This is a crtical point and requires further analytics to make an assessment from.

THE CONCEPT OF “BANDING”
Banding is the process where different moving averages are used in concert with each other.
-
- The three moving averages for each of the time frames will often close tightly together before signalling a directional change or as part of a “continuation” set-up.
- If a directional change is to occur, the Moving Averages will “restack” with staged crossings. On the Daily the 50 DMA will cross the 100 DMA and 200 DMA, then subsequently followed by the 100 crossing the 200 DMA.
50 / 100 / 200 DMA
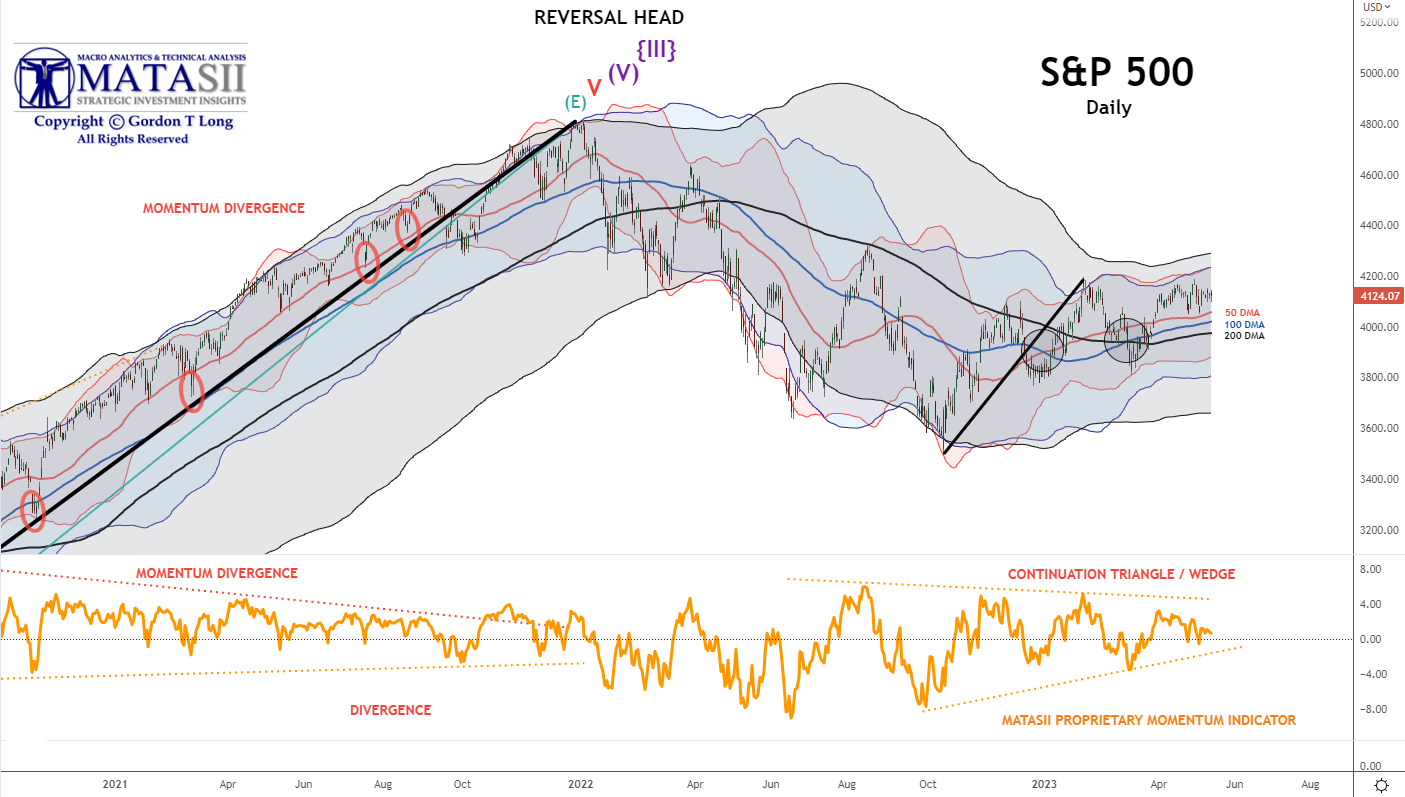
We can see below, in the current daily S&P 500 price chart, the 50 DMA (red), 100 DMA (blue) and 200 DMA (black).
-
- The black rising line on the right shows where a signiciant lift in price resulted in the Moving Averages Banding. They closed their gaps into a tighter pattern relative to each other.
- The Moving Averages then proceeded to “restack”. This is shown by the two circles on the right where the 50 DMA first crosses the 100 DMA and the second circle is where the 100 DMA crosses the 200 DMA.
- Though the “restacking” has occurred, caution must be heeded, because the Moving Averages are only marginally above being flat and still tightly “banded’. This is often seen as a signal of a consolidation of the prior trend before continuing with the prior directional trend.
- You will notice in the lower panel that the MATASII proprietary Momentum Indicator is currently signalling a Continuation Triangle or Wedge.
- To gain further insights on Direction and Timing we need to move “up” to the Weekly and Monthly MA’s.
YOUR DESK TOP / TABLET / PHONE ANNOTATED CHART
Macro Analytics Chart Above: SUBSCRIBER LINK
3- EXPANDING “DEGREE” TO WEEKLY & MONTHLY MOVING AVERAGES
The higher level Moving Averages offer more data points and hence are not as easily prone to giving false reversal signals. You may miss being early to a reversal, but your chances of getting it right have proven to be higher.
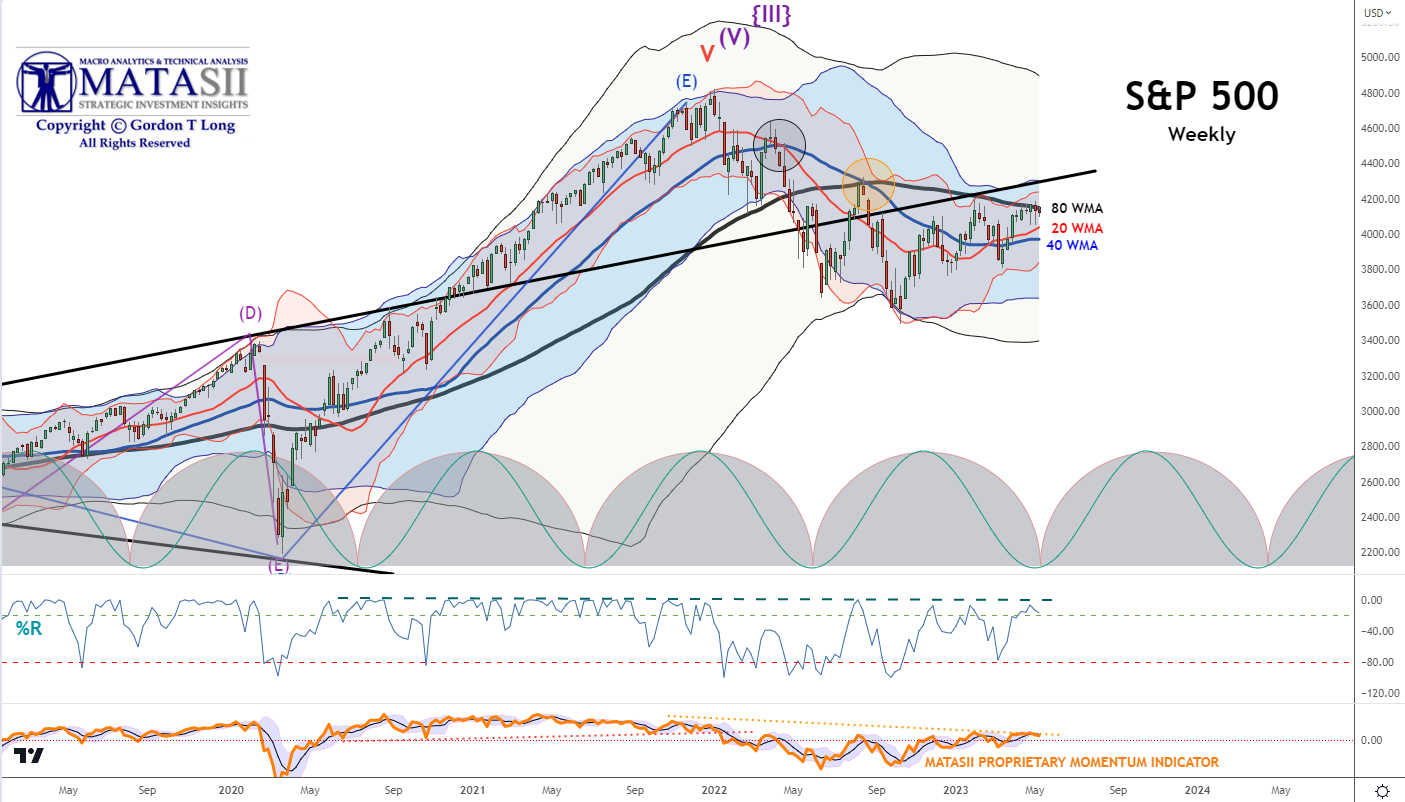
20 / 40 / 80 WMA
The 20 / 40 / 80 Weekly MA’s for the current S&P 500 are shown below.
-
- In this instance, the two circles highlight where the 20 WMA initially crossed the 40 WMA and where the 40 WMA crossed the 80 WMA. This stacking has been maintained until recently, when the 20 WMA crossed back over the 40 DMA to the upside.
- The 80 WMA is still pointed in a downward trend.
- The recent S&P 500 price lift has been stalled by the overhead resistance of the 80 WMA. It needs to break through before the 20 or 40 WMA can have any chance of breaking over the 80 WMA.
- The lower panel shows that oscillaters are suggesting we have reached overhead resistance that is likely to fail, (at least in the short term).
- The long term black trend line also suggests we are testing the underside resistance of it.
YOUR DESK TOP / TABLET / PHONE ANNOTATED CHART
Macro Analytics Chart Above: SUBSCRIBER LINK
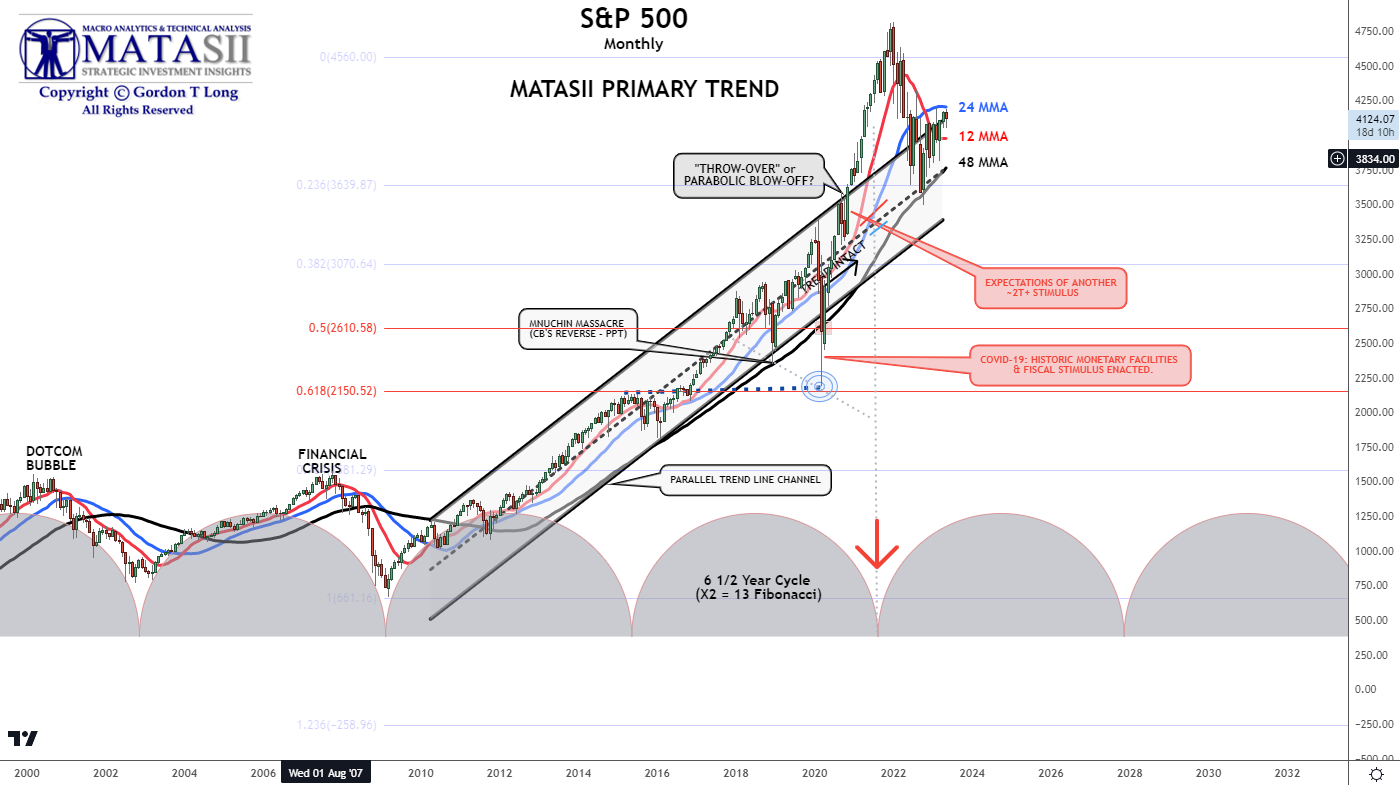
12 / 24 /48 MMA
When we look at a Monthly view using the 12 / 24 / 48 MMA’s we see:
-
- The long term trend for the S&P 500 is still UP, but it is attempting a reversal as shown by the movements in the Monthly 12 / 24 / 48 Moving Averages.
- The upper side of the long term parallel channel is currently acting as overhead resistance and aligns closely with the 24 MMA (blue) as resistance. It will take time below the 24 MMA to “bend” the 24 MMA potentially downwards.
- The 48 MMA is at exactly the mid-point of the rising parallel channel and looks like solid intermedaite term support.
- The half circle Cycle charts in the Monthly chart below and in the Weekly chart above is suggesting that a firm breakout one way or the other is likely closer to occurring in late summer, (closer to the final deadline for the Debt Ceiling before the US goes into potential default).
Our conclusion is we are in a Long Term Bear Market and are currently completing a consolidation period, which will likely last through the summer before resolving itself to the downside.
This assumes the Federal Reserve or US Treasury don’t shockingly change current policy!
YOUR DESK TOP / TABLET / PHONE ANNOTATED CHART
Macro Analytics Chart Above: SUBSCRIBER LINK
FAIR USE NOTICE This site contains copyrighted material the use of which has not always been specifically authorized by the copyright owner. We are making such material available in our efforts to advance understanding of environmental, political, human rights, economic, democracy, scientific, and social justice issues, etc. We believe this constitutes a ‘fair use’ of any such copyrighted material as provided for in section 107 of the US Copyright Law. In accordance with Title 17 U.S.C. Section 107, the material on this site is distributed without profit to those who have expressed a prior interest in receiving the included information for research and educational purposes. If you wish to use copyrighted material from this site for purposes of your own that go beyond ‘fair use’, you must obtain permission from the copyright owner.
NOTICE Information on these pages contains forward-looking statements that involve risks and uncertainties. Markets and instruments profiled on this page are for informational purposes only and should not in any way come across as a recommendation to buy or sell in these assets. You should do your own thorough research before making any investment decisions. MATASII.com does not in any way guarantee that this information is free from mistakes, errors, or material misstatements. It also does not guarantee that this information is of a timely nature. Investing in Open Markets involves a great deal of risk, including the loss of all or a portion of your investment, as well as emotional distress. All risks, losses and costs associated with investing, including total loss of principal, are your responsibility.