Gordon T Long
Global Macro Research | Macro-Technical Analysis
tipping points
BOND MARKET
ECONOMIC INDICATORS STEADILY DETERIORATING
This week we do a deep dive into the deluge of economic indicators to see if there is consistent message signalling the realities of an imminent US Recession. THERE WAS!
The only good news we witnessed was the Equity Market! However, it is a facade as major developments in the Pricing of Risk are aggessve occurring, drowned out by the noise of Debt Ceiling worries! We explore both in this newsletter.
NEVER BEFORE SEEN – A Tapped Out Consumer in a 70% Consumption Economy is a Serious Structural Problem!
1- HOME DEPOT
Sees comparable sales -2% to -5%. Reported the “Worst Revenue Miss In 20 Years”. Home Depot slashed guidance while blaming Weather, Lumber and a Faltering Consumer.
2- TARGETS
“We continue to contend with a significant headwind caused by Inventory Shrink, building on a worsening trend that emerged last year”, CEO Brian Cornell. (Target pointed to a worsening blow from organized retail theft, which is expected to erode profit by an additional $500 million compared with last year, when Target was already contending with rising theft.)
3- WALMART
“There’s reason to be somewhat cautious on the health of the consumer, but if you look at our results in the quarter, it certainly speaks to our value proposition resonating with customers. The outlook on the rest of the year hasn’t changed appreciably.” – CEO Rainey
The upbeat results point to the resilience of Walmart’s massive grocery business, which is grabbing mainline grocery share based on price, as US shoppers think twice before buying discretionary goods and increasingly shop around for staples.
WHAT YOU NEED TO KNOW
 RECESSION? YES! – HARD LANDING? YES!
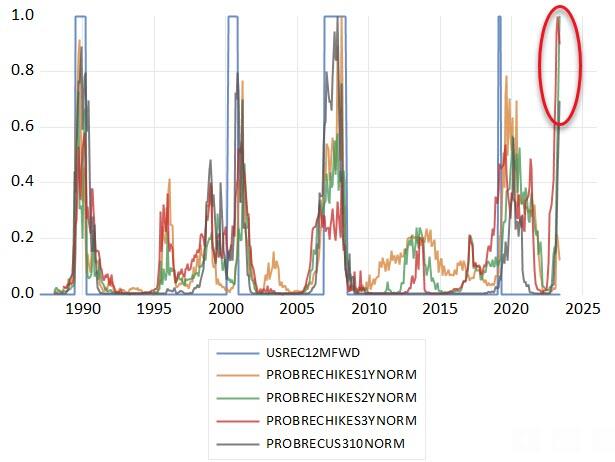
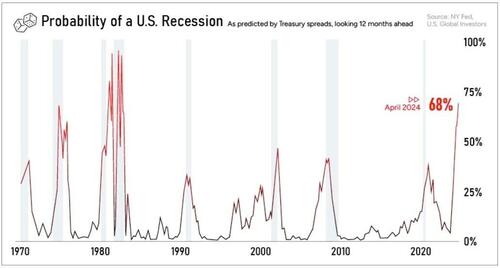
The Bond Market is usually correct with the consensus saying “it’s a lock!”. The Stock Traders are occassionaly right and always say “it is different this time”. (chart right)
Take out 5 stocks and IT ISN’T DIFFERENT THIS TIME!
CHART RIGHT: The 2Y and 3Y UST segments of the money market curves price substantially higher probability of recession compared to ALL FOUR CYCLES SINCE 1990.
RISK PREMIUMS – Equity Premiums & Bond Duration Premia
-
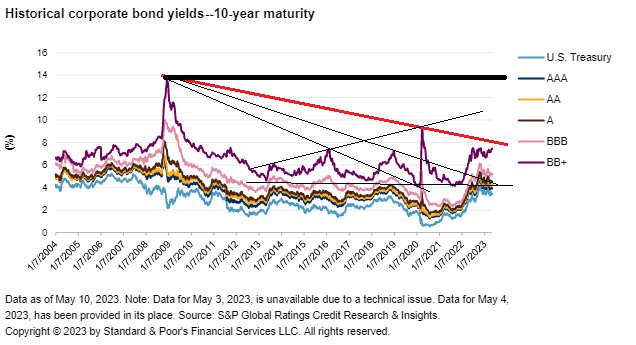
- We expect the lower end of the Investment Grade (IG) Coporate Bond market (BB+ & BBB) to reach the 2009 yield levels (or higher) during the coming recession.
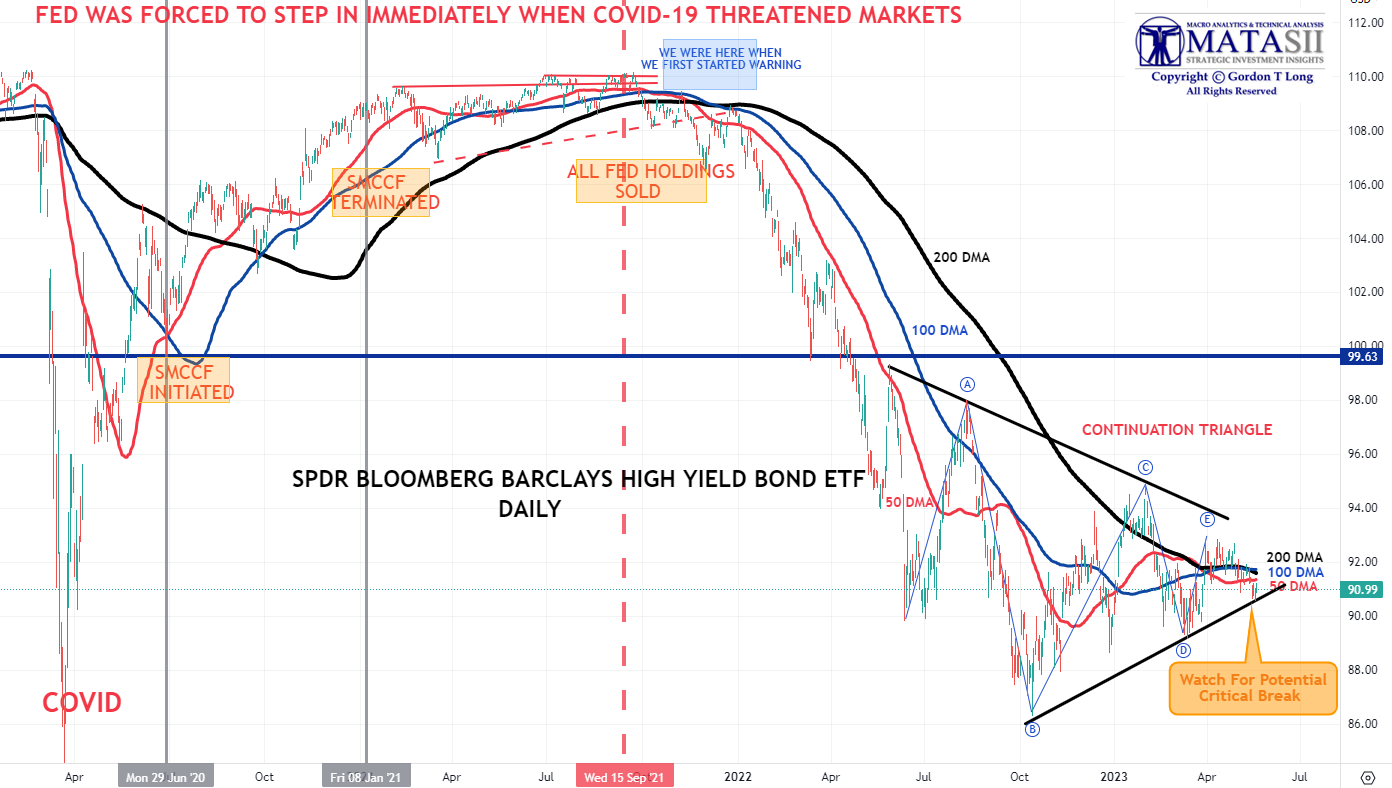
- The Corporate High Yield (HY) segment as represented by the SPDR Bloomberg Barclay’s High Yield ETF (JNK) is at a critical support level. If broken the prior downward trend can be expected to resume.
- Risk & Spreads are going higher for the following four reasons, which are currently being under appreciated:
-
-
- US Treasury Replenishment of the Treasury General Account (TGA)
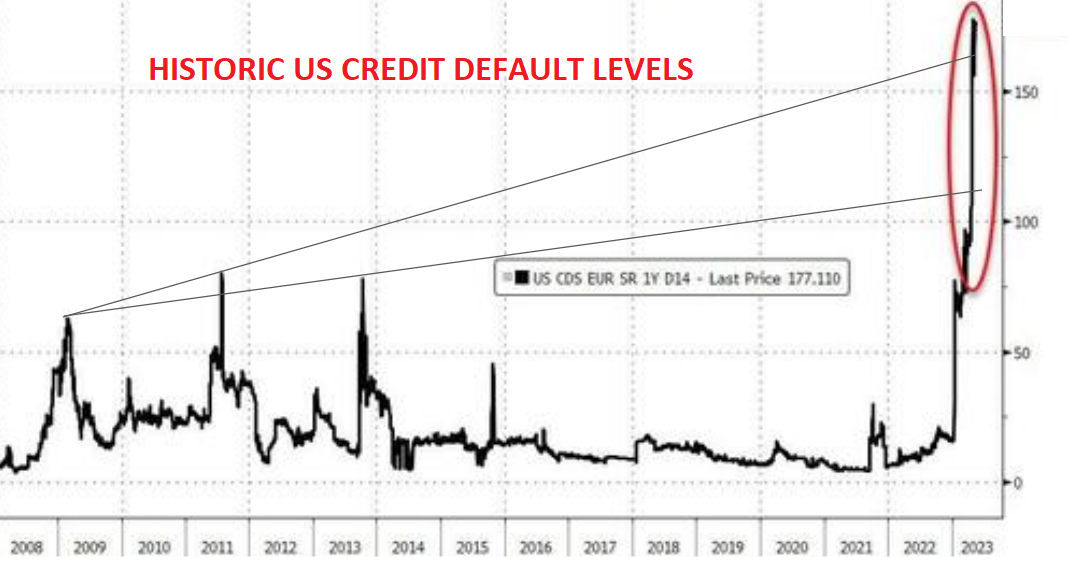
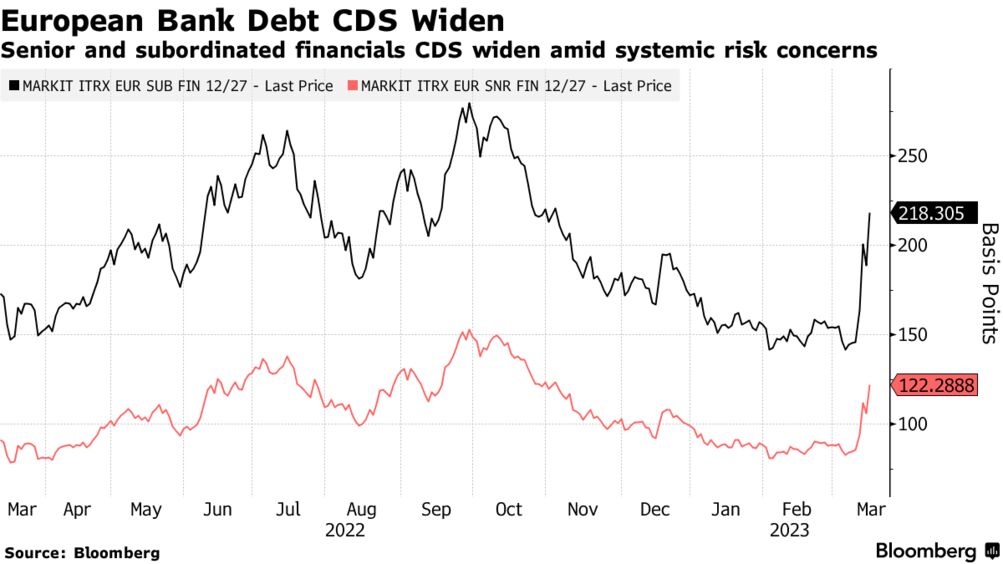
- Concerrns With a US Debt Rating Downgrade – We are currently seeing historic Credit Default Swap (CDS) Levels
- Re-Pricing of Risk in Post Great Moderation Era – Due to slowing of Globalization, Financialization & Mercantilism
- Dual factors of a Slowing Global Economy & De-Dollarization Pressures on FX Reserves (typically held in low risk US Treasuries)
-
CONSUMER SPENDING – Has Hit A Wall!
-
- Credit Card Data reveals the first drop in household spending In two years as upper-income wages are tumbling while Unemployment Benefits are soaring.
- Clear concerns this week from bellweathers’ Home Depot, Target & WalMart.
- According to unvarnished and unmanipulated credit and debit card data, the state of the US consumer, labor market and household spending is far worse than that represented by the US government.
US ECONOMIC REPORTING: “Deep Dive” of This Week’s Key Economic Reports
-
- Conference Board forecasts a contraction of economic activity starting in Q2, leading to a mild recession by mid-2023.
- Empire Fed – Crashed 42.6 points to -31.8 from +10.8. This is the biggest MoM drop ever! (x-Covid)
- Industrial Production – M-o-M (Apr) 0.5% vs. 0.0% (Previous. 0.4%)
- Manufacturing Output – M-o-M (Apr) 1.0% vs. Expectations. 0.1% (Previous. -0.5%, Revision. -0.8%)
- Initial Jobless Claims dropped notably to 242k (lower than the 251k expected)
- Retail Sales – M-o-M (Apr) 0.4% vs. Expectations 0.8% (Previous. -0.6%, Revision. -0.7%)
- Housing – NAHB housing market index rose for a fifth consecutive month to a 10-month high of neutral 50 in May (prev. 45.0) above the expected 45.0.
- Housing Starts: Jumped 2.2% M-o-M (-1.4% M-o-M expectations, but March’s data was revised down massively from -0.8% to -4.5%).
- Building Permits: Fell 1.5% M-o-M (vs unch exp), but also a major revision (upward from -8.8% to -3.0%).
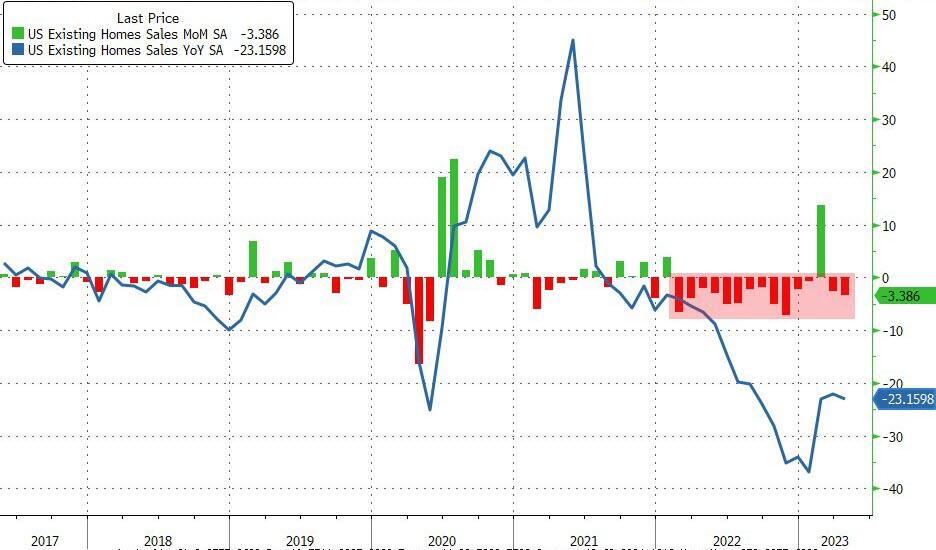
- Housing – Exisitng Home Sales: US existing home sales have continued to trend lower with March down and now April dropping 3.4% M-o-M (worse than the 3.2% drop expected).
- Leading Economic Indicators (LEI): Declined in April, dropping 0.6% M-o-M. The biggest positive contributor to the leading index was stock prices at 0.16.
CONCLUSION
BANKRUPTCIES – Heating Up: 7 In 48 Hours
As we warned in prior Newsletters, we expected Jobless Claims to Increase (Happening) & Bankruptcies to soon begin (Started).
At least seven large companies filed for Chapter 11 bankruptcy protection in less than 48 hours last week, a breakneck pace of restructurings.
-
- Monitronics International Inc., a chemical producer
- Venator Materials Plc, an oil producer
- Cox Operating LLC, an oil field operating company
- Kidde-Fenwal Inc., a fire protection firm,
- Athenex Inc., a biotechnology company
- Vice Media, a media company
- Envision Healthcare, a medical staffing company
RISK PREMIUMS – Equity Premiums & Bond Duration Premia
 BOND YIELDS ARE HEADED HIGHER FOR FOUR REASONS
-
- US Treasury Replenishment of Treasury General Account (TGA), which will place pressures on pushing Treasury prices down and yields up.
- Concerrn With a potential US Debt Rating Downgrade – Current Credit Default Swaps are at historicc high levels.
- Re-Pricing of Risk in Post Great Moderation Era due to structural slowing of positive impacts of Globalization (reduced costs due to labor arbitrage), Financialization (reduced interest rates) & Mercantilism (Treasury buying for FX holdings).
- Slowing Global Economy & De-Dollarization Pressures resulting in slower cummulative FX Reserves.
BOND DURATION RISK PREMIA
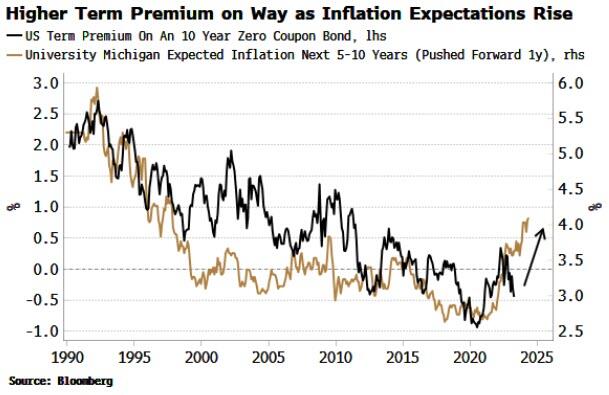
 Higher bond yields are an increasingly likely prospect, as rising inflation expectations push bond holders to demand an extra premium to lend money. It’s been a testament to the Fed’s inflation-fighting credibility that – despite almost double-digit CPI – bond yields have not risen even more. The central bank’s own two-year forecast for PCE inflation never got above 3%, and based on the behavior of term premium – the extra yield bond holders demand above what is implied by long-run rate expectations – the market has taken the Fed at its word. Since bond yields bottomed in August 2020, virtually the entire rise has been accounted for by expectations of Fed rate increases.
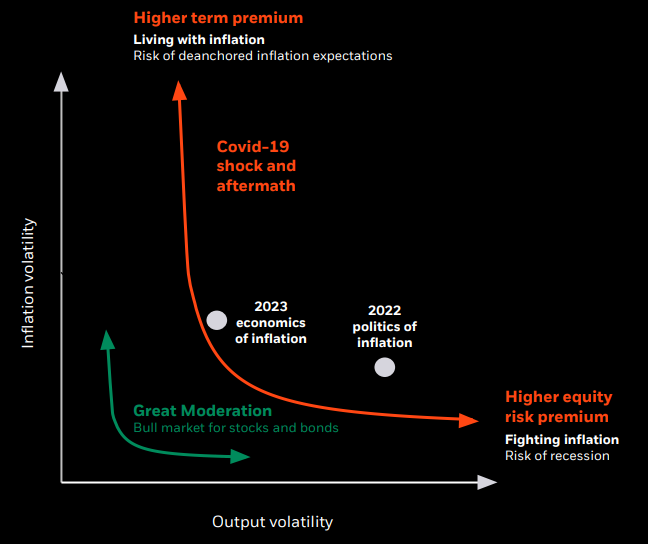
CHART RIGHT: Risk has been mispriced increasingly for over a decade. It is our expectations that Risk will increasingly be priced higher over the following decade.
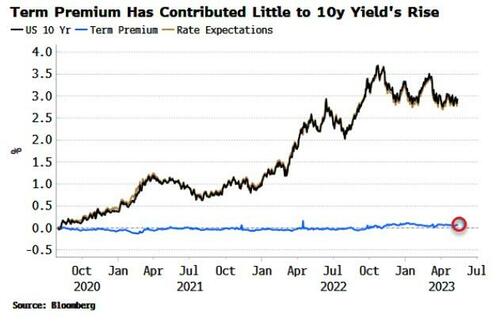
The median 5-10 year inflation expectation rose to 3.2% from 3% last month, a 30-year high apart from a brief blip during the GFC in 2009. The rise in long-run inflation expectations to cycle highs, despite CPI peaking almost a year ago, is a reminder that inflation indices capture the price move when it happens, but consumers don’t experience the inflation until they actually make a purchase. Many purchases are made irregularly so consumers are just beginning to “feel” inflation. This is a problem as rising inflation expectations risk inflation becoming unanchored. That’s when bond holders begin to notice. The chart below shows that longer-term inflation expectations lead term premium by about a year and anticipates the latter should soon start rising.
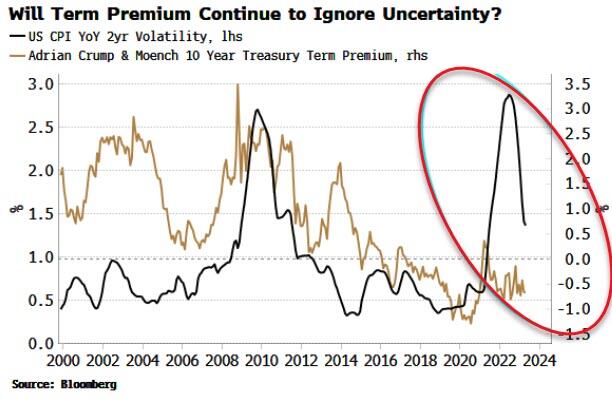
 This is one of several reasons to expect higher bond yields in the coming months. Higher inflation is big source of uncertainty, not just for markets, but for investment and for consumption. Fed surveys are pointing to a drop-off in capex, while the Katona Effect describes how consumers tend to save more and spend less when volatility of inflation is high. Term premium, too, tends to rise when inflation volatility rises, but so far it has not responded.
But rising inflation expectations and a greater risk of unanchored inflation may soon have something to say about this.
MATASII EXPECTATIONS
We expect the lower end of the Investment Grade (IG) Coporate Bond market (BB+ & BBB) to reach the 2009 yield levels (or higher) during the coming recession.
The Corporate High Yield (HY) segment, as represented by the SPDR Bloomberg Barclay’s High Yield ETF (JNK), is at a critical support level. If broken the prior downward trend can be expected to resume.
CONSUMER SPENDING – Has Hit A Wall!
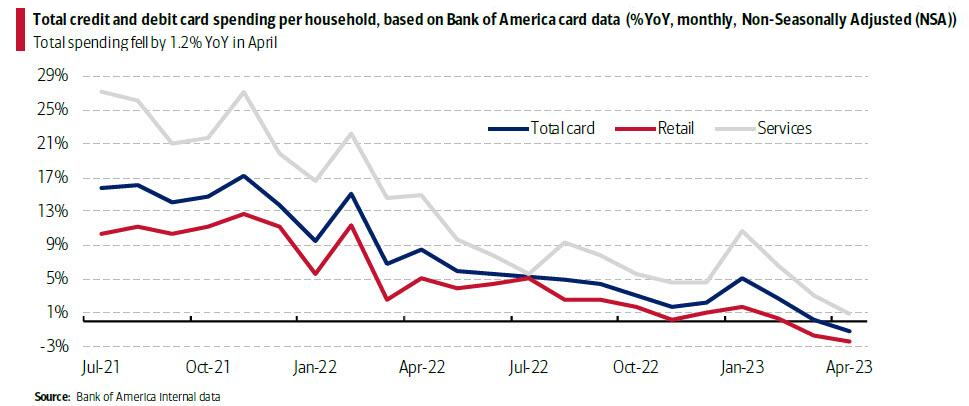 Credit Card Data reveals the first drop in household spending In two years as upper-income wages are tumbling while Unemployment Benefits are soaring.
According to unvarnished and unmanipulated credit and debit card data, the state of the US consumer, labor market and household spending is far worse than that represented by the US government.
The most recent debit and credit card data published by the Bank of America Institute shows that the recent higher-income job market slowdown is also starting to impact spending. The upper-income cohort is finally starting to crack too.
The latest monthly Consumer Checkpoint report published by Bank of America (after the moderation seen last month) shows further signs of a slowdown in consumer spending in April. The Bank of America aggregated credit and debit card spending per household slowed further to -1.2% year-over-year (YoY) in April, the first negative monthly YoY reading since February 2021. Most noteworthy is a softening in spending on services to just +0.9% YoY. Until recently, services had been driving overall spending growth.
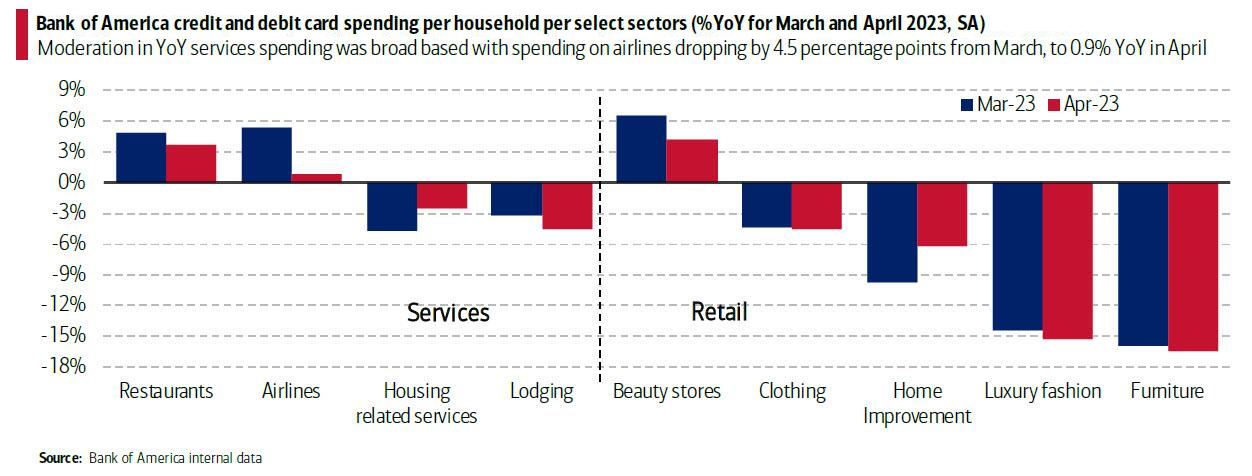
The moderation last month, however, was broad based, led by spending on airlines dropping by 4.5 percentage points to +0.9% YoY in April.
US ECONOMIC REPORTING THIS WEEK – It’s getting Ugly Out There!
 We took a deeper dive into economic releases this week to ensure we are in fact correct about an imminent US Recession.
Everything we looked at (including what is highlighted below) stongly confirms this view and suggests that we are highly likely to experience a “hard landing”, which should be expected to be protracted.
SEPARATELY: The Conference Board now forecasts a contraction of economic activity starting in Q2 leading to a mild recession by mid-2023.
 LEADING ECONOMIC INDICATORS (LEI)
US Leading Economic Indicators Tumbled For the 13th Straight Month
“Weaknesses Were Widespread”
The latest LEI chart to the right is the cleanest view of the Fed’s tightening impact on the US economy.
The trajectory of the US LEI continues to signal a recession over the next 12 months, further confirming the chart above – Probability of US Recesion.
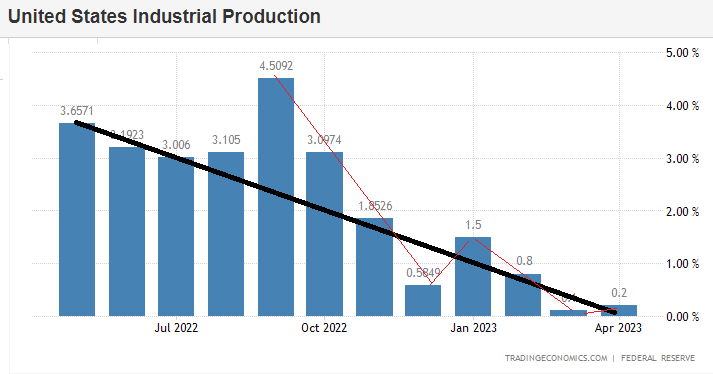 US INDUSTRIAL PRODUCTION & MANUFACTURING
US INDUSTRIAL PRODUCTION: US industrial production for April rose 0.5%, above the expected 0%, although the March data saw a revision lower to 0% from +0.4% after flatlining in February also.
At 103% of its 2017 average, total industrial production in April was 0.2% above its year-earlier level.
CAPACITY UTILIZATION: Edged up to 79.7% from 79.4%, a rate that is equal to its long-run (1972–2022) average.
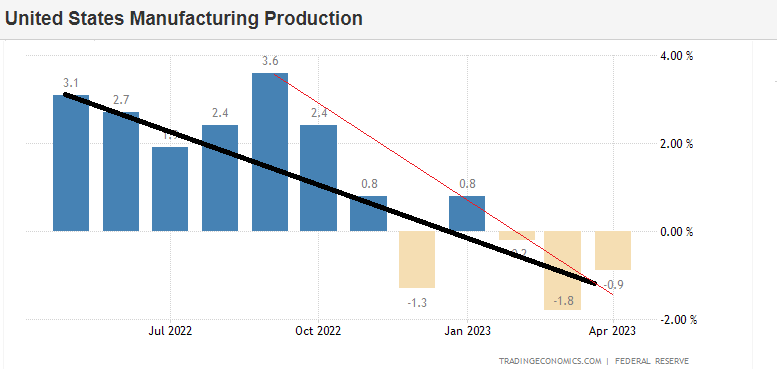 MANUFACTURING OUTPUT: Rose 1%, well above the expected +0.1%, bolstered by a strong gain in the output of motor vehicles (a massive +9.3%) and parts, while the prior was revised lower to a 0.8% decline from the initial 0.5% decline; factory output excluding motor vehicles and parts rose 0.4%. The index for mining rose 0.6%, while the index for utilities dropped 3.1%, as milder temperatures in April lowered demand for heating.
An area of note was the rise in business equipment output by 1.2% after two months of decline, a sector that analysts deem vulnerable to a tightening in lending standards, but so far so good. However, there is an expectation that output in the sector will struggle going forward.
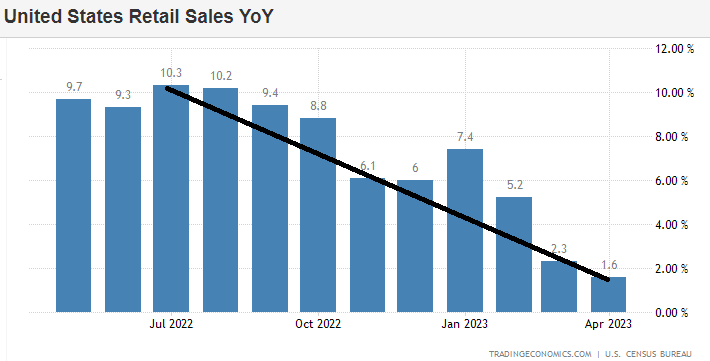 US RETAIL SALES: Headline retail sales came in beneath analyst expectations at 0.4% (exp. 0.8%), but pared some of the 0.7% decline seen in March.
-
- Although the headline missed expectations, the internals were more encouraging with ex-autos at 0.4% (expectations. 0.4%, prev. -0.5%), while the ex-gas and autos rose 0.6%, above the prior -0.5%.
- Meanwhile, the control group, which feeds into GDP data, saw a strong reading at 0.7%, above the 0.3% forecast and prior -0.4%.
- The report showed a relative mix of spending in April with decent gains in Motor Vehicle and Parts Dealers, Building Materials, Health and Personal Care, as well as General Merchandise, Non-store Retailers, Food Services and Drinking places as well as Miscellaneous Store Retailers.
- However, on the flip side, Furniture, Electronics, Food and Beverage Stores, Gasoline Stations, Clothing and Sporting Goods saw declines.
- Overall, a decent report shows consumers are still spending, particularly evidenced by the control group, although analysts highlight concerns ahead with tighter lending standards and a slowing labour market may see consumer spending fall towards the end of the year.
- Nonetheless, this release adds to the raft of strong April data seen recently, including the stellar April NFP.
- However, the initial surveys for May (NY Fed, UoM) have been woeful, so analysts are looking to see if it translates to the hard data too.
- Meanwhile, looking ahead analysts are expecting a slowdown due to the lag effects of monetary policy, tighter credit conditions, slowdown in growth and as COVID savings are utilized.
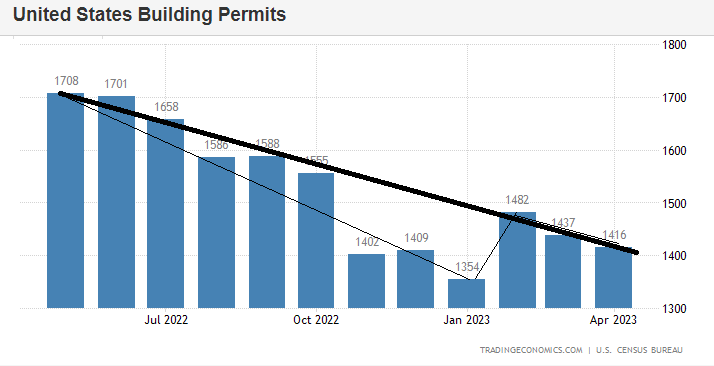 HOUSING PERMITS:
Building permits fell to 1.416mln from the upwardly revised 1.437mln (initially 1.43mln), beneath the consensus estimate of 1.437mln. “The small decline in April building permits, meanwhile, is entirely due to a 7.7% slump in the multi-family component, which is prone to wild swings month-to-month, but has been trending sideways for over a year”, Pantheon writes. The consultancy says the bigger picture is that residential construction is now stabilising, something that was a huge drag on fixed investment in 2022. Although it warns the expected plunge in business capital spending is likely to offset any recovery in residential fixed investment.
Building permits in the United States declined by 1.5 percent to a seasonally adjusted annual rate of 1.416 million in April 2023, according to a preliminary estimate. This marks the second consecutive month of decline and falls short of market expectations of 1.437 million permits, suggesting housing demand remained subdued due to higher interest rates and increasing consumer prices. Permits for the volatile multi-segment tumbled 7.7 percent to a rate of 561 thousand, the lowest since last July 2021, while single-family authorizations increased 3.1 percent to a seven-month high of 855 thousand. Permits were down in the Northeast (-23.6 percent to 113 thousand) and Midwest (-15.2 percent to 173 thousand), but were up in the South (4.3 percent to 801 thousand) and West (3.8 percent to 329 thousand).
HOUSING STARTS
US housing starts rose to 1.401mln (exp. 1.4mln) in April from 1.371mln in March, which saw a big downward revision from the initial 1.42mln. Pantheon Macroeconomics highlights that the rise “is more or less evenly split between single- and multi-family units, broadly in line with the levels implied by previously-granted permits.”
Housing starts in the US unexpectedly increased 2.2% month-over-month to a seasonally adjusted annualized rate of 1.401 million in April of 2023, compared to market forecasts of 1.4 million. Data for March was revised sharply lower to 1.37 million from 1.42 million, as high prices, interest rates and tighter lending standards continue to weigh. Single-family housing starts, which account for the bulk of homebuilding, increased 1.6% to a four-month high of 846K and starts in buildings with five units or more surged by 5.2% to 542K. Starts rose in the West (34.6% to 315K) and the Midwest (32.6% to 171K), but fell in the Northeast (-23.4% to 131K) and the South (-6.3% to 784K).
EXISTING HOME SALES
US existing home sales have continued to trend lower with March down down and now April dropping 3.4% M-o-M (worse than the 3.2% drop expected).
CONCLUSION
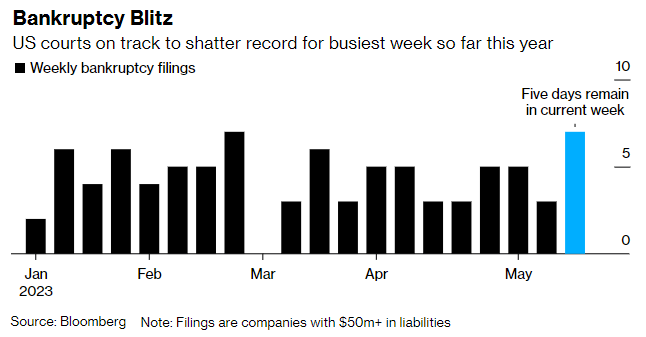 BANKRUPTCIES – Heating Up: 7 In 48 Hours
As we warned in prior Newsletters, we expected Jobless Claims to Increase (Happening) & Bankruptcies to soon begin (Started).
At least seven large companies filed for Chapter 11 bankruptcy protection in less than 48 hours, a breakneck pace of restructurings that included once-hot digital-broadcaster Vice Media LLC and KKR & Co.-backed Envision Healthcare Corp.
That’s the largest number of filings on record during a two-day period since at least 2008, according to Bloomberg-compiled data on companies with at least $50 million of liabilities. And it comes as two Federal Reserve officials signaled that they favor a pause in their aggressive monetary-tightening campaign amid the ongoing fallout in credit markets.
Firms across every sector are struggling with higher interest costs — making it more challenging to refinance loans and bonds — while corporate executives are drawing more scrutiny from investors and creditors.
Bankruptcy filings occurred in home security company 1- Monitronics International Inc., chemical producer 2- Venator Materials Plc, oil producer 3- Cox Operating LLC oil field operations, 4- Kidde-Fenwal Inc, fire protection firm and 5- Athenex Inc., biotechnology company.
6- Vice Media’s filing marks a dramatic fall from its status as a media darling. The company secured a $450 million investment from private equity firm TPG in 2017, which valued the firm at $5.7 billion — a startling figure for a newcomer. Journalism has been an easy target for advertisers’ cost-cutting plans in an uncertain economy.
7- Envision Healthcare, a medical staffing company backed by KKR, had been in talks about restructuring options after it skipped a bond coupon payment due in mid-April.
IN THE FINAL “LIFT” OF A BEAR MARKET COUNTER RALLY
A BEAR MARKET TECHNICAL CONSOLIDATION / CORRECTIVE “ZIGZAG”
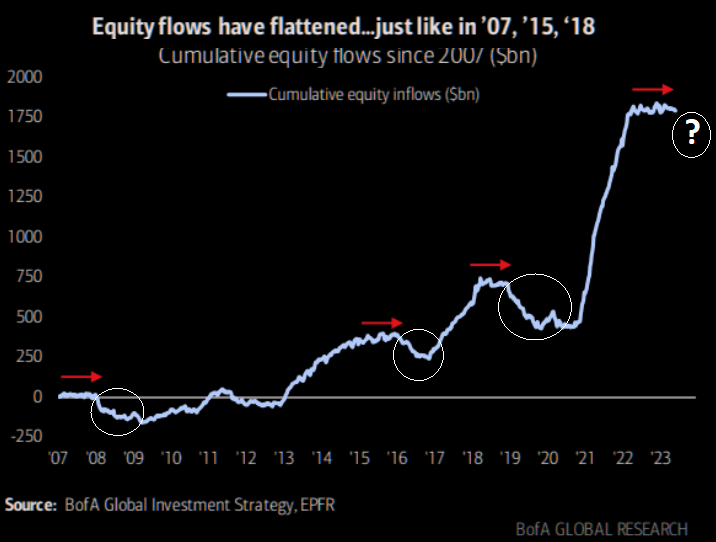 The cumulative Equity Inflows have flattened in a similar fashion to what they did prior to the 2008 GFC and the 2016 & 2019 market downturns.
Though flat equity inflows in themselves can not assure a market downturn, when looked at in concert with the following supporting analytics and probabilities, it is high. They illustrate we are approaching a significant market downturn.
CHART BELOW
We are seeing a major Divergence between the US equity markets as represented by the S&P 500 and benchmarks like High Yield Stocks (JNK) and Transportation stocks (iShares ETF).
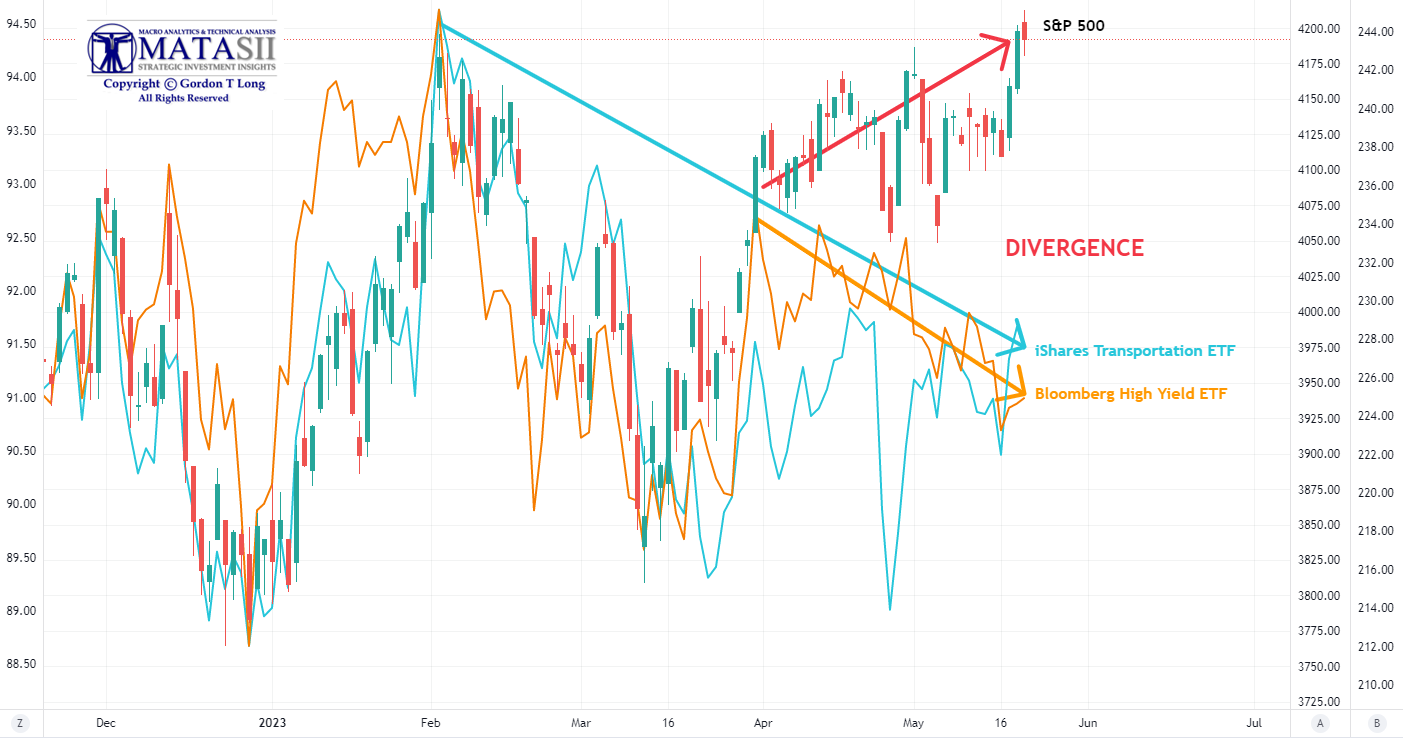
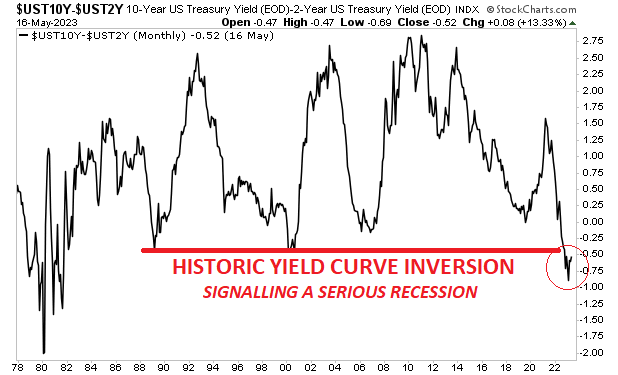
CHART BELOW:
Additionally, we have not seen a Yield Curve Inversion like the current one since the massively disruptive era of Paul Volcker in 1980.
The complexity and myriad number of overlapping waves for the move from October 2022 is NOT impulsive or progressive within the larger degree trend. Rather, it demonstrates a classic and clear corrective price action personality, which means a high probability resolution to the downside will follow.
We have altered the Eliiott Wave count as shown below to reflect a classic “WXY” Zig Zag Corrective pattern.
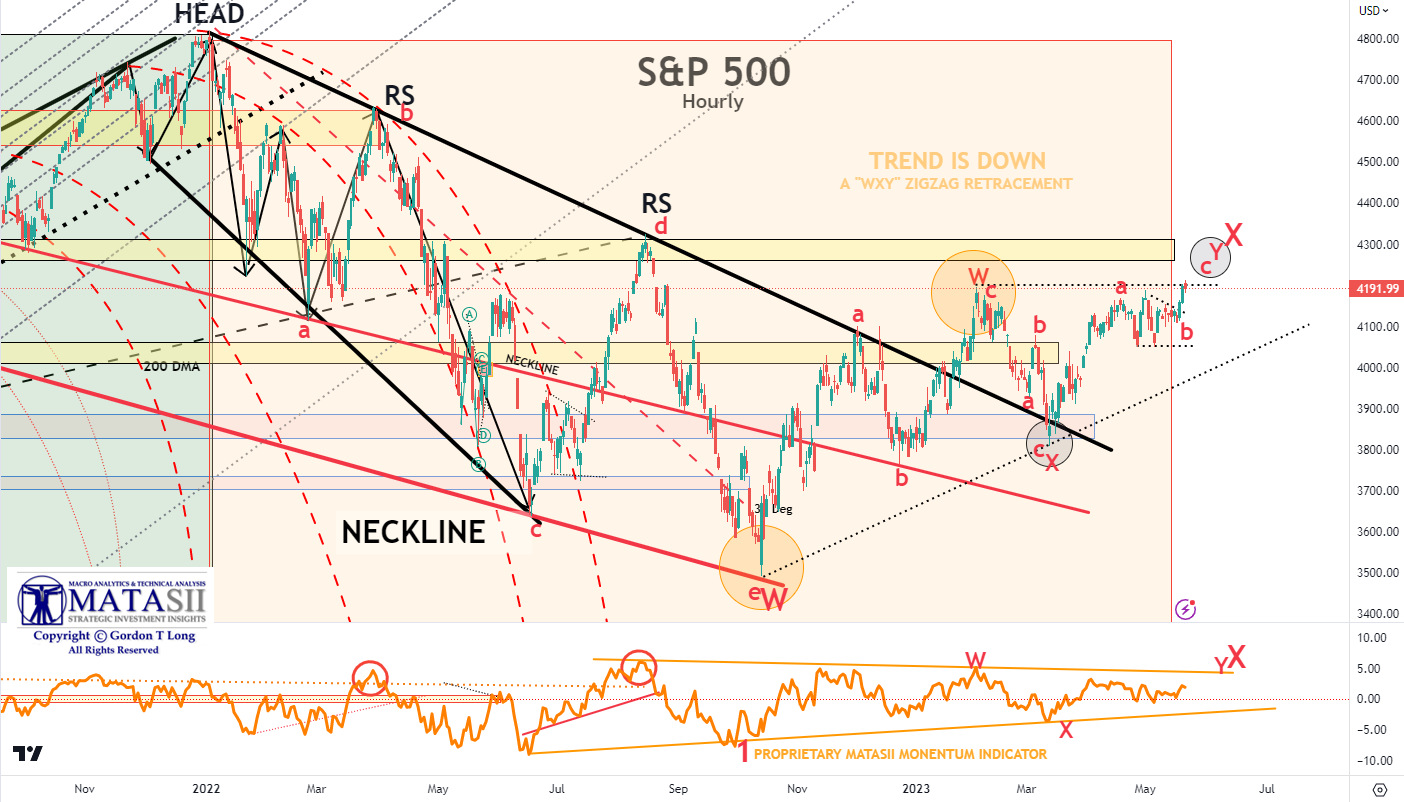
YOUR DESK TOP / TABLET / PHONE ANNOTATED CHART
Macro Analytics Chart Above: SUBSCRIBER LINK
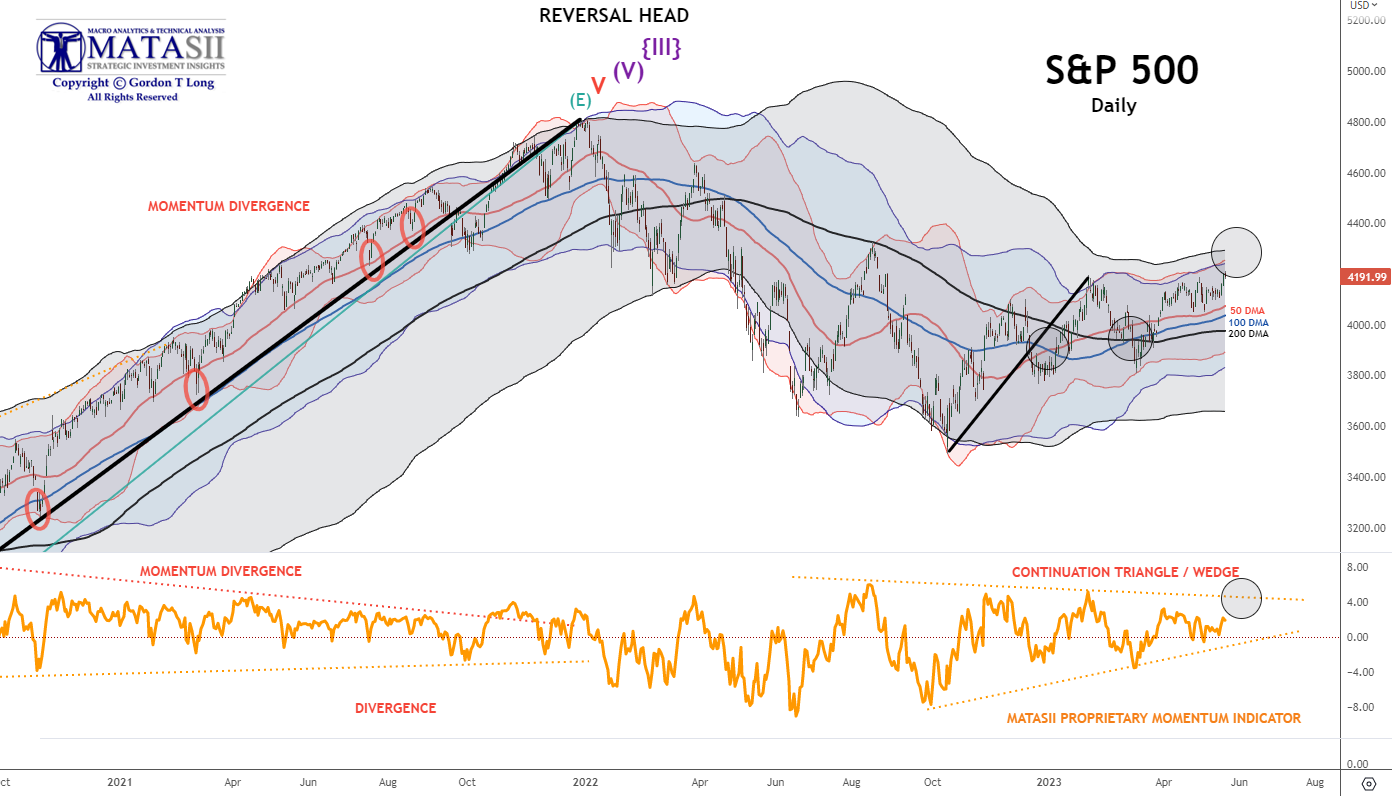
50 / 100 / 200 DMA
We can see below, in the current daily S&P 500 price chart, the 50 DMA (red), 100 DMA (blue) and 200 DMA (black).
-
- The black rising line on the right shows where a signiciant lift in price resulted in the Moving Averages Banding. They closed their gaps into a tighter pattern relative to each other.
- The Moving Averages then proceeded to “restack”. This is shown by the two circles on the right where the 50 DMA first crosses the 100 DMA and the second circle is where the 100 DMA crosses the 200 DMA.
- Though the “restacking” has occurred, caution must be heeded, because the Moving Averages are only marginally above being flat and still tightly “banded”. This is often seen as a signal of a consolidation of the prior trend before continuing with the prior directional trend.
- You will notice in the lower panel that the MATASII proprietary Momentum Indicator is currently signalling a Continuation Triangle or Wedge.
- We look for price to rise slightly further to touch the upper 2 Standard Deviation Bands of each of the 50 / 100 / 200 DMAs (marked with a circle).
- To gain further insights on Direction and Timing we need to move “up” to the Weekly and Monthly MA’s.
YOUR DESK TOP / TABLET / PHONE ANNOTATED CHART
Macro Analytics Chart Above: SUBSCRIBER LINK
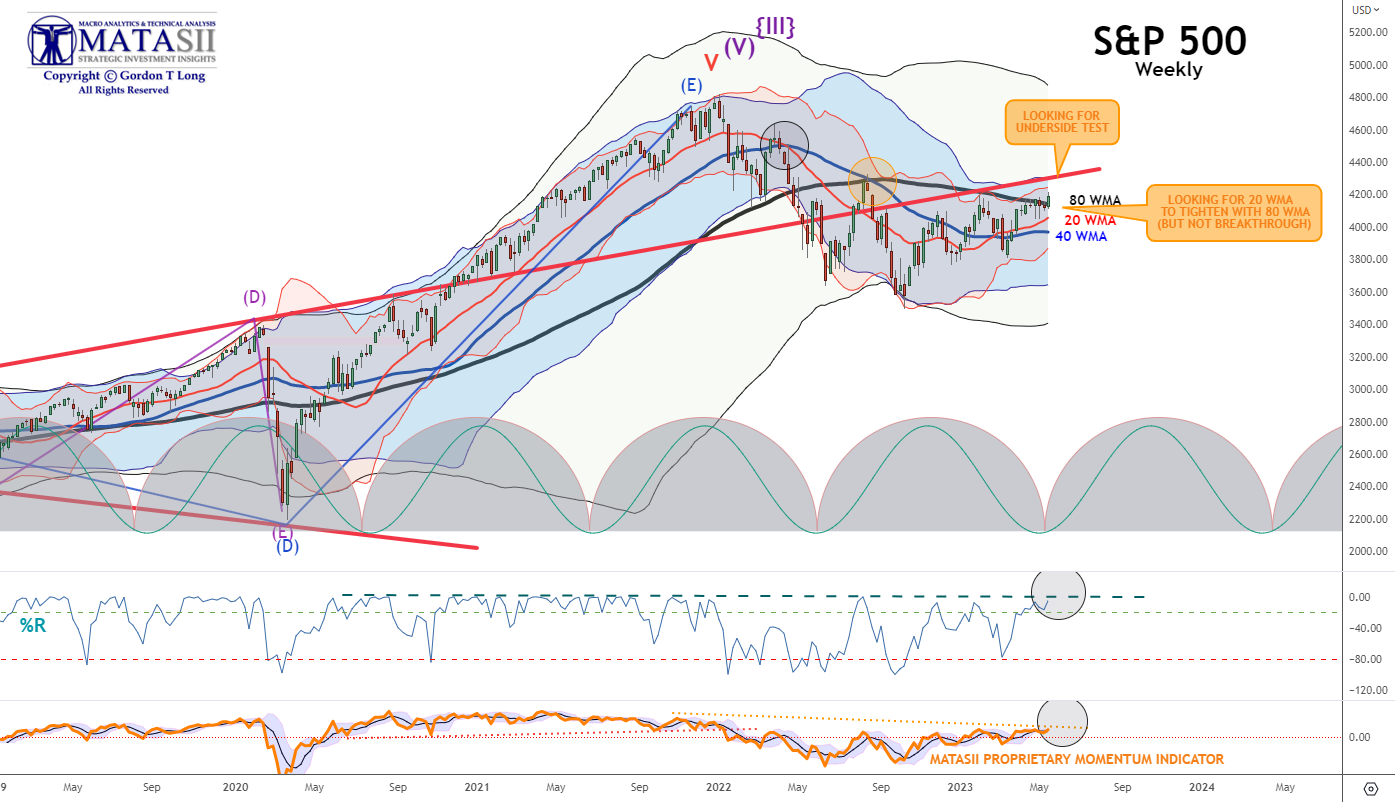
20 / 40 / 80 WMA
The 20 / 40 / 80 Weekly MA’s for the current S&P 500 are shown below.
-
- In this instance, the two circles highlight where the 20 WMA initially crossed the 40 WMA and where the 40 WMA crossed the 80 WMA. This stacking has been maintained until recently, when the 20 WMA crossed back over the 40 DMA to the upside.
- The 80 WMA is still pointed in a downward trend.
- The recent S&P 500 price lift has been stalled by the overhead resistance of the 80 WMA. It needs to break through before the 20 or 40 WMA can have any chance of breaking over the 80 WMA.
- The lower panel shows that oscillaters are suggesting we have reached overhead resistance that is likely to fail, (at least in the short term).
- We look for price to rise slightly higher to touch the underside of the long term trend line (in red).
- The long term black trend line also suggests we are testing the underside resistance of it.
YOUR DESK TOP / TABLET / PHONE ANNOTATED CHART
Macro Analytics Chart Above: SUBSCRIBER LINK
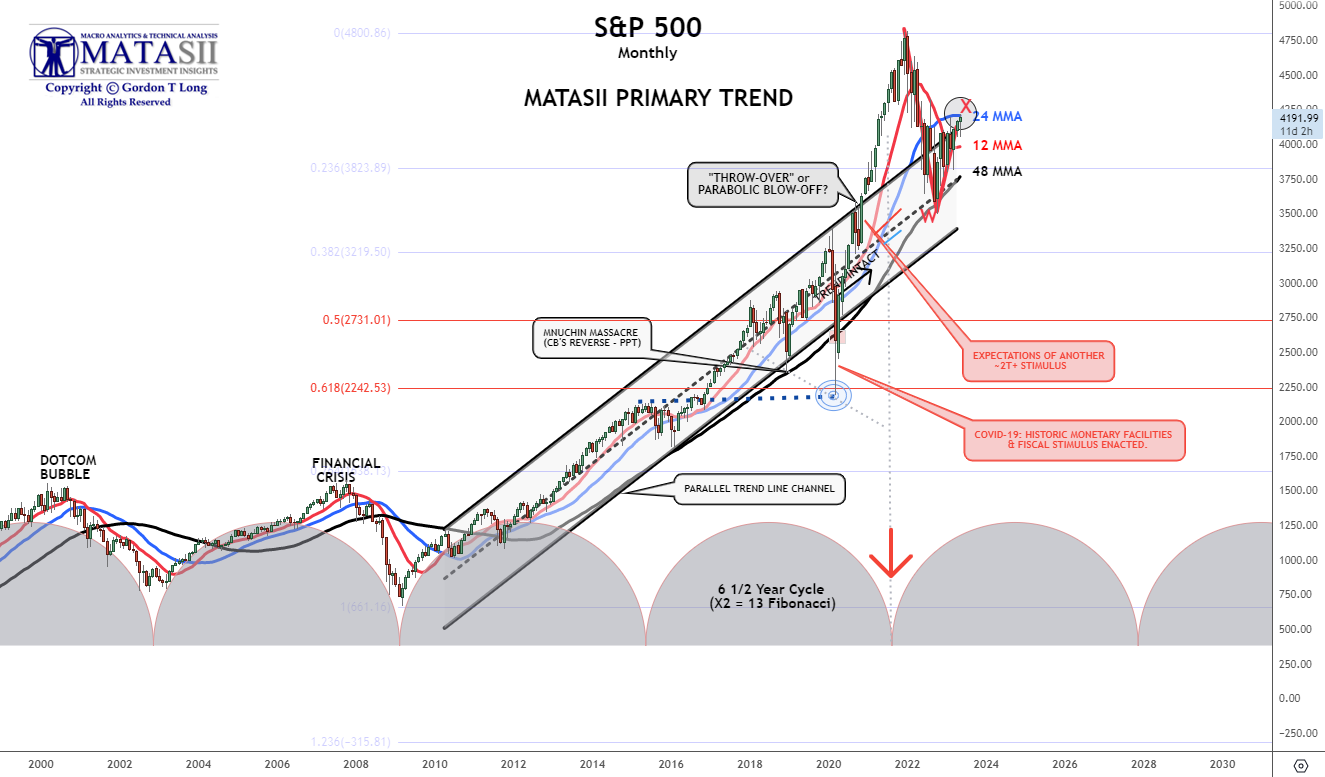
12 / 24 /48 MMA
When we look at a Monthly view using the 12 / 24 / 48 MA’s we see:
-
- The long term trend for the S&P 500 is still UP, but it is attempting a reversal as shown by the movements in the Monthly 12 / 24 / 48 Moving Averages.
- Price is now testing the 48 MMA (in Blue) where it is likely to have competed the “X” leg of a “WXY” Zigzag before resuming the prior downward trend.
- The upper side of the long term parallel chanel is currently acting as overhead resistance and aligns closely with the 24 MMA (blue) as resistance. It will take time below the 24 MMA to “bend” the 24 MMA potentially downwards.
- The 48 MMA is at exactly the mid-point of the rising parallel channel and looks like solid intermedaite term support.
- The half circle Cycles in the Monthly chart below and in the Weekly chart above are suggesting that a firm breakout one way or the other is likely closer to occurring in late summer, (closer to the final deadline for the Debt Ceiling before the US goes into potential default).
Our conclusion is that we are in a Long Term Bear Market and are currently completing a consolidation period, which will likely last through the summer before fully resovling itself to the downside.
This assumes the Federal Reserve or US Treasury don’t shockingly change current policy!
YOUR DESK TOP / TABLET / PHONE ANNOTATED CHART
Macro Analytics Chart Above: SUBSCRIBER LINK
FAIR USE NOTICE This site contains copyrighted material the use of which has not always been specifically authorized by the copyright owner. We are making such material available in our efforts to advance understanding of environmental, political, human rights, economic, democracy, scientific, and social justice issues, etc. We believe this constitutes a ‘fair use’ of any such copyrighted material as provided for in section 107 of the US Copyright Law. In accordance with Title 17 U.S.C. Section 107, the material on this site is distributed without profit to those who have expressed a prior interest in receiving the included information for research and educational purposes. If you wish to use copyrighted material from this site for purposes of your own that go beyond ‘fair use’, you must obtain permission from the copyright owner.
NOTICE Information on these pages contains forward-looking statements that involve risks and uncertainties. Markets and instruments profiled on this page are for informational purposes only and should not in any way come across as a recommendation to buy or sell in these assets. You should do your own thorough research before making any investment decisions. MATASII.com does not in any way guarantee that this information is free from mistakes, errors, or material misstatements. It also does not guarantee that this information is of a timely nature. Investing in Open Markets involves a great deal of risk, including the loss of all or a portion of your investment, as well as emotional distress. All risks, losses and costs associated with investing, including total loss of principal, are your responsibility.