Gordon T Long

Gordon T Long

Global Macro Research | Macro-Technical Analysis 

SII

PRECIOUS METALS


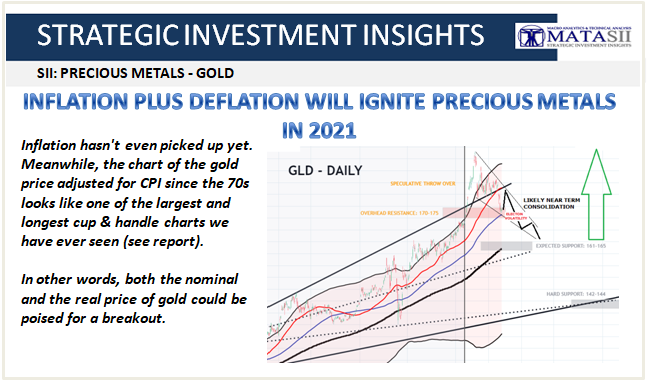
INFLATION PLUS DEFLATION WILL IGNITE PRECIOUS METALS IN 2021

 
We expect to see Inflation in the short to intermediate term impacting disposable income in the form of; increased taxes at all levels of government, Covid-19 retail and services ‘surcharges’, rising interest rates, higher import costs & food costs. On the other hand we expect to see increased deflation during the same period due to a decreased wealth effect, a temporary slowing rate of government liquidity injections and weak consumer demand due to unemployment and rising bankruptcies. All of this will be negative for precious metals in the immediate near term but will set the stage for the next major leg up for Precious Metals in the first half of 2021.
 
Gold stocks are still in a consolidation / correcting after soaring to seriously-overbought levels when their last upleg peaked in early August. Weak seasonals in the next month could additionally accelerate that. The deceiving high level consolidation after that euphoric topping failed decisively this week when GDX shattered its 50dma, proving this sector’s correction is alive and well.  Only about 15% so far, it is likely to extend to 25% to 30% before overbought technicals are worked off and sentiment rebalanced. Seasonality is likely to exacerbate the remaining selling.
 
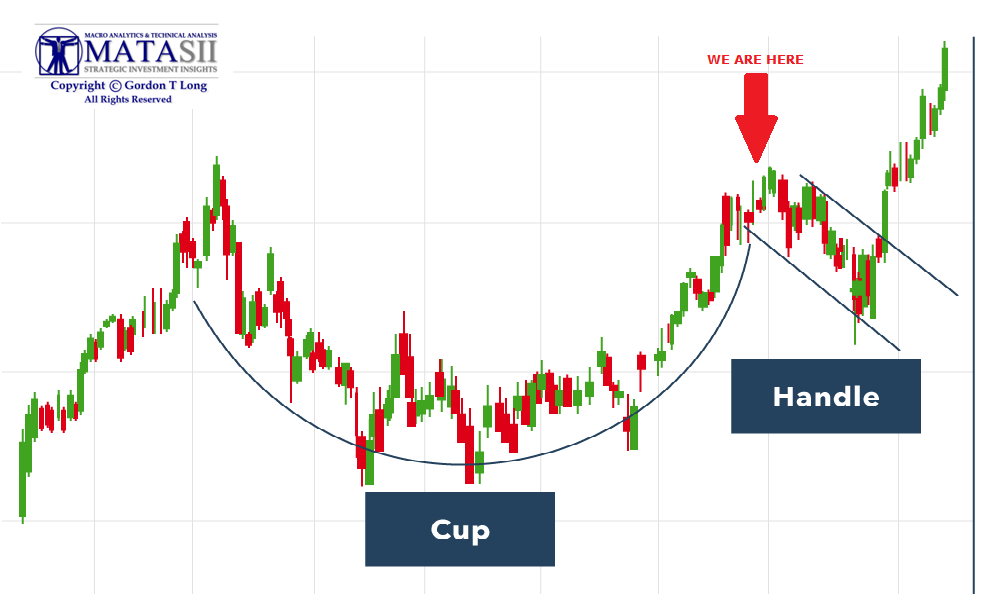
WE ARE PUTTING IN THE GOLD “HANDLE” WE CALLED FOR
 
We have  witnessing a $150 drop in gold prices, a $7 drop in Silver and headline-grabbing volatility since our August UnderTheLens Newsletter when we warned of a coming drop in Gold & Silver Prices:
Gold and silver are extremely overbought today. Popular sentiment has grown greedy and euphoric, with fear-of-missing-out buying flaring dramatically. That has forced both gold and silver to very stretched levels relative to their baseline 200 DMA’s. Such extremes have warned of up-legs topping in these bull markets, heralding re balancing selloffs. These essential selloffs erupting periodically in all bull markets should be embraced. They offer the best buy-low opportunities ever seen within ongoing bulls. They also keep bulls healthy.
 
Never forget, Gold is notoriously volatile and 25% corrections are historical norms! Though we don’t see this level of corrective / consolidation, we do fully expect a near term corrective / consolation to soon occur.
 
There’s a finite amount of capital available to chase any upleg, adding to its gains. When greed grows potent enough to fuel widespread fear of missing out, much buying is pulled forward from coming weeks and months. That soon exhausts available capital firepower to keep driving prices higher, leaving a void of demand. With enthusiastic buyers effectively all-in, the balance of capital flow power shifts to sellers.
 
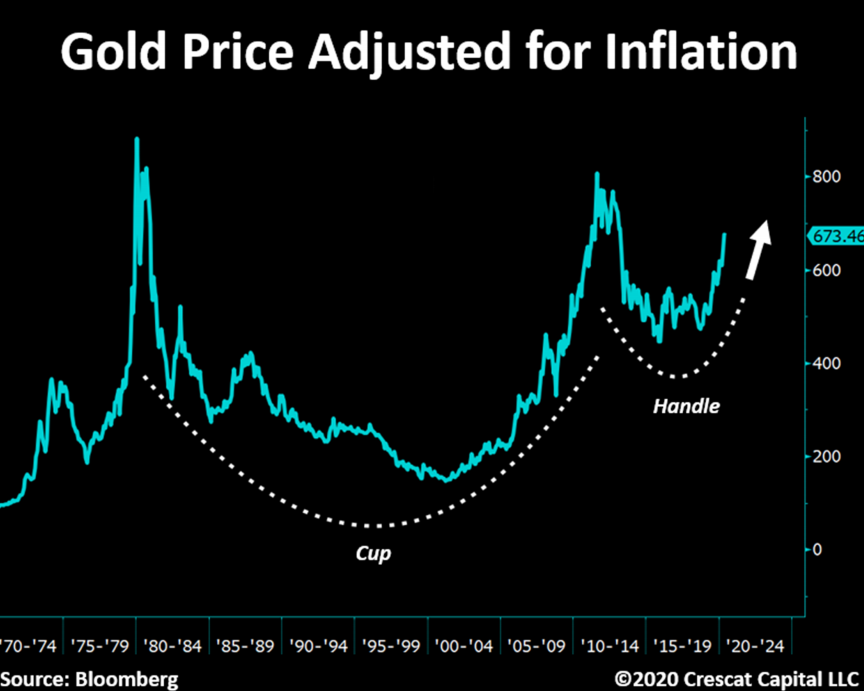
We also suggested that the correction would be part of a “Cup & Handle” Pattern Formation”. We still feel this to be the case since we are additionally seeing this pattern formation in Real Terms (See below).
 
 A STAGE SETTING CORRECTIVE CONSOLIDATION
 
The current weakness in Precious Metals is to be expected and will present Buying opportunities for the patient, long term investors. Precious Metals have patterns that long term precious metals are well aware of. We feature one in Addendum #3 below.
 
ADDENDUM TO THE OCTOBER UnderTheLens VIDEO
 
1- THE NEAR TERM STRUCTURAL FORCES THAT CURRENTLY TRAP THE FED.
 
If the US$ is to weaken significantly over the next 12-18 months, then investment strategies are highly likely to change to reflect the following: 
 
  • The stock market bubble bursts and the Fed must intervene,
  • The Treasury needs the money and the Fed must intervene ($8.5 trillion in Treasuries coming due by year end 2021 and a record budget deficit that must be funded),
  • Left to their own devices, interest rates start rising and the Fed must intervene,
  • Unemployment remains too high and the Fed must intervene,
  • Inflation remains to too low and the Fed must intervene,
  • The dollar keeps strengthening versus other fiat currencies and the Fed must intervene
2- WE CURRENTLY ANTICIPATE A “CUP & HANDLE” PATTERN AHEAD FOR GOLD 
 
Inflation hasn’t even picked up yet. Meanwhile, the chart of the gold price adjusted for CPI since the 70s looks like one of the largest and longest cup & handle charts we have ever seen. In other words, both the nominal and the real price of gold could be poised for a breakout.
 
EXPECTED PATTERN FORMATION
THE LONG TERM REAL (ADJUSTED FOR INFLATION) GOLD PRICE “CUP & HANDLE”.
 
 
WE PRESENTLY SEE THE RIGHT SIDE OF THE CUP” ARRIVING AS A SPIKE UPWARDS  IN 2021
 
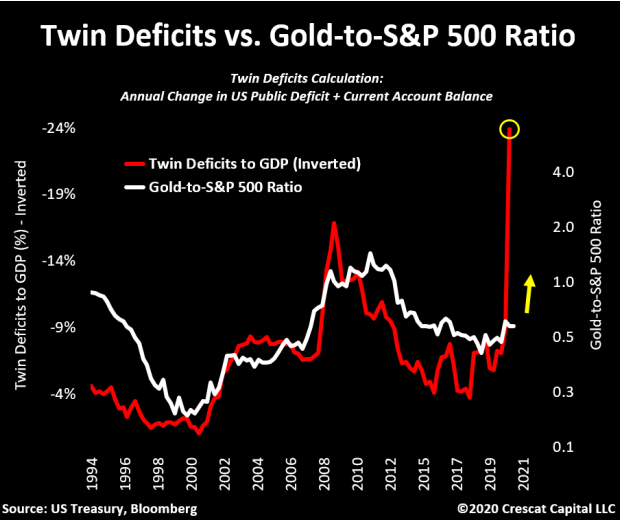
There is a strong likelihood that the the Gold-to-S&P 500 Ratio will continue to track its long term relationship with the US “Twin Deficits”. We discussed this in August UnderTheLens video.
 
 
3- WATCHING THE GOLD-STOCK “RELATIVITY” 
 
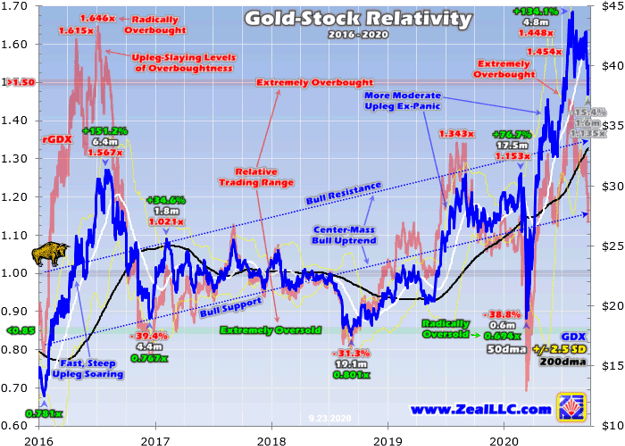
The well followed Precious Metals expert Adam Hamilton has found his Gold-Stock “Relativity” approach to be an effective tool. Like any tool it isn’t fool proof but is worth consideration in the timing of increasing Portfolio Precious Metals holdings. 
 
EXPECTED PATTERN FORMATION
 
 
The fat lady has yet to sing on gold’s own selloff.
 
Neither gold nor its miners’ stocks are likely to decisively bottom, paving the way for their next big uplegs, until their recent overboughtness is worked off. That can be measured by comparing GDX’s daily closes with their underlying 200dma. Dividing the former by the latter yields a construct I call the Relative GDX, or rGDX for short. Considering gold-stock price levels relative to their 200dmas yields great timing insights.
 
This Relativity Trading system I developed well over a decade ago shows that relative multiples like this rGDX often form horizontal ranges over time. Gold-stock uplegs within ongoing bull markets tend to peak at similar levels relative to GDX’s 200dma. And the subsequent rebalancing corrections also tend to bounce at similar rGDX levels. Gold stocks can be very profitably traded within this Relativity trend channel.
 
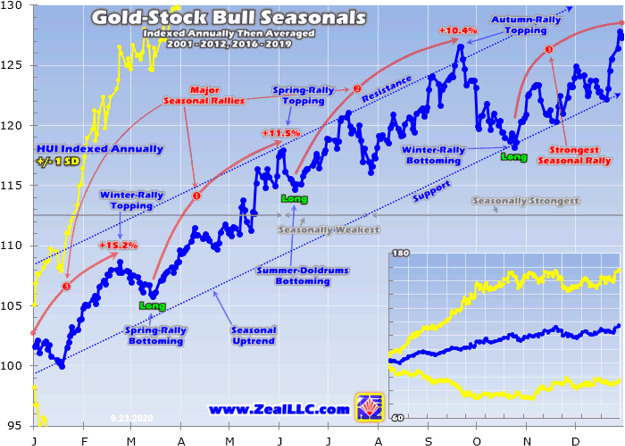
Another factor is coming into play which could accelerate gold-stock downside over the next month or so, seasonality. The gold stocks are on the verge of their biggest seasonal selloff of the year, which runs from late September to late October on average. This next chart is borrowed from my last essay on gold-stock seasonality from late July. It distills out gold-stock performance through modern bull-market years.
 

FOLLOWING DETAILED ANALYSIS IS SUBSCRIBER CONTENT ONLY

Subscribe to view full post content with supporting live charts
 

FAIR USE NOTICE  This site contains copyrighted material the use of which has not always been specifically authorized by the copyright owner. We are making such material available in our efforts to advance understanding of environmental, political, human rights, economic, democracy, scientific, and social justice issues, etc. We believe this constitutes a ‘fair use’ of any such copyrighted material as provided for in section 107 of the US Copyright Law. In accordance with Title 17 U.S.C. Section 107, the material on this site is distributed without profit to those who have expressed a prior interest in receiving the included information for research and educational purposes.  If you wish to use copyrighted material from this site for purposes of your own that go beyond ‘fair use’, you must obtain permission from the copyright owner.


NOTICE  Information on these pages contains forward-looking statements that involve risks and uncertainties. Markets and instruments profiled on this page are for informational purposes only and should not in any way come across as a recommendation to buy or sell in these assets. You should do your own thorough research before making any investment decisions. MATASII.com does not in any way guarantee that this information is free from mistakes, errors, or material misstatements. It also does not guarantee that this information is of a timely nature. Investing in Open Markets involves a great deal of risk, including the loss of all or a portion of your investment, as well as emotional distress. All risks, losses and costs associated with investing, including total loss of principal, are your responsibility.