![]()
![]()
Economic & Technical Analysis for the Active Trader

Technical Analysis
Market Road Maps | HPTZ Methodology
Extensive Technical Analysis and Market Road Maps for major indexes, commodities, and FOREX. The High Probability Target Zones Methodology (HPTZ) is used to locate significant supports / resistances, patterns, break-out opportunities and other technicals of importance. The method creates a market “road map” that clearly identifies potential trade opportunities, potential targets (HPTZ’s) and the levels that should be looked at for entries, exits, and stops.
Gordon T Long
Global Macro Research | Macro-Technical Analysis
Technical Analysis
Market Road Maps | HPTZ Methodology

HPTZ High Probability Target Zones
The HPTZ Methodology was the subject of a Masters Thesis paper for the IFTA (International Federation of Technical analysis), and had the distinction of being published in their 2015 yearly journal. (Direct D/L Link for PDF; pg.15: Identification of High Probability Target Zones).
Several different technical tools and methods are integrated and overlapped via a common denominator. When these perspectives all appear to align, converge or show a confluence in a specific time & price area on the chart, we have a High Probability Target Zone to look towards.
Setting up the chart to find HPTZ’s identifies the significant technicals for the market, creating an accurate market road map that can be used as the backbone for any investing or trading style.
We’ve been doing this for a while. Below is a video exemplifying the charts and method, created when we were still TRIGGER$.ca. The charts in the video below were real time market assessments, published to a subscriber base. “Proof of concept” for the HPTZ Methodology was not done through standard back testing, but rather real time published analysis over several years were used.
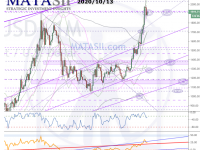
- GOLD 2020 10 13
October 13, 2020
TRIGGER$ Technical Analysis Market Road Maps | HPTZ Methodology COMMODITIES Gold Previous Monthly Previous Monthly Updates: Chart initially created 2019/08/11. Below you can see previous updates as we followed the market; last image below is the current market as of 2020 10 13. Previous Weekly We - SPX Update – Technical Alert
August 31, 2020
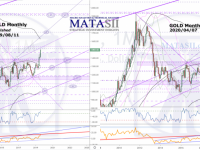
Economic & Technical Analysis for the Active Trader Technical Analysis Market Road Maps | HPTZ Methodology Extensive Technical Analysis and Market Road Maps for major indexes, commodities, and FOREX. The High Probability Target Zones Methodology (HPTZ) is used to locate significant supports - GOLD Hits 8 Month Target
April 9, 2020
TRIGGER$ Technical Analysis Market Road Maps | HPTZ Methodology COMMODITIES Gold Previous Monthly Our last technical update for Gold (Aug 11th, 2019) offered the monthly chart below (left) for consideration. The current view (right) shows the market holding and bouncing around between significant - OIL Dump Captured, What’s Next?
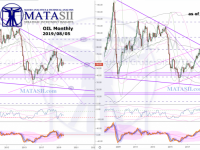
April 6, 2020
TRIGGER$ Technical Analysis Market Road Maps | HPTZ Methodology COMMODITIES Oil OIL DUMP CAPTURED: Our previous oil update (Aug 5th/2019) can be seen on the left, with the current market on the right. At that time, the market was sitting on a significant Fib ratio, inside an obvious wedge or - S&P Technical Update – Wheres the Bottom?
March 26, 2020
MATASII Subscription Options
Full Site Access (all sections)
SUBSCRIBE
FULL SITE ACCESS
$55/monthly
SUBSCRIBE
FULL SITE ACCESS
$550/yearly
Gordon T Long Macro Research (only)
SUBSCRIBE
GTL MATA
$35/monthly
SUBSCRIBE
GTL MATA
$350/yearly
SII – Strategic Investment Insights (only)
SUBSCRIBE
SII
$35/monthly
SUBSCRIBE
SII
$350/yearly
TRIGGER$ HPTZ Technical Analysis (only)
SUBSCRIBE
TRIGGER$
$35/monthly
SUBSCRIBE
TRIGGER$
$350/year
Pay-Per-View
– single serving analysis starting at $0.99!