
TRIGGER$ Technical Analysis
Market Road Maps | HPTZ Methodology
COMMODITIES
Gold
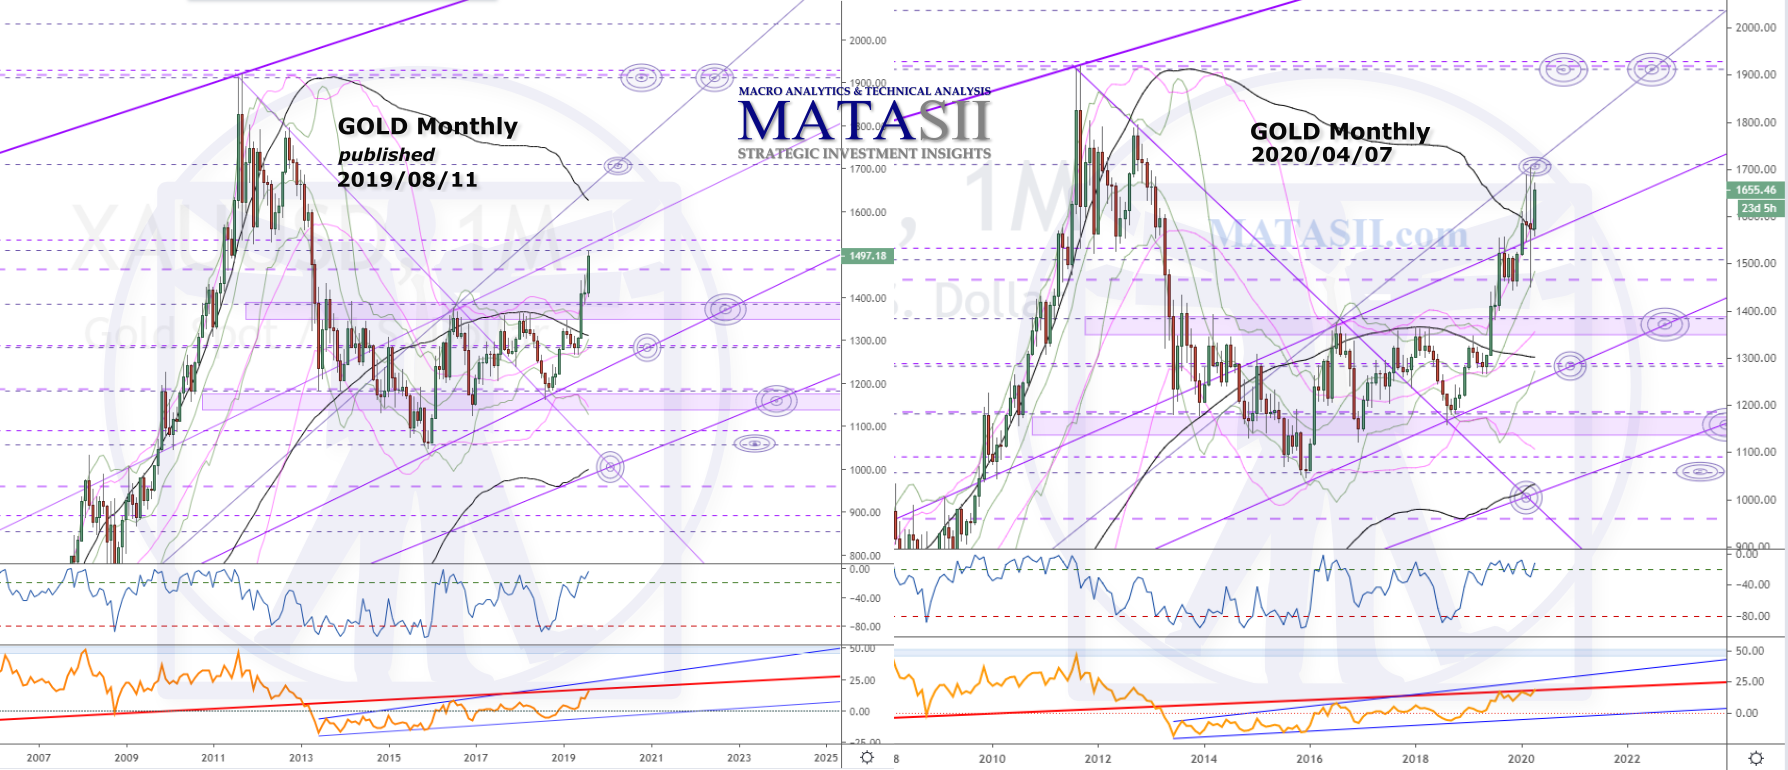
Previous Monthly
Our last technical update for Gold (Aug 11th, 2019) offered the monthly chart below (left) for consideration. The current view (right) shows the market holding and bouncing around between significant technicals previously identified; then breaking resistance and lifting in to a target placed 8 months out in front of the market.
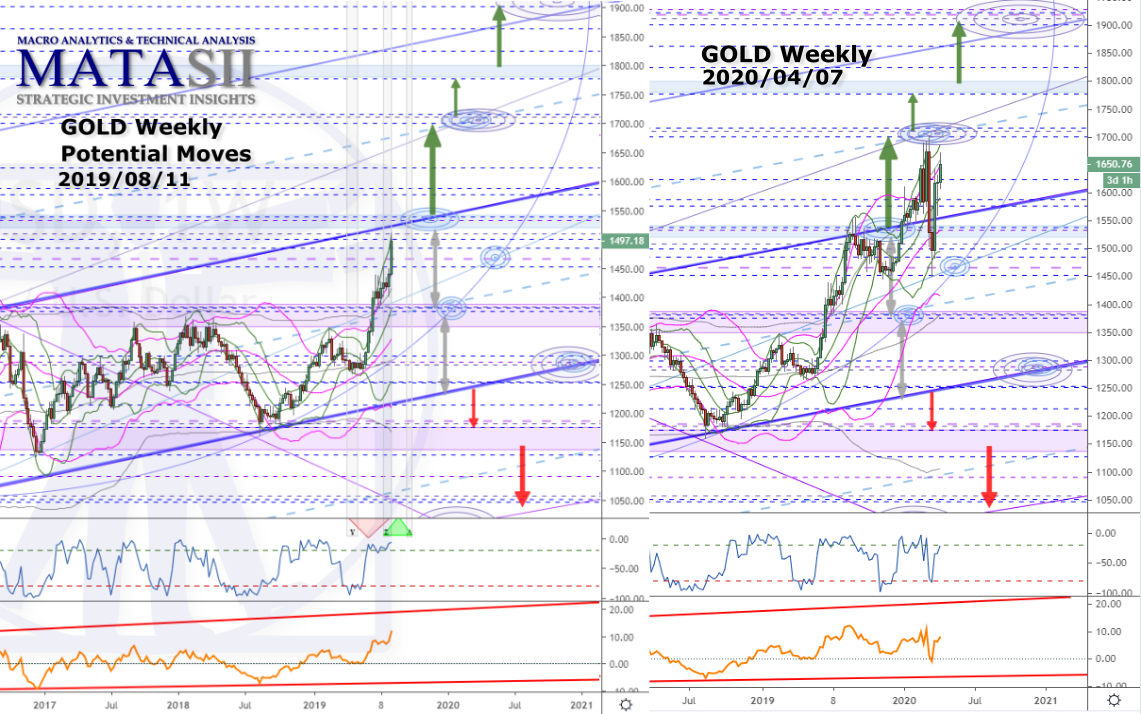
What’s Coming Next?
SUBSCRIBE To MATASII Full Site Access or TRIGGER$ to see current updated charts and the next potential market moves!
MATASII Subscription Options
Full Site Access (all sections)
SUBSCRIBE
FULL SITE ACCESS
$55/monthly
SUBSCRIBE
FULL SITE ACCESS
$550/yearly
TRIGGER$ HPTZ Technical Analysis (only)
SUBSCRIBE
TRIGGER$
$35/monthly
SUBSCRIBE
TRIGGER$
$350/year