![]()
![]()
Economic & Technical Analysis for the Active Trader

Technical Analysis
Market Road Maps | HPTZ Methodology
Extensive Technical Analysis and Market Road Maps for major indexes, commodities, and FOREX. The High Probability Target Zones Methodology (HPTZ) is used to locate significant supports / resistances, patterns, break-out opportunities and other technicals of importance. The method creates a market “road map” that clearly identifies potential trade opportunities, potential targets (HPTZ’s) and the levels that should be looked at for entries, exits, and stops.
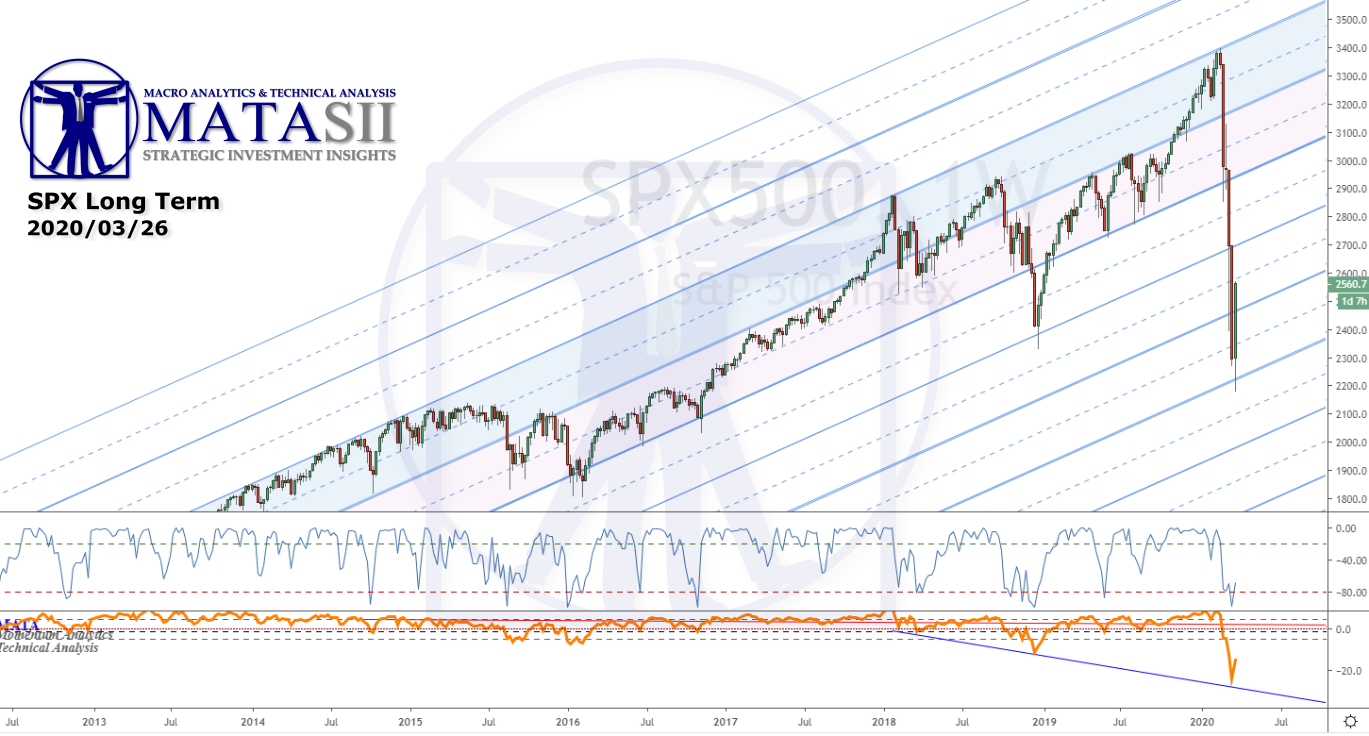
SPX Update – Technical Alert
Previous Perspectives
Let’s take a quick look at what we were seeing last update…
We had offered up a few different scenarios for potential market movement.
The first two were variations of a possible diamond pattern, both exiting to the positive (P1);
P2 was a reversal and lift back up to new highs, similar to the volatility of the drop;
P3 was a possible scenario for a correction at the supports and then more down.
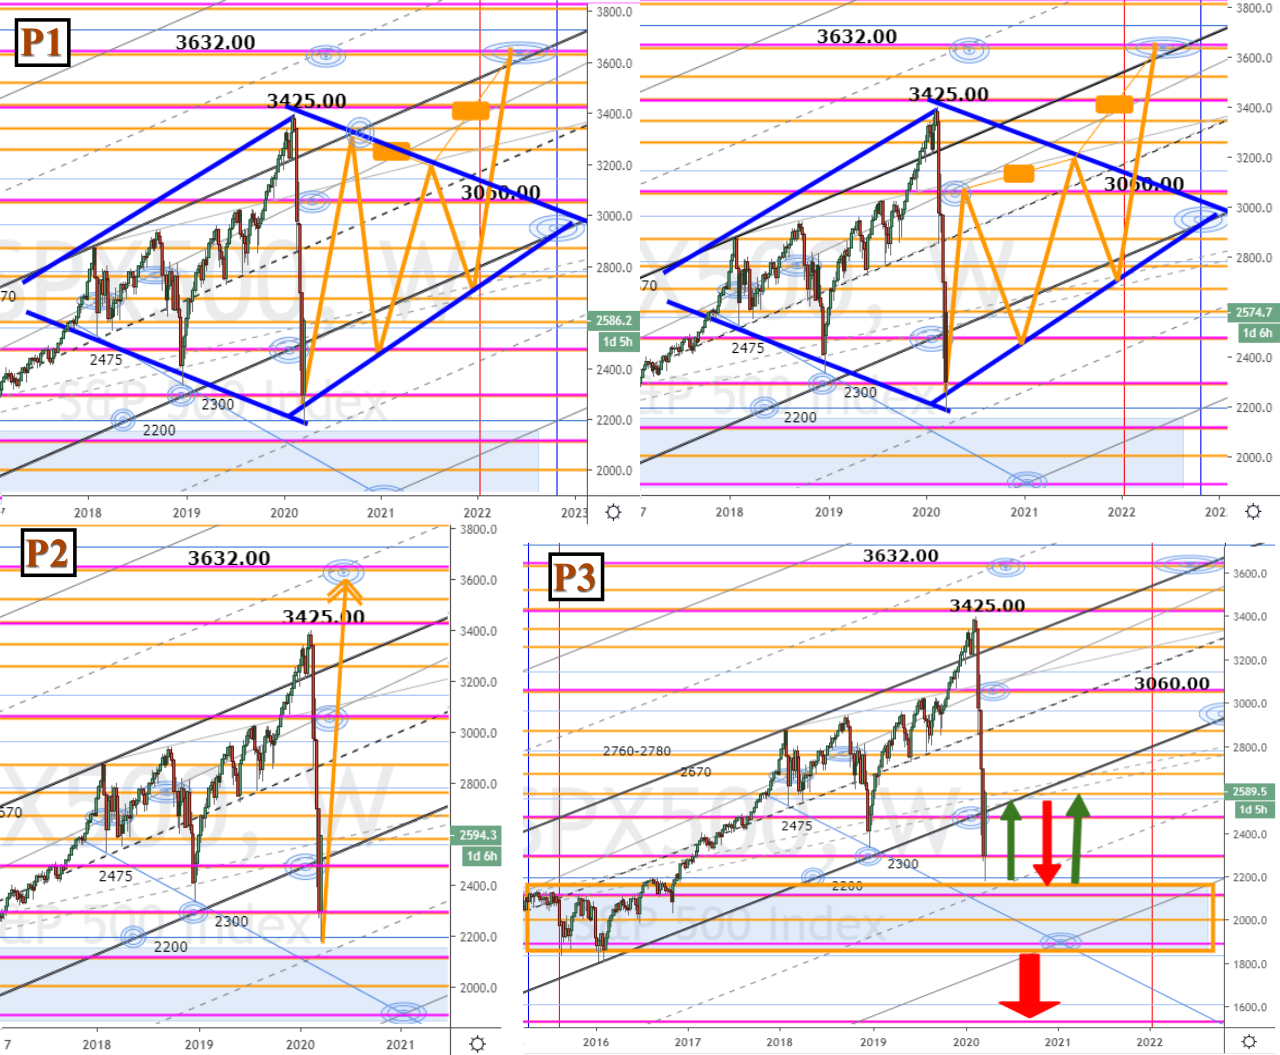
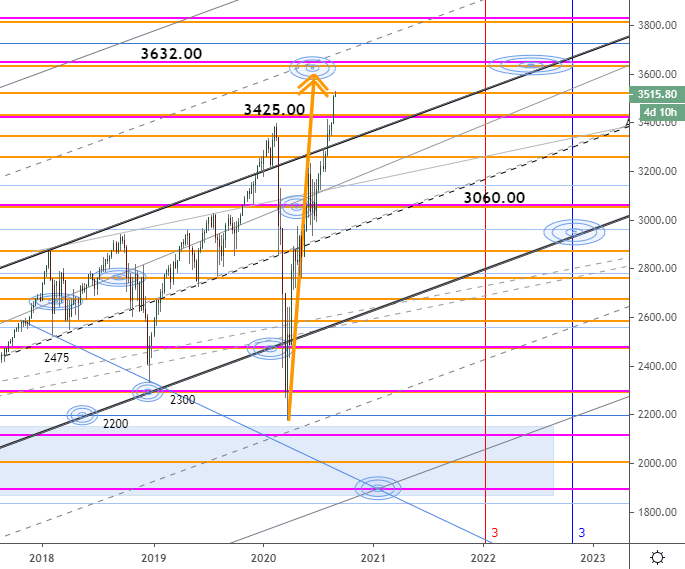
“P2: a severe lift similar to the drop that has occurred” is what we said at the time, and we can see that this is just about exactly what occurred. Note the 1st 3 possibilities all had a lift and move up in to their respective potentials.
Current market with P2 from last update included below.
What’s Coming Next? You should now clearly see the reason for our Technical Alert. Will the market hold or break through? What are the next likely scenarios?
SUBSCRIBE To MATASII Full Site Access or TRIGGER$ to see current updated charts and the next potential market moves!
MATASII Subscription Options
Full Site Access (all sections)
SUBSCRIBE
FULL SITE ACCESS
$55/monthly
SUBSCRIBE
FULL SITE ACCESS
$550/yearly
TRIGGER$ HPTZ Technical Analysis (only)
SUBSCRIBE
TRIGGER$
$35/monthly
SUBSCRIBE
TRIGGER$
$350/year