Gordon T Long
Global Macro Research | Macro-Technical Analysis
TIPPING POINTS
INFLATION
HAS WAVE 2 OF INFLATION BEGUN?
OBSERVATIONS: THE “COMMON MAN” CPI
Since January 2021, the consumer price index, or CPI, has risen a cumulative 18%. Yet that measure obscures more than it reveals!
Jason Trennert, founder of the brokerage and financial advisory firm Strategas, recently highlighted an alternative way to survey inflation: the Common Man CPI. Rather than focus on an unnecessarily large basket of goods, this tool exclusively measures price increases for necessities such as food, energy, clothing and shelter.
Between 2020 and 2024, the Common Man CPI has shown worse inflation in nearly every month than the official CPI. That’s in part because of how the tools take in the economy. The CPI includes discretionary spending, including such non-necessities as luxury products, hotel stays and entertainment. As the cost of living has skyrocketed in recent years, particularly for necessities, Americans have cut back on discretionary spending and racked up unprecedented credit-card debt, which now stands at a record $1.13 trillion.
As consumers buy fewer non-essentials and focus on things like housing, the CPI becomes less illustrative of how the typical American family is contending with inflation. Whereas the annual CPI increase peaked around 9% in June 2022, the alternative measure reached nearly 12%—and a third faster, in June 2022.
Additionally, because it relies on rent prices to impute an estimate for the cost of homeownership, the CPI has been underestimating the true increase in shelter prices. Data on home prices and interest rates indicate the cost of homeownership is up 80% since January 2021, not 20% as implied by the CPI.
But it is actually even worse than that because the CPI also does not properly factor in the personal services we have come to rely on. From haircuts, to car repairs to home repairs to veterinary & handyman services the average family faces cost increases that even dwarf CPI measures. The worst part is overall Service Inflation is the one problem that the Fed has little solution for because high Fed Funds rates only exacerbate the services problem!
All this helps explain why so many Americans are dissatisfied with the economy today: Prices for the things they’re actually buying have risen—and continue to—considerably faster than common metrics report. This also means that real inflation-adjusted earnings have fallen more than the Bureau of Labor Statistics’s official 4.2% decline since January 2021.
It’s true that not everyone is feeling the pain of Bidenomics. Many high-income earners who in 2021 already held assets like equities or housing saw their portfolios rise considerably. These people are also more likely to have incomes that adjust faster to inflation and real earnings that tend to decline less than average, if at all.
Those on the rest of the income ladder aren’t as well-positioned. Many of them see much slower pay increases amid rising prices. This is especially true for those on fixed incomes, which are adjusted for inflation only once a year, at best.
If the White House wants to understand why the public isn’t getting on board with the president’s program, it’s because they’re looking at and living with different economic realities.
WHAT YOU NEED TO KNOW!
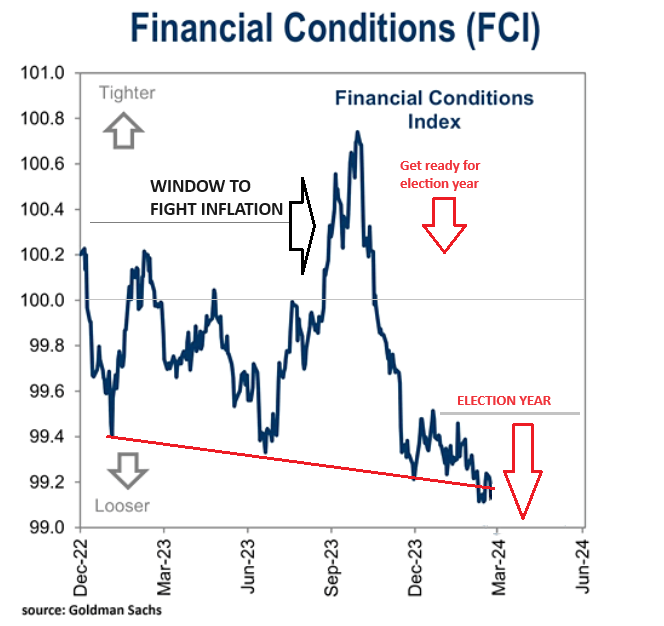 A LOST WINDOW TO FIGHT INFLATION
The all important Financial Conditions Index has collapsed in a loosening “freefall” as the Election year games begin.
The Fed was late to the battle against inflation as it believed Inflation was “Transitory”. When they realized it was a serious problem they panicked with exploding Fed Fund Rate hikes. Realistically the rate hikes could only go so high or it would trigger a financial crisis. The Fed was trapped unless Inflation fell quickly before election year pressures took over. Inflation came down but the battle is a long ways from over.
Though markets have exploded higher the Fed is signaling it expects to cut rates three time before final election ballots are cast. It the Fed about to pour gasoline on the fire? Biden may require this?
RESEARCH
HAS WAVE 2 INFLATION ARRIVED? We are seeing the following:
-
- Steadily Rising Inflation Breakevens.
- Citi’s Inflation-Surprise Index has resurged back to its highest since Dec 2022.
- The US Cleveland Fed Inflation Nowcasting CPI Y-o-Y for the current period shows inflation signals are flashing red once again.
- Price increases are sweeping over the agricultural sector has evidenced by the Invesco DB Agriculture Fund exploding higher since year beginning.
- Concurrent dramatic increases in Gold, Silver, & Bitcoin are a strong indication of rising Inflation expectations.
- Surging Global Oil Prices as evidenced by significant movements in Brent, WTIC and the XLE. This is steadily working itself into rising consumer and commercial prices at the pump.
- ISM Manufacturing Prices Paid is steadily rising.
THE GDI BUFFETT INDICATOR
- We have marked up the Buffett Indicator to reflect GDI which we believe should be used during current economic conditions.
- Our work illustrates that current market valuations are at extremes not previously seen even including the major valuations distortions which occurred during the infamous Dotcom hysteria (associated with expectations for the implementation of Internet technology).
- As Buffett always advises – You must have a “Margin of Safety” in the price you pay. The charts don’t show it using GDI.
- Buffett also cautions that there is a difference between “the price you pay and the value you get”.
DEVELOPMENTS TO WATCH
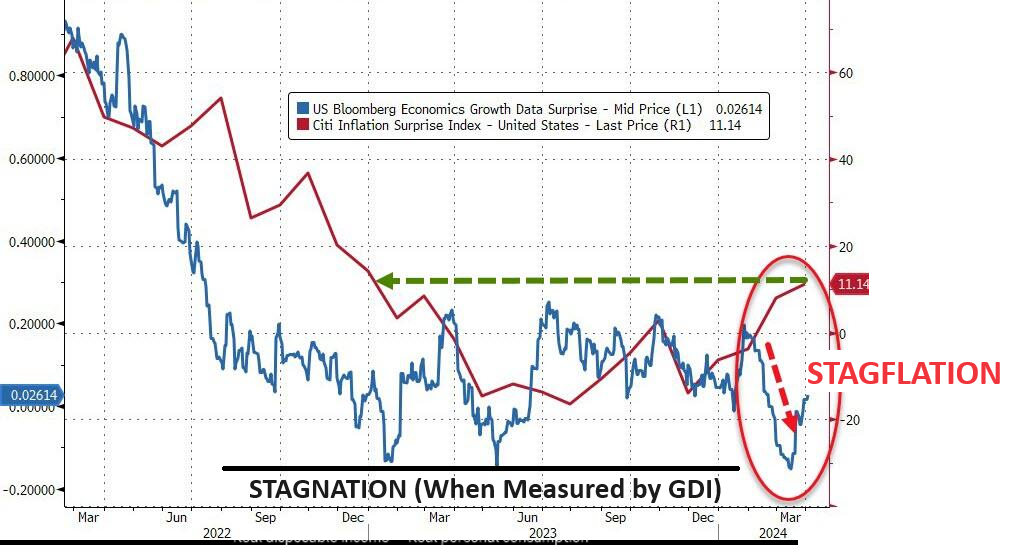 HINTS OF STAGFLATION?
-
- Citi’s inflation-surprise index has surged back to its highest since Dec 2022 (chart right). Meanwhile when overlaid with Bloomberg’s economic growth surprise index we see they are going in opposite directions??
- Though Bloomberg’s data suggests economic Stagflation, together they signal that Stagflation may be nearer than many yet appreciate.
GROWING US TRADE DEFICIT & THE LOOMING “TARIFFS OF THE TRADE”!
-
- The US trade Deficit has once again began widening. Though Exports rose by the most in a year in February, Imports saw its second fastest gain in two years. The solid outturn caused a widening in the U.S. trade deficit and suggests net exports will be a drag on U.S. real GDP growth in the first quarter.
- U.S. exports advanced $5.8 billion in February, while imports shot $7.1 billion higher.
- The larger gain in imports caused the U.S. trade deficit to widen by $1.3 billion to a balance of -$68.9 billion.
- February marks the third consecutive month, or the fifth time in six months, that the trade balance has widened, a somewhat different pattern than the sharp narrowing we saw throughout 2022 and in the first half of last year
THIS IS NEITHER GOOD FOR THE US$ NOR INFLATION
 GLOBAL ECONOMIC REPORTING
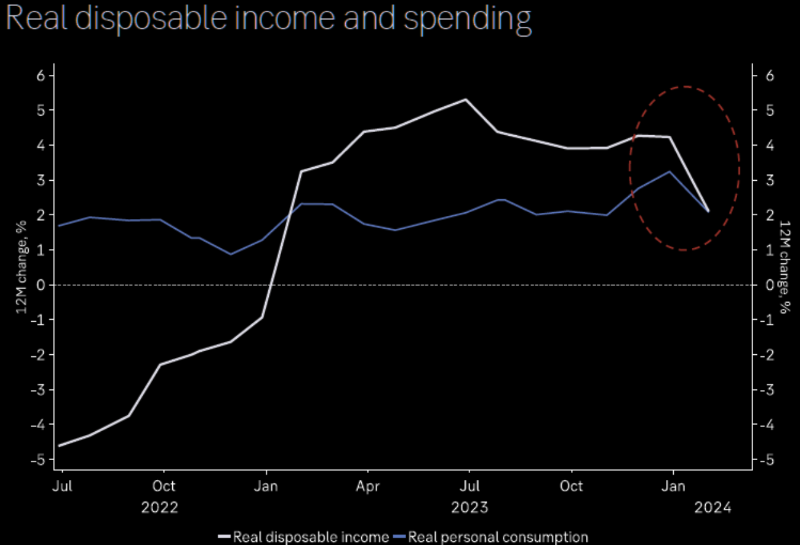
- REAL DISPOSABLE INCOME & SPENDING
- It looks like real disposable income and consumer spending is starting to come under pressure. (chart right)
- MARCH LABOR REPORT (NFP)
- The extremely hot March Labor report delivered the breathing room the Fed needed to buy more time in tis fight against inflation.
- The US added a whopping 303K jobs, tied for the highest since Jan 2023! was above the highest Wall Street estimate of 290K and was the latest multiple-sigma beat to expectations, this month coming in at 4 Sigma.
FAIR USE NOTICE This site contains copyrighted material the use of which has not always been specifically authorized by the copyright owner. We are making such material available in our efforts to advance understanding of environmental, political, human rights, economic, democracy, scientific, and social justice issues, etc. We believe this constitutes a ‘fair use’ of any such copyrighted material as provided for in section 107 of the US Copyright Law. In accordance with Title 17 U.S.C. Section 107, the material on this site is distributed without profit to those who have expressed a prior interest in receiving the included information for research and educational purposes. If you wish to use copyrighted material from this site for purposes of your own that go beyond ‘fair use’, you must obtain permission from the copyright owner.
NOTICE Information on these pages contains forward-looking statements that involve risks and uncertainties. Markets and instruments profiled on this page are for informational purposes only and should not in any way come across as a recommendation to buy or sell in these assets. You should do your own thorough research before making any investment decisions. MATASII.com does not in any way guarantee that this information is free from mistakes, errors, or material misstatements. It also does not guarantee that this information is of a timely nature. Investing in Open Markets involves a great deal of risk, including the loss of all or a portion of your investment, as well as emotional distress. All risks, losses and costs associated with investing, including total loss of principal, are your responsibility.