IN-DEPTH: TRANSCRIPTION - LONGWave - 03-06-24 - MARCH - False Beliefs & Market Shocks
SLIDE DECK
TRANSCRIPTION
SLIDE 2
Thank you for joining me. I'm Gord Long.
A REMINDER BEFORE WE BEGIN: DO NO NOT TRADE FROM ANY OF THESE SLIDES - they are COMMENTARY for educational and discussions purposes ONLY.
Always consult a professional financial advisor before making any investment decisions.
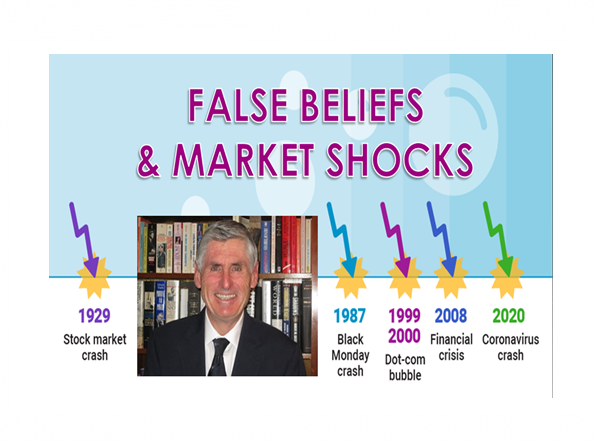
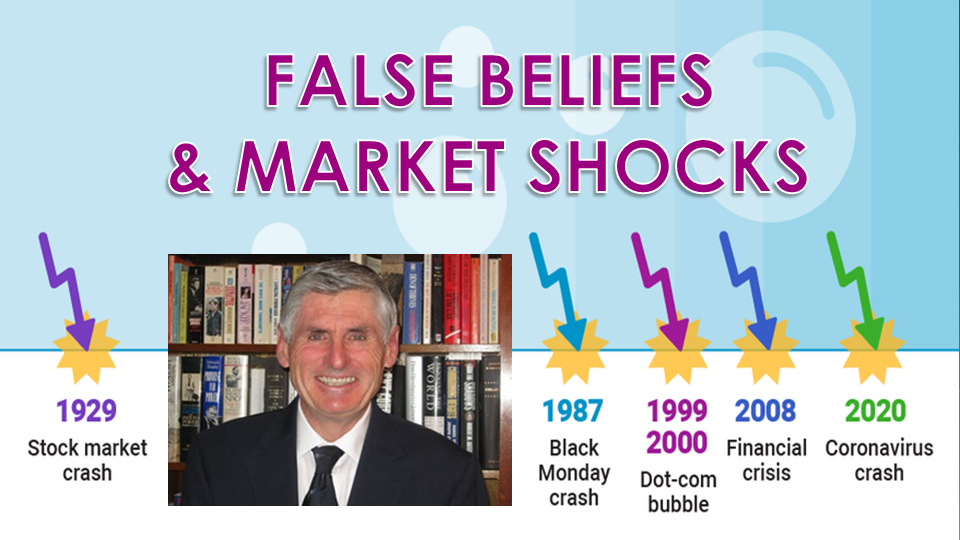
CHART 3 - COVER
In my years of being involved in the equity markets I have experienced many major corrections and few of what can only be termed as crashes!
It is my experience that the big market moves downward have been the result of the markets suddenly realizing that a major underpinning of their expectations was based on a False Belief. Suddenly a market development, a report or statement by someone who should know, triggers the shock that they and everyone else was wrong.
The shock spreads like a wave through the markets, which then react with everyone selling and no one buying. The misbalance and urgency to correct portfolios positions results in a “get me out at any cost” as the markets accelerates lower.
AGENDA
This is what I want to discuss in this session.
There is a growing chance that the markets are currently operating on a mistaken belief.
As such I want to discuss the subjects outlined here.
SLIDE 5
Before we talk about what that false believe might be, let’s talk about the precarious position the market now finds itself in. A position that is unfortunately “ripe” for something to take it into a major “tailspin”.
SLIDE 6
I have showed this chart a few times lately to illustrate the seriousness of the current market predicament for something to be able to cause it to tumble lower in quite a dramatic fashion.
The Trifecta points out both how rare it is to have these three events potentially occur simultaneously and the historical results of such an occurrence.
They are:
- Extremely narrow market breadth that has taken the market up in a parabolic or geometric lift.
- A pattern of a double top which has developed over the longer term …. and
- A Recession occurring as the outside strength or second top is put in place.
This combination has proven extremely problematic for the equity markets.
SLIDE 7
To say that current market breadth is narrow is almost an absurd statement realizing the degree such has occurred. The Magnificent Seven stocks now completely dominate the US and even the global equity market.
We have seen this before in the 70’s with the Nifty 50 and during the 2000 Dotcom Bubble with the major Internet providers but the current situation has taken it to another level.
SLIDE 8
Will markets in general, and US Technology growth stocks in particular, continue to Party like it’s 1999? Or are we heading for a 2000-style crunch?
In the late 1990s, the story was that the internet was going to generate exceptional earnings growth for companies in tech, media, and telecoms. The bubble inflated until by early 2000 the prospective earnings yield on US growth stocks was pitiful, both in absolute terms, and when compared to the real yields, in US fixed income (whether bonds or bills).
The valuation gap was just too great and the market started to have doubts about when clicks would be converted into revenues. The market was forced back to the realization that fundamentals really do matter. With that the bubble burst.
SLIDE 9
Fundamentals are again in such a position as is the Trifecta!
SLIDE 10
So what could go wrong? The list is longer than most realized but there is one that to us stands out.
On the inflation front, the increasing risk is that January’s uptick in US CPI and PPI inflation, along with the year-to-date rebound in oil prices, is not just noise but the start of a reversal from last year’s disinflationary trend. Any more upside surprises in the inflation data will make the Fed more cautious about the timing and pace of rate cuts, because inflation remains the principal consideration determining Fed policy.
If the Fed keeps short rates elevated while continuing quantitative tightening, the relatively high real yields on bonds and especially on bills could begin to weigh on US growth stocks. If inflation surprises on the upside, and the Fed confounds expectations for rate cuts, “T-bill and chill” will likely prove the investment strategy of choice.
SLIDE 11
The Federal Reserve has been consistent in its message that we should expect the Fed Funds Rate to remain higher for longer!
SLIDE 12
There message has been clear but the reality is the market doesn’t believe them and is trading against what they are telling us.
Everyone has bought into the belief that the Fed Pivot is a foregone conclusion and though it appears not to be about to occur in March as expected less than 90 days ago, most feel it will occur by June or July.
But what if suddenly everyone realizes that Inflation is not beaten, it is still very much alive and rates will not only be higher for longer, but in fact may be headed to higher levels?
Now that would be a market moving shock!
SLIDE 13
But is that even a real possibility?
Many feel that with rates so high something somewhere will break. This is what has occurred many times previously when the Fed raised rate s and the Fed was forced to “PIVOT”.
But will this be the case as usual? We saw when we had a Banking Crisis last spring with the collapse of SVB (Silicon Valley Bank) that the Fed didn’t take down rates but rather targeted its focus on a specific Facility called the Bank Term Lending Program. It thereby avoided a PIVOT.
Wouldn’t it do that again if it had the choice?
A severe recession many say will also cause the Fed to PIVOT but in the last 3-4 months that thinking seems to have subsided with the belief that we will have a “soft Landing” or no Recession at all. Why?
The Financial Conditions Index is “Easy” and for those paying attention even the Fed’s own charts on the subject show it has always been “easy” throughout the period of its’ Quantitative Tightening (QT) program . What gives?
SLIDE 14
Investors are finding out that Liquidity is simply not in short supply even with bank credit tightening. This many find confusing and futilely try to explain it.
We have shown for some time now it is the result of a number of factors including Stealth Liquidity programs we have laid out many times since last June’s Debt Ceiling increase.
SLIDE 15
Clearly too many, the disinflationary downward impulse we have been experiencing has run its course.
SLIDE 16
In fact we are now seeing signs of inflation once again raising its head.
SLIDE 17
Is it possible Inflation is not behind us and in fact more of it is still in front of us?
Is there a chance there is no Fed PIVOT coming (at least not as currently expected)?
This would mean the markets have been wrong. Their belief has been false.
Their portfolio positioning is wrong.
Higher rates or even “Higher for Longer” is not good for equity investors.
We should expect wholesale disruptions if that were the case!
SLIDE 18
Let’s talk about whether that is realistically a possibility?
We should be asking, … why are 5 year Inflation Breakevens now rising strongly?
SLIDE 19
Why are 2 Year Inflation Breakevens also rising?
Historically, the Fed always follows the 2Y Treasury Yield which the banks and debt auctions determine. This says the banks are signaling to the Fed rates are headed higher.
With the 2 Year Break Evens ramping again, this also suggests this may be the 1970s type of inflation if the manufacturing industry does not get cooking. And, judging from the most recent ISM numbers, the fiscal money being spent is not helping much in that way at all yet.
SLIDE 20
The Three Month Core PCE, which includes Supercore, seemingly turned the corner recently.
SLIDE 21
If this is 1he”good inflation” type, then it might be like the 1940s
SLIDE 22
… where increasing services inflation (wages) are accompanied people working to rebuild the country.
SLIDE 23
This means Real wages continue to grow above trend, warning of wage-price spiral if people spend instead of save.
This is what we are seeing.
SLIDE 24
We have long suggested that inflation moves in mysterious ways and specifically in Waves.
We saw it in the 70’s
SLIDE 25
We saw it in the 1930-40’s
SLIDE 26
We have seen it recently when we look at it closely and compare it to the 1966-1982 periods.
SLIDE 27
We have been suggesting this for some time and outlined it in our 2023 Thesis: The Great Stagflation.
SLIDE 28
What everyone may be currently missing is that the US is a Services Economy. It isn’t the Manufacturing dependent economy it once was.
Services are hugely important!
It’s where consumers spend the majority of their money. Many services are essential to modern life, such as housing and related services, healthcare, insurance, broadband and telecommunications, auto repairs, transportation, etc. Inflation is notoriously hard to eradicate from services.
Services inflation is almost entirely a function of domestic economic activity. The Fed has to get that lower. But it appears they can't!
SLIDE 29
Inflation in core services is tough to beat, and it can dish up big head-fakes – a fact that Powell has mentioned a few times, hence the Fed’s wait-and-see approach.
Last time this type of core-services inflation occurred – in the 1970s and 1980s – there were clear signs that inflation was cooling sharply, and we thought repeatedly that the high interest rates at the time had beaten inflation back down, which caused the Fed to ease, only to find out that we’d fallen for an inflation head-fake, and then the Fed jacked up rates even further.
The head fakes occurred over the 15 years between 1966 and when core services inflation finally peaked at 11% in 1981. So this is the “core services” PCE price index which excludes energy and the oil-price shocks at the time.
SLIDE 30
The upturn is also occurring in the heavily services oriented Euro zone
SLIDE 31
Over the past year or so, the Fed has been intensely discussing inflation in “core services,” which is where inflation had shifted to in 2022, from goods inflation which had spiked into mid-2022 but then cooled dramatically. So “core services” is where it’s at. Core services are where consumers spend the majority of their money. Core services are all services except energy services. Core services inflation has been behaving badly for months, and in January, it spiked significantly.
The “core services” PCE price index spiked to 7.15% annualized in January from December, the worst month-to-month jump in 22 years (blue line), according to index data released today by the Bureau of Economic Analysis. Drivers of the spike were non-housing measures as well as housing inflation.
More on each category in a moment.
The six-month moving average, which irons out the month-to-month volatility, accelerated to 3.95% annualized, the worst since July, after having gotten stuck at the 3.5% level for three months in a row (red).
SLIDE 32
The bad behavior of core services inflation that we have been lamenting since June – and which was confirmed earlier this month by the nasty surprise in the CPI – is why Fed governors have said this year in near unison that they’re in no hurry to cut rates, but have taken a wait-and-see approach. And now the concept of rate hikes is cropping up in their speeches again.
For example, Fed governor Michelle Bowman said in the speech yesterday, that she was “willing to raise the federal funds rate at a future meeting should the incoming data indicate that progress on inflation has stalled or reversed.”
Even year-over-year, core services inflation has now reversed and accelerated to 4.1%.
SLIDE 33 - The 7 Core Services Categories.
Core services – services without energy services, such as electricity – are grouped into seven PCE price indices, and we’ll look at them individually.
This is where consumers do the majority of their spending. The month-to-month data in these categories of core services can be crazy volatile (blue in the charts below), so we’ll focus on the six-month moving average, which irons out this volatility and shows the recent trends (red in the charts).
Housing inflation is hot. The PCE price index for housing accelerated to 6.4% annualized in January from December, the worst since September (blue).
The six-month moving average, which irons out the month-to-month volatility but still shows the more recent trends, accelerated to 5.7% annualized, having now been in the same range since August (red).
Housing inflation has backed off from the crazy spike in 2022 and through February 2023. But then it just got stuck at this hot level of 5.5%-plus, and has refused to cool further and seems to be re-accelerating now.
The housing index is broad-based and includes factors for rent in tenant-occupied dwellings; imputed rent for owner-occupied housing, group housing, and rental value
SLIDE 34
Financial Services and Insurance: +17.2% month-to-month annualized (blue); +5.5% six-month moving average annualized; third month in a row of acceleration (red):
SLIDE 35
Food services and accommodation: +8.25 month-to-month annualized (blue); +4.0% six-month moving average annualized; second month of acceleration (red)
SLIDE 36
Health Care: +3.5% month-to-month annualized (blue), +2.4% six-month moving average annualized, roughly stable at this rate for the past five months (red).
SLIDE 37
Transportation services: +0.4% month-to-month annualized (blue), +3.2% six-month moving average annualized (red).
This includes motor vehicle services, such as maintenance and repair, car and truck rental and leasing, parking fees, tolls, and public transportation from airline fares to bus fare.
SLIDE 38
Recreation services: +4.6% month-to-month annualized (blue), +4.9% six-month moving average annualized (red).
This includes cable, satellite TV and radio, streaming, concerts, sports, movies, gambling, vet services, package tours, repair and rental of audiovisual and other equipment, maintenance and repair of recreational vehicles, etc.
SLIDE 39
Other services: +9.4% month-to-month annualized (blue), +2.1% six-month moving average annualized (red).
A vast collection of other services where people spend lots of money on, including broadband, cell-phone, and other communications; delivery; household maintenance and repair; moving and storage; education and training across the board; professional services, such as legal, accounting, and tax services; union dues, professional associations dues; funeral and burial services; personal care and clothing services; social services such as homes for the elderly and rehab services, etc.
SLIDE 40
So the Core PCE price index, which includes core services plus non-energy goods, accelerated month-to-month to 5.1% annualized, the worst in 12 months (blue). The six-month moving average accelerated to 2.5% annualized (red).
SLIDE 41
Certainly something to really keep an eye on!
But in there even more warning signs than just Inflation as it is currently measured. How about things that drive Inflation?
SLIDE 42
The economy is not slowing down, it is reaccelerating.
Growth expectations for 2024 saw a big jump following the Fed pivot in December and the associated easing in financial conditions. Growth expectations for the US continue to be revised higher.
SLIDE 43
Following the Fed pivot in December, the labor market remains tight, jobless claims are very low, and wage inflation is sticky between 4% and 5%.
SLIDE 44
Surveys of small businesses show that more small businesses are planning to raise selling prices.
SLIDE 45
Manufacturing surveys show a higher trend in prices paid another leading indicator of inflation.
SLIDE 46
ISM services prices paid is also trending higher.
SLIDE 47
Surveys of small businesses show that more small businesses are planning to raise worker compensation.
SLIDE 48
Asking rents are rising, and more cities are seeing rising rents, and home prices are raising, see the ninth, tenth, and eleventh charts.
SLIDE 49
The S&P CoreLogic Case-Shiller Home Price Index has also started to lift.
SLIDE 50
Financial conditions continue to ease FURTHER following the Fed pivot in December with record-high IG issuance, high HY issuance, IPO activity rising, M&A activity rising, and tight credit spreads and the stock market reaching new all-time highs.
With financial conditions easing significantly, it is not surprising that we saw strong nonfarm payrolls and inflation in January, and we should expect the strength to continue.
All this suggests that there is a strong chance the Fed will spend most of 2024 fighting inflation. As a result, yield levels in fixed income will likely stay high.
… and may be forced to be increased?
SLIDE 51
What can we conclude?
SLIDE 52
I spent a lot of time in 2023 explaining the Volcker miracle that beat the inflation of the 1970’s. It wasn’t raising of interest rates!
It was about reducing liquidity which he did as shown in the red box. By keeping it managed properly during the 40 years since we had the “Great Moderation”.
Unfortunately all those hard learned lessons were thrown out with Covid as an excuse to literally send liquidity through the roof.
If no other reason this is why Inflation will return.
SLIDE 53
In the near term we need to watch Services very closely. The key indicator to consider is the blue line, which represents fluctuating business costs of the service sector.
This line serves as a robust leading indicator for inflationary trends. Its ascent in 2021 accurately preceded the surge in inflation, and it also forecasted the subsequent decline in 2022.
Currently, the blue line hints at an incoming inflation uptick, indicating rising business costs, which often lead to price hikes that fuel inflation.
SLIDE 54
With a lots of other Bearish signals as shown here also clearly visible , it would take much to cause a stampede.
When the markets are at highs, most are already in the market, who is left to buy?
Like a theatre when everyone is seated and someone yells fire! Getting out becomes a real problem!
SLIDE 55
We highlighted a number of major macro issues in our recent videos. These also needs to be taken into account.
It may be time to take risk off the table?
That last 5% is usually turns out to be the most expensive.
SLIDE 56
As I always remind you in these videos, remember politicians and Central Banks will print the money to solve any and all problems, until such time as no one will take the money or it is of no value.
That day is still in the future so take advantage of the opportunities as they currently exist.
Investing is always easier when you know with relative certainty how the powers to be will react. Your chances of success go up dramatically.
The powers to be are now effectively trapped by policies of fiat currencies, unsound money, political polarization and global policy paralysis.
SLIDE 57
I would like take a moment as a reminder
DO NO NOT TRADE FROM ANY OF THESE SLIDES - they are for educational and discussions purposes ONLY.
As negative as these comments often are, there has seldom been a better time for investing. However, it requires careful analysis and not following what have traditionally been the true and tried approaches.
Do your reading and make sure you have a knowledgeable and well informed financial advisor.
So until we talk again, may 2023 turn out to be an outstanding investment year for you and your family?
I sincerely thank you for listening!