|
The Fed doesn’t say what these Intermediaries, who are paying for order flow, are actually doing to make money. They are “off-exchange” and not actually themselves doing fulfillment. They may in turn be selling the intermediation data to?
Who is actually regulating all the players in the process chain or are they like ‘Shadow Banks” that aren’t fully under the purview of single entity like the SEC?
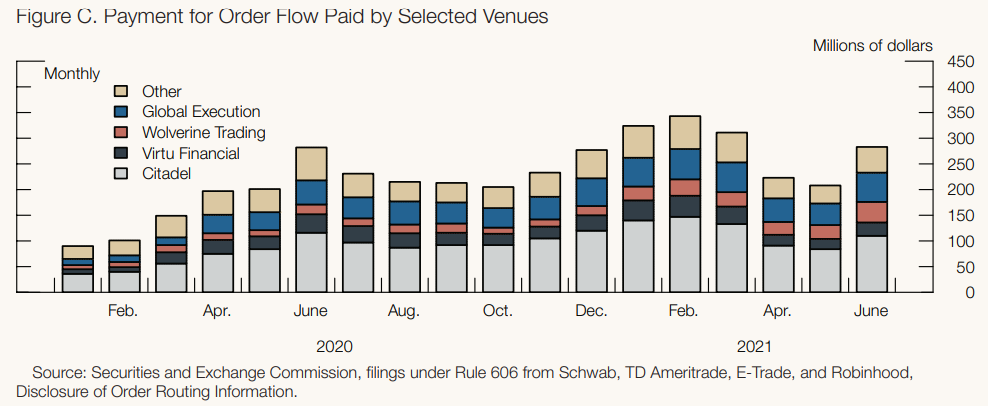
“The structure of the current market for order flow was heavily influenced by a series of regulations adopted between 2005 and 2010 that allows retail brokers to choose the venues where customer orders are executed so long as customers receive the “national best bid or offer” price or better.7 Since 2010, several off-exchange venues, including those run by Citadel, Virtu Financial, and others, have emerged and thrived.”
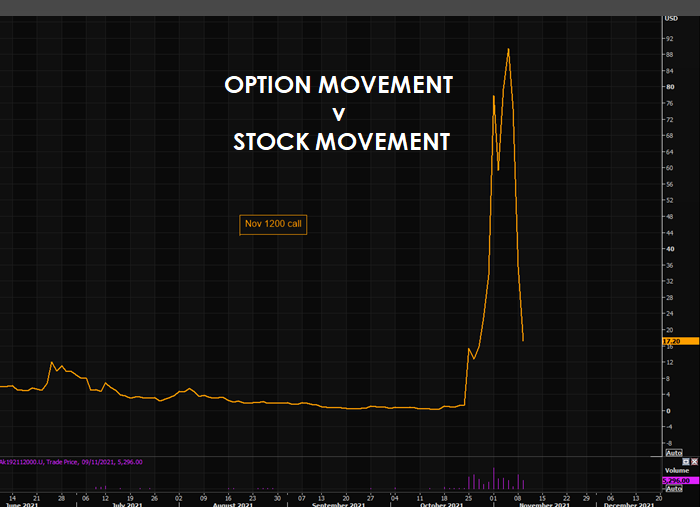
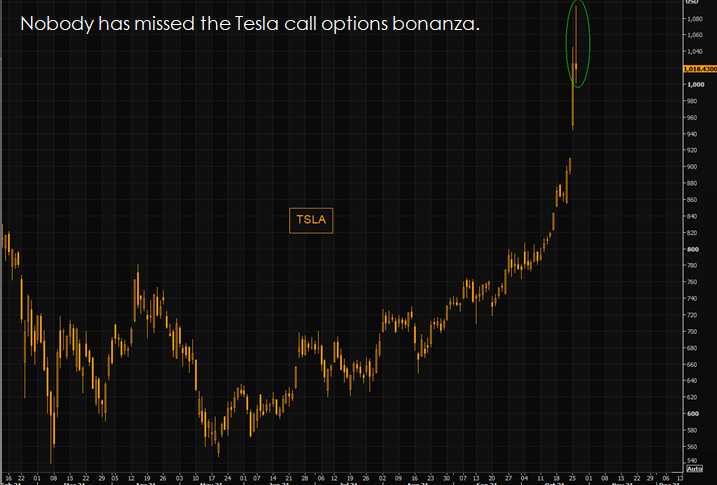
Giving someone the best price when the best price is set behind closed curtains is one thing, but frankly not the real issue here. The problem in options is what does the transaction price actually mean when it can and does change with theoretically no trading volumes even changing hands? It can and does change with time only. That is called THETA. How exactly does time decay work with price, volatility, and volatility change rate all moving?
Everyone knows options decay with time but few seem to fully appreciate just how the decay rate changes continuously with THE RATE OF CHANGE OF VOLATILITY (VVIX)
STOCKS FLOWS: WAS ABOUT “FRONT RUNNING“
OPTIONS FLOWS: IS ABOUT “THETA“!
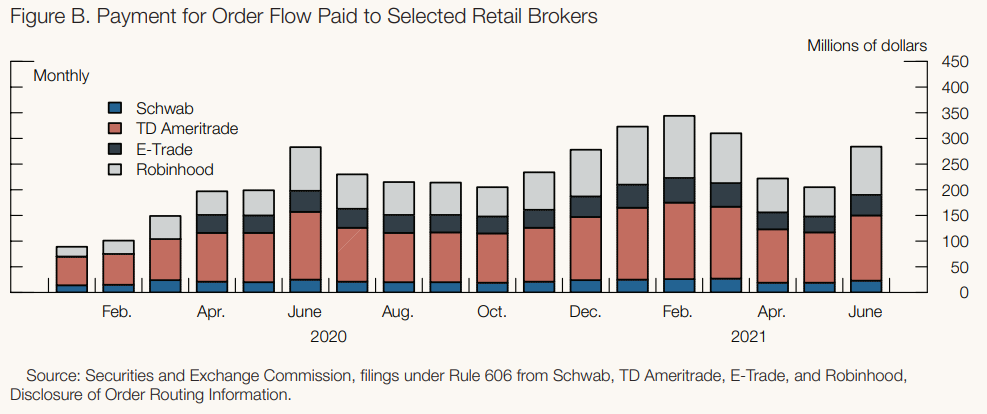
“Aggregate PFOF levels for the retail brokerage firms in figure B (above) have recently fallen below the record highs from earlier in 2021, as have trading volumes. However, on a per-share basis, PFOF (not shown) has continued to rise, which in part reflects a shift in the volumes mix toward options trades, where per-share PFOF is highest“.
…. and where might the per-share PFOF be the highest?
EXAMPLES: AMC & GAMESTOCK
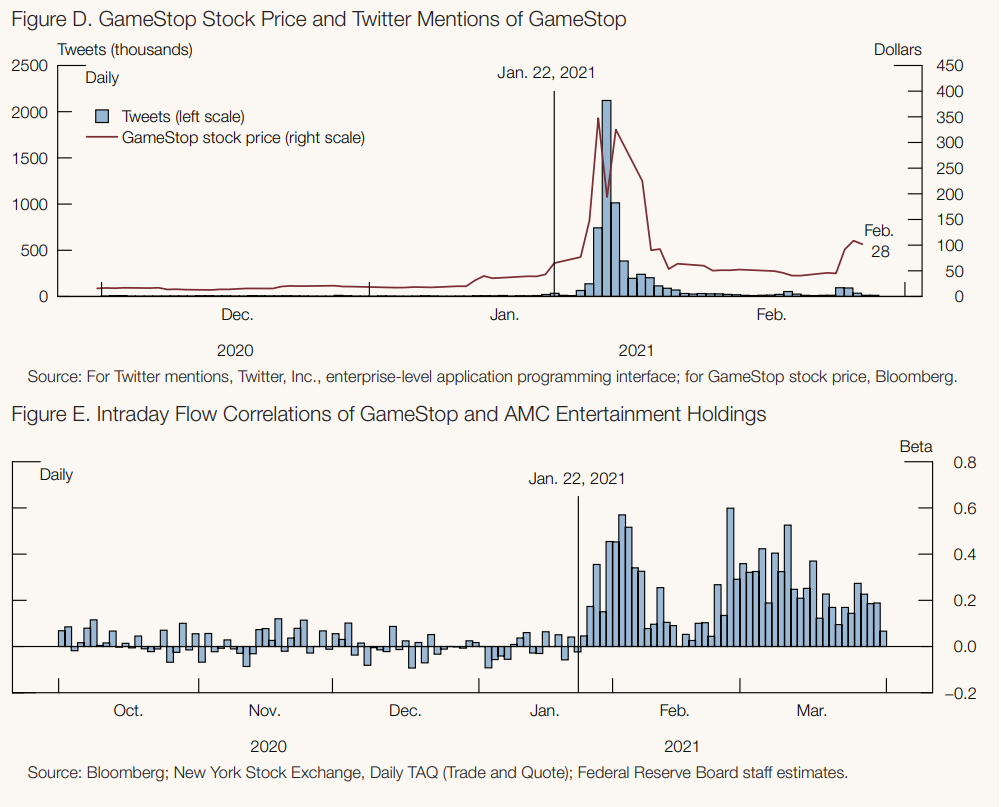
“The January 2021 meme stock episodes offer a case study for the interaction of social media and stock prices. Twitter posts spiked in late January on days when daily trading volumes for GameStop (GME), as well as other meme stocks, rose sharply (figure D). These spikes also coincided with a jump in intraday volatility, as the daily standard deviation of one-minute price changes increased more than 10-fold from less than 0.25 percent to greater than 2.5 percent. Coincident with the dramatically higher price volatility, intraday trading flows for meme stocks (such as GME and AMC Entertainment Holdings [AMC]) became much more correlated, as illustrated in figure E. Higher flow correlations have the potential to amplify liquidity shortages in equity markets and may lead to price dislocations if sufficiently large.”
|

 Many ‘Meme Traders’ may be making money (