Gordon T Long
Global Macro Research | Macro-Technical Analysis
TIPPING POINTS
INFLATION PRESSURES
STUBBORN INFLATION PRESSURES DELAYING FED PIVOT
Weakening Inflation is not sticking to the script by coming down relatively quickly. Instead it is universally stubbornly coming in higher than expectations and actually increasing on a M-o-M basis. This isn’t just a US problem as was seen this week, as EU Core CPI surged, with German CPI coming in at 9.3%. over the last four weeks the markets have being caught off guard and are reacting in three ways:
-
- Increasing the Fed Funds Terminal Rate to a 5.5% high,
- Increasing Duration Term Risk Premiums on Treasury Debt,
- By pushing out the timing of projected Fed rate cuts and the fully expected “Fed Pivot”.
As a result Cash is quickly becoming King with better risk adjusted returns than equities. As a consequence money has begun leaking from equities into Money Market Assets. There is increasing concern that this may become a flood when compounded by both stock buybacks and insider buying weakening! We explore this possibility in this newsletter.
=========
WHAT YOU NEED TO KNOW
 A near term “Fed Pivot” is now off the table as inflation is not subsiding as expected. This was confirmed as still a global problem as Spanish, German and overall EU CPI surged above expectations. During the week, the Terminal rate topped 5.50% and any expectation of a rate-cut in H2 2023 is gone. Does this push the Recession call out? We also consider this in this week’s newsletter.
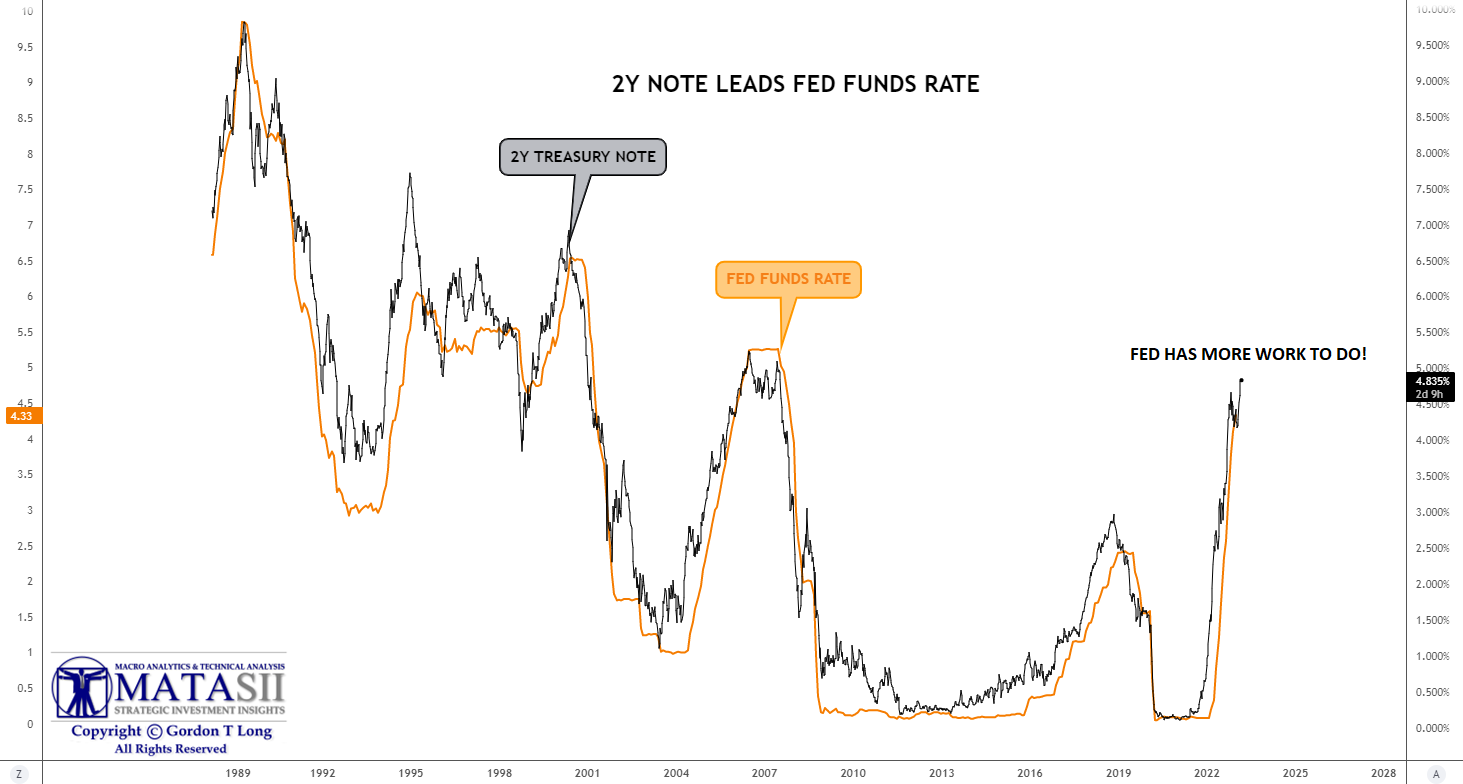
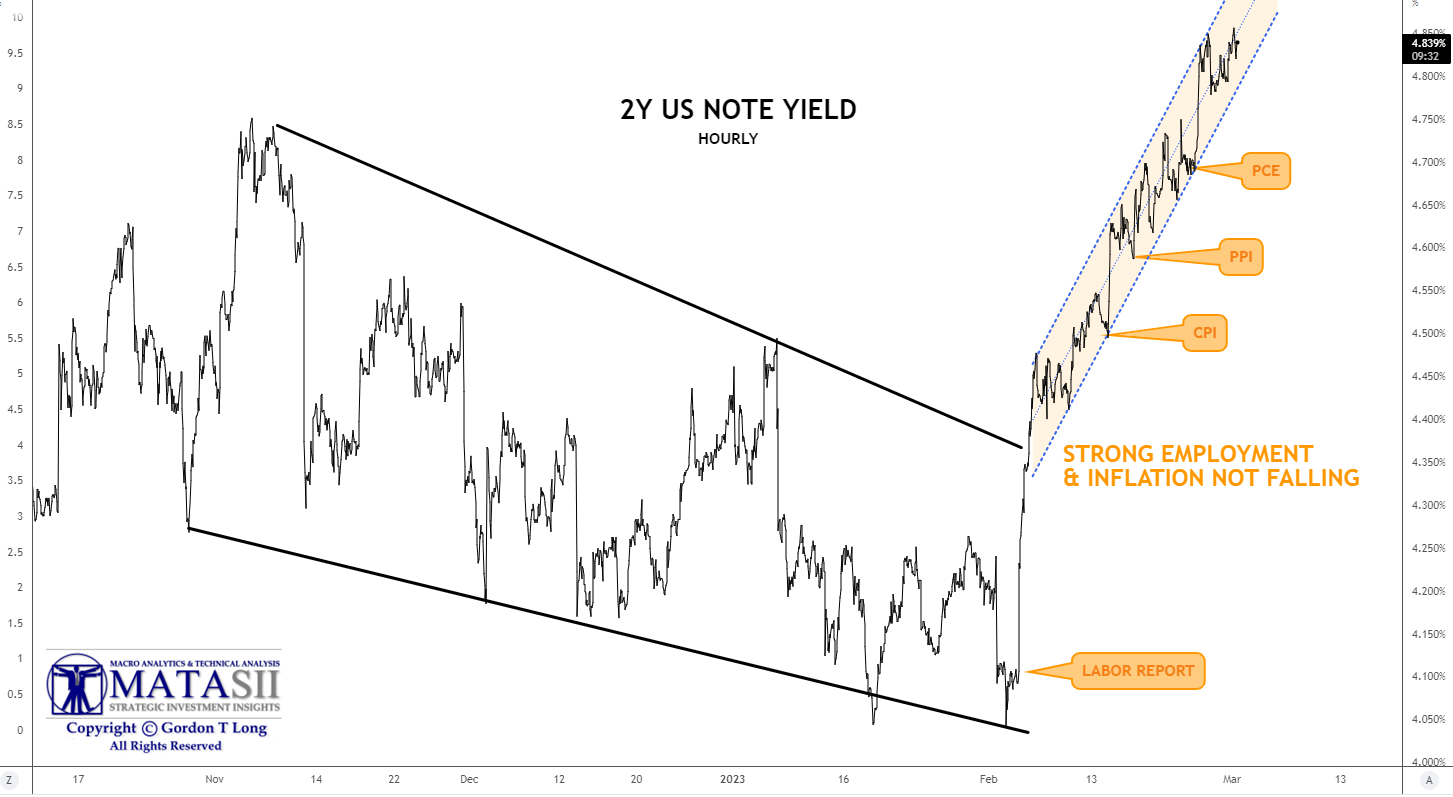
2Y TREASURY NOTE REACTS AND TELLS FED TO DELAY PIVOT!
-
- The Fed Funds Rate has historically always followed the 2Y UST Bill,
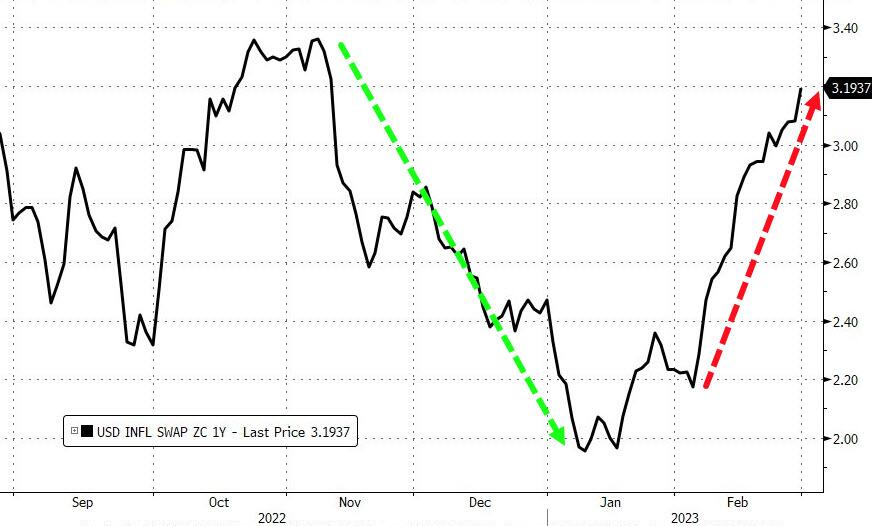
- Inflation expectations best represented by 1Y Inflation Swaps soared back to life in February pushing the 2Y UST Bill to nearly 5%.
- February releases were effectively the death toll for the Fed Pivot narrative as expectations for an H2 2023 rate-cut collapsed and the terminal rate outlook priced in rose significantly,
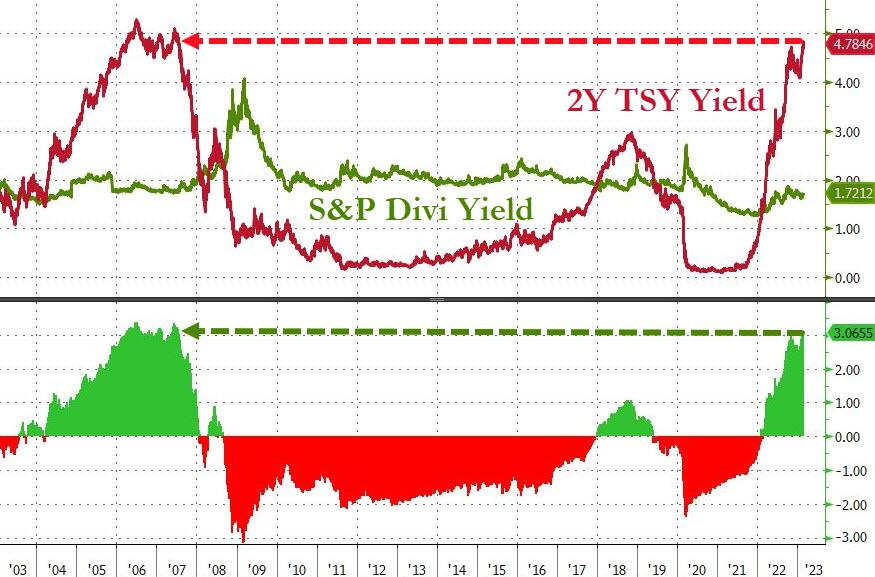
- This has resulted in a complete reversal in the previously worrying Financial Conditions Index and making the buying of US short term treasuries more attractive than S&P Equity Dividend yields. Treasury bills (2Y Note) are the cheapest to stocks since the very peak in 2007.
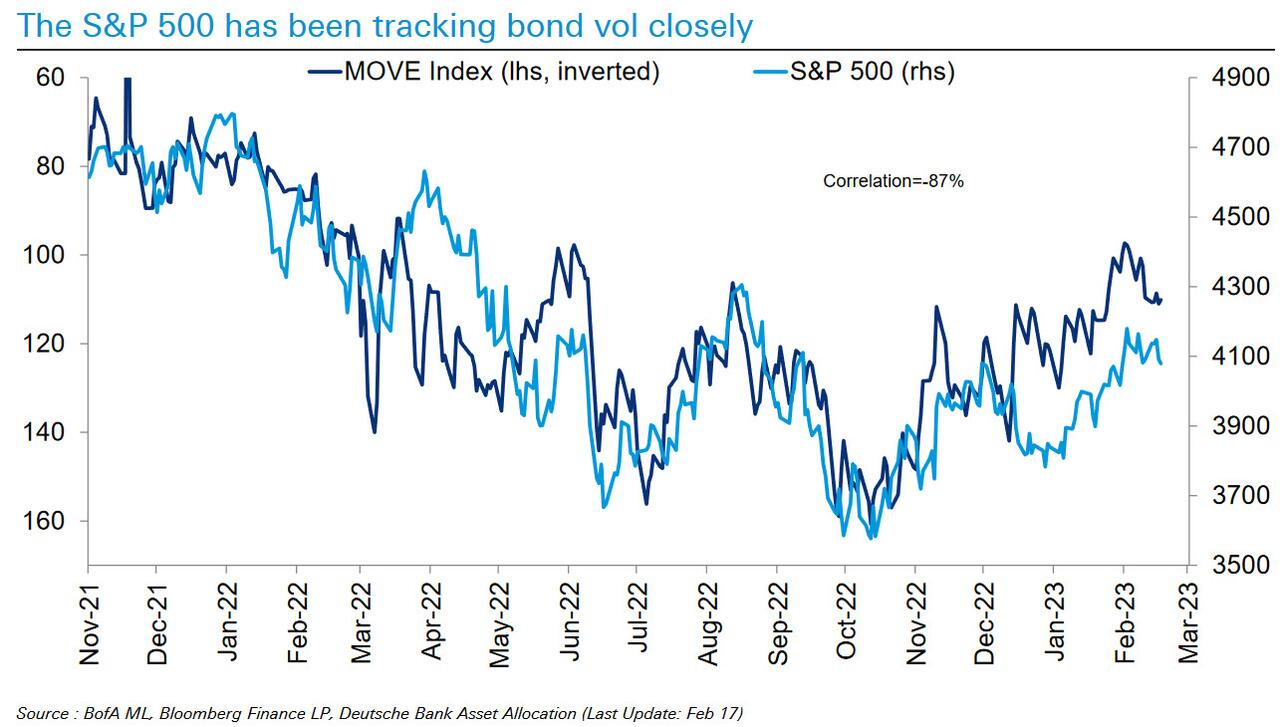
EQUITY MARKETS ARE FOLLOWING RATE VOLATILITY (THE ‘MOVE INDEX’)
-
- Throughout the last 5 years equity markets have closely followed central bank liquidity levels. This has changed and is now tracking treasury Bond Volatility (MOVE Index),
- The importance of the MOVE Index aligns with what the LEI is signaling. Anything more than a -1% YoY decline in US Leading Economic Indicator (LEI) has always led to a US recession within a few months. We’re are now at -6% YoY which increases speculation of a shift in Fed Policy and hence bond yields and value.
TERM PREMIUMS BEGINNING TO BE PRICED IN
-
- If bond holders are worrying that inflation is becoming embedded, then we should expect:
-
-
- Most immediately, yields would be biased structurally higher.
- Yields would likely decline less when the Fed cuts rates.
- This would lower the control the central bank have over longer-term borrowing costs.
-
CONCLUSION
-
- With interest rates now at levels that many investment professionals have not seen in their young careers, the timing is right for money to quickly shift towards safer, less volatile and an increasingly more attractive alternative of Money Market Assets
We fully expect an overdue recessionary deflationary scare to arrive in H2 2023.
=========
2 YEAR US TREASURY NOTE REACTS AND TELLS FED TO DELAY PIVOT!
THE FED ALWAYS FOLLOWS!
We have pointed out on numerous occasions that it is important to understand that the Federal Reserve actually follows the 2T Treasury Note. The easiest way to appreciate this is to appreciate that the Primary Dealers and Money Center Banks actually own the Federal Reserve, which operates under quasi government regulations, guidelines and controls with position appointments limited to the FOMC and not the regional bank governors who are the heads of the major banks. The real power has historically been held by the NY Federal Reserve centered on Wall Street. Effectively the 2 Year yield is determined by the trading actions of these Primary Dealers and Money Center Banks which the FOMC then uses as a key input for official monetary policy.
This reality can be seen by the historical illustration below, where the black 2T UST always leads the Fed Funds Rate in orange.
A SHOCKER TO EXPECTATIONS
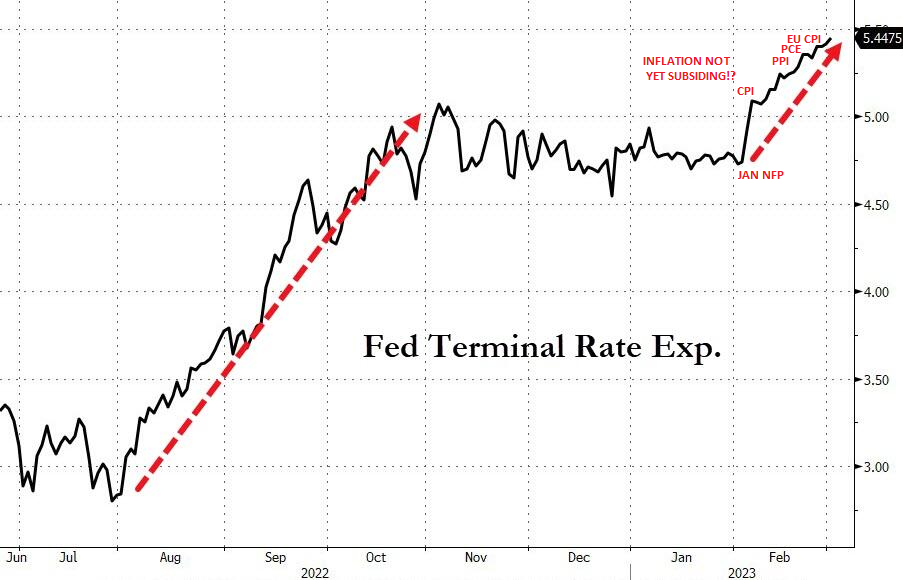
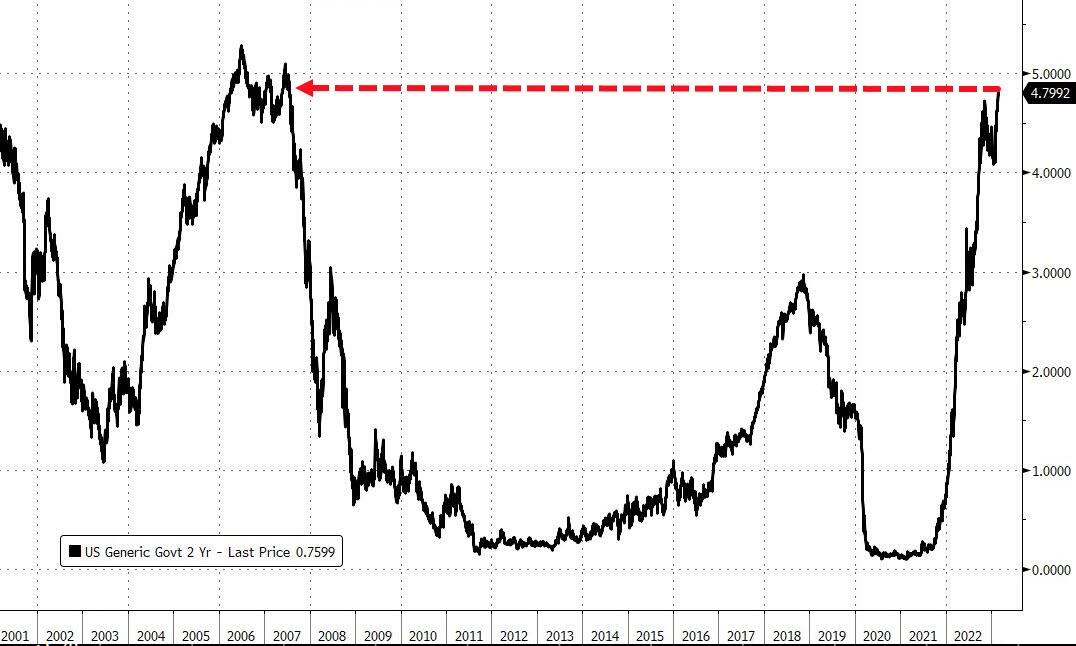 2Y UST BREAKS OUT VIOLENTLY!
With the shocking 517K new jobs release of the January Labor Non-Farm Payrolls (NFP) on February 3rd the 2Y UST Yield exploded upward breaking key overhead resistance. This was followed by surges from the CPI, PPI and PCE releases, which all signaled hotter than expected inflation.
February also saw the largest absolute jump in the Citi US Economic Surprise Index since July 2020.
The 2Y yield broke back above its November highs to its highest yield since July 2007
… prior to pre-Financial Crisis levels
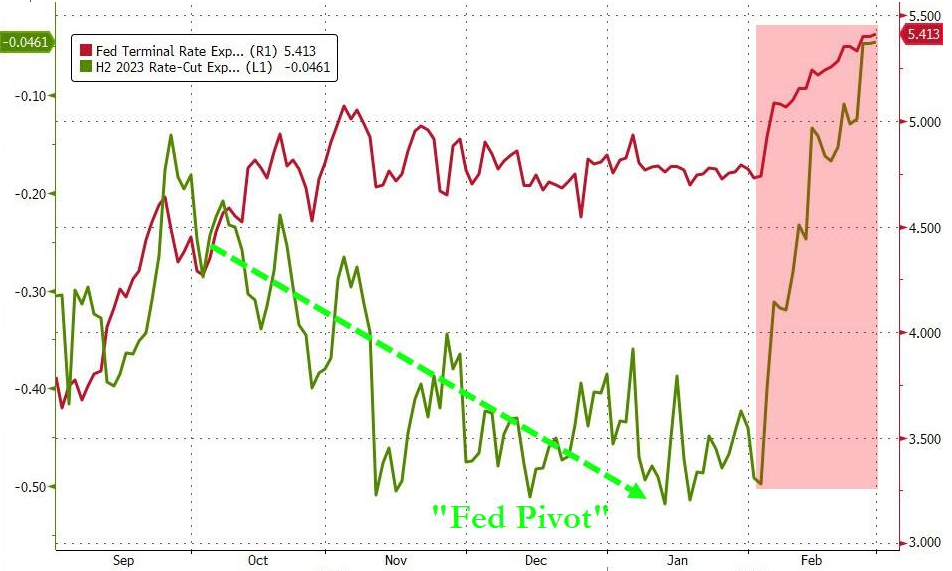
These February releases were effectively the death toll for the Fed Pivot narrative, as expectations for an H2 2023 rate-cut collapsed and the terminal rate outlook priced in rose significantly
Inflation expectations best represented by 1Y Inflation Swaps soared back to life in February
THE FED, TREASURY THROUGH THE BLS HAD TO RESET FINANCIAL CONDTIONS – QUICKLY!
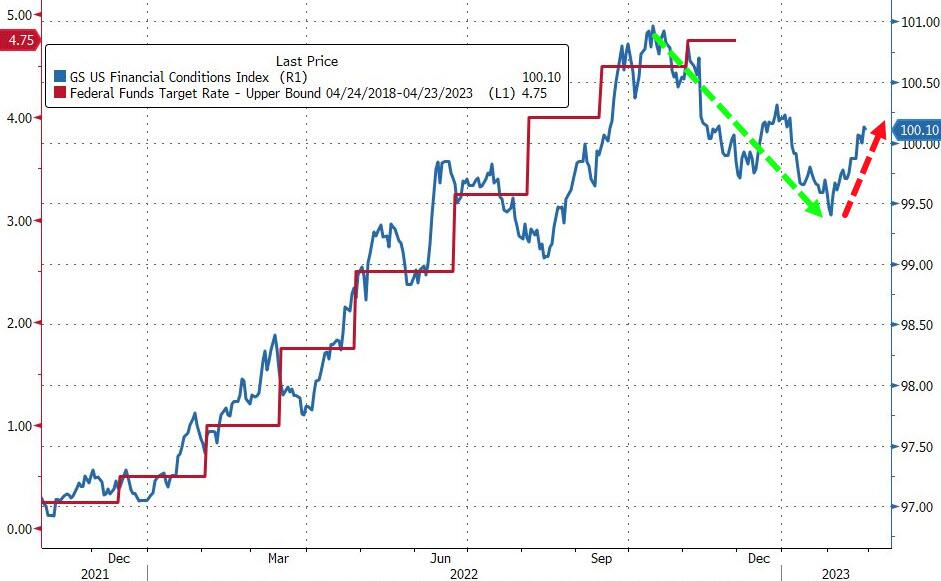 The results of this has been a complete reversal in the worrying Financial Conditions Index (right) and making the buying of US short term treasuries more attractive than S&P Equity Dividend yields (below). The cheapest to stocks since the very peak in 2007.
See our suspicions in our February 20th newsletter:
FED TIGHTENING, YET FINANCIAL CONDITIONS ARE TIGHTENING??
EQUITY MARKETS ARE FOLLOWING RATE VOLATILITY (THE ‘MOVE INDEX’)
Rates ‘vol’ has driven equities over last year or so. With rate volatility falling since March, this has been support for equities. However, when the recession comes this correlation will break down…
WHEN WE EXPECT TO SEE “FORMAL” RECESSION
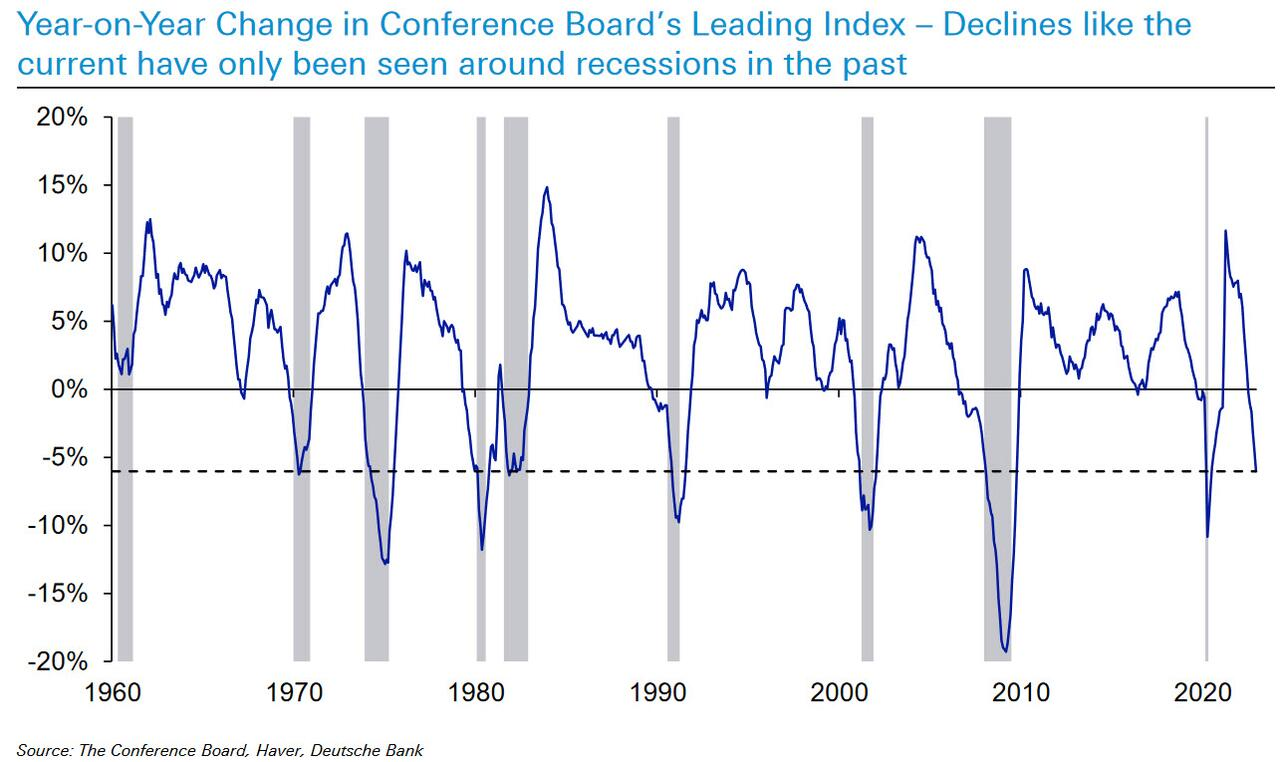 Anything more than a -1% YoY decline in US Leading Economic Indicator (LEI) has always led to a US recession within a few months. We’re now at -6% YoY.
Higher interest rates suffocate the most indebted parts of the economy – homeowners, homebuilders and housing investment – before it suffocates the broader economy. We mentioned this sequence in this month’s UnderTheLens video.
- HOPE – Housing + New Orders (ISM) + Corporate Profits + Employment
- 2Y >>> FED FUNDS RATE >>> BANK TIGHTENING >>> LOAN DELINQUENCIES >>> LAYOFFS >>> DEFAULTS
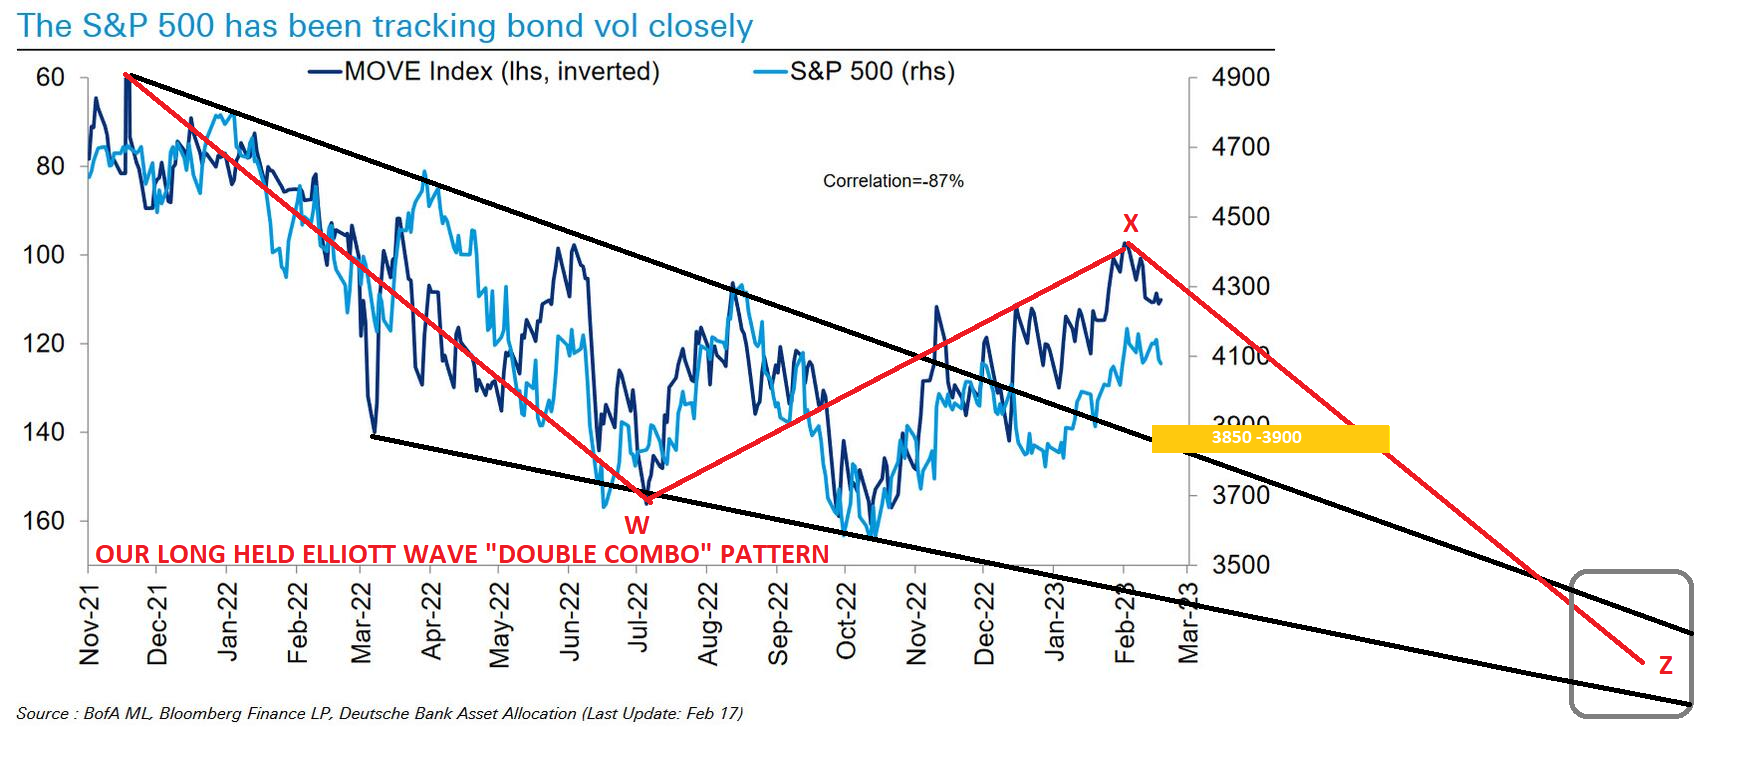
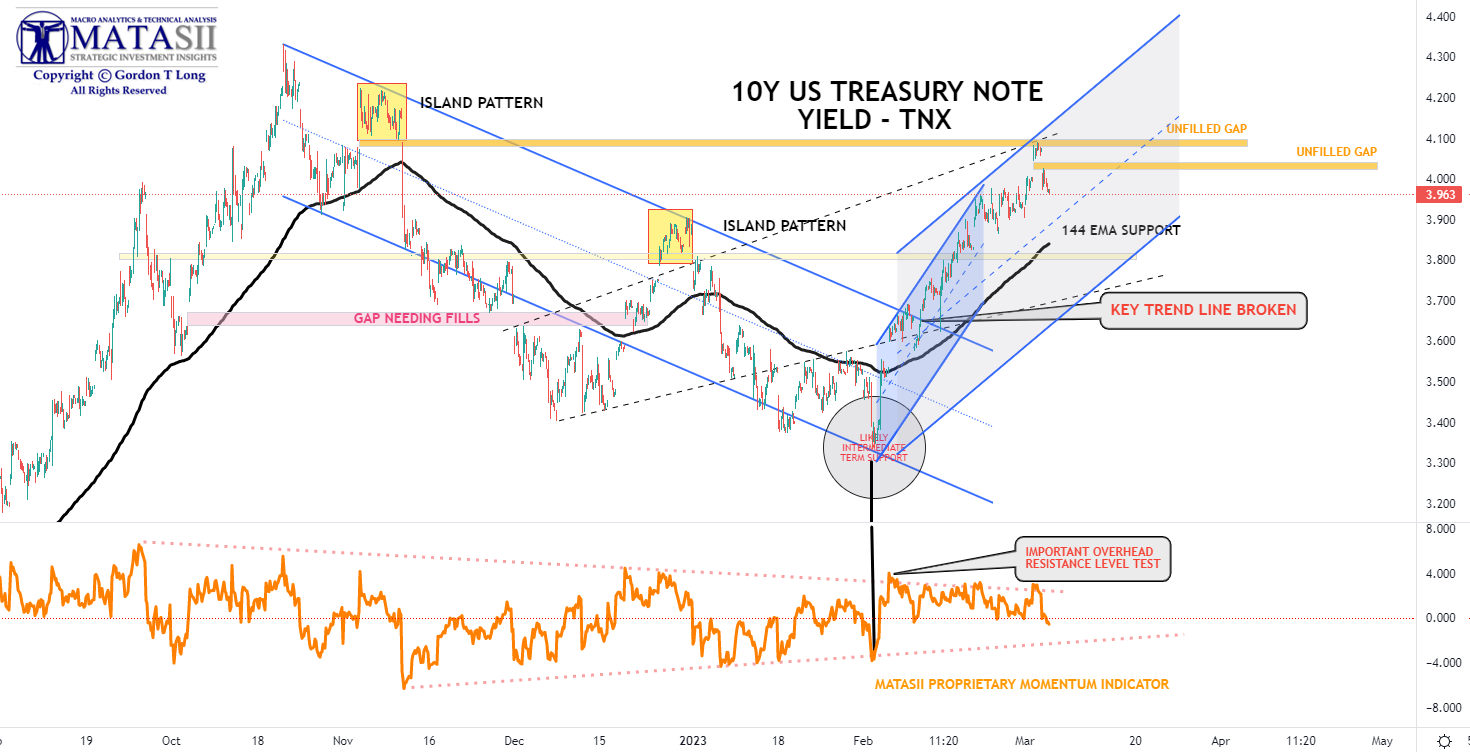
The following chart tells us where to expect near term support and critical tests. Study the above and below charts together for an insight of what bond volatility might be telling us.
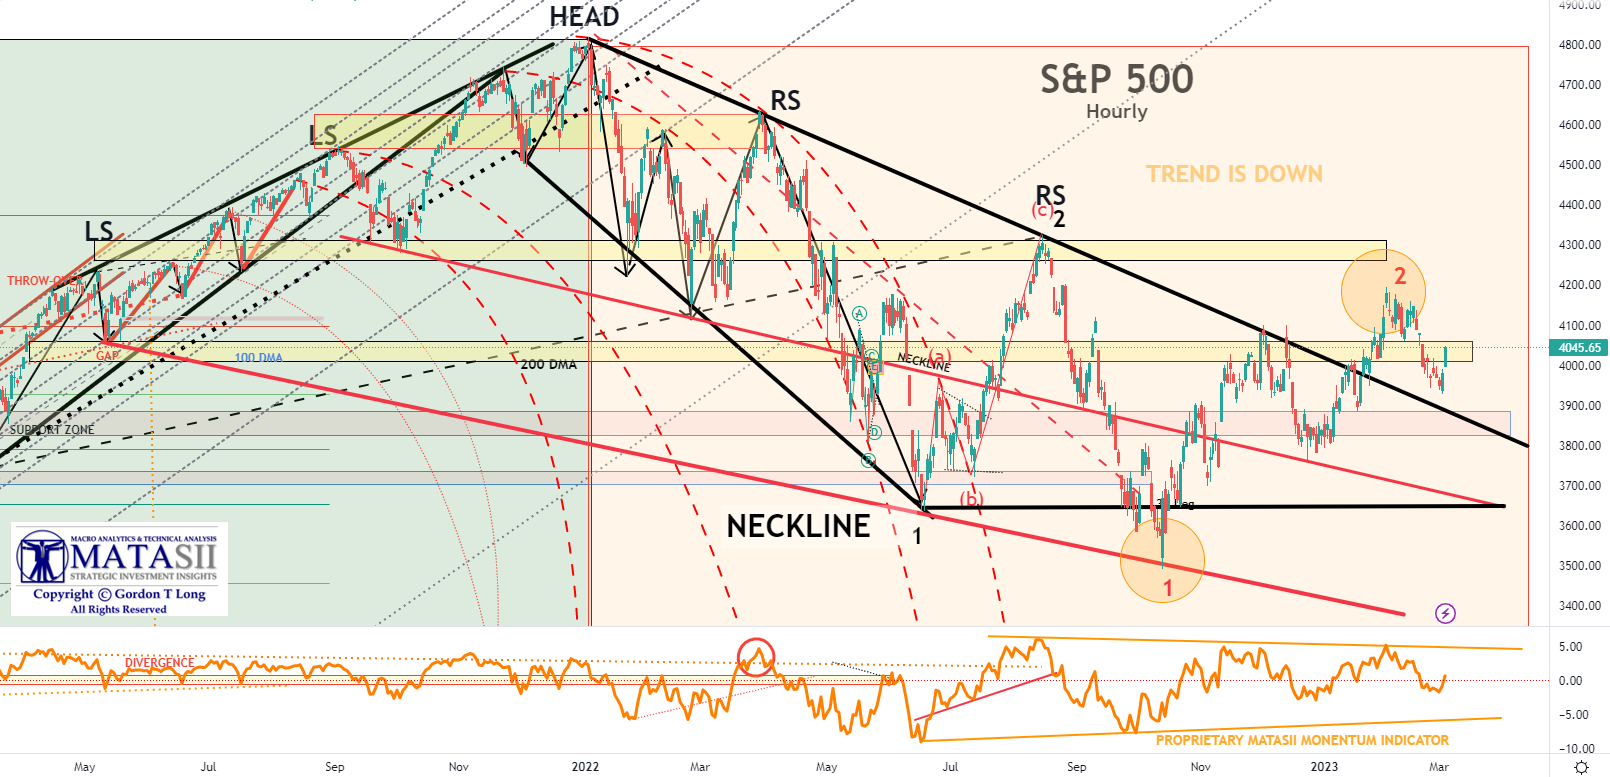
YOUR DESK TOP / TABLET / PHONE ANNOTATED CHART
Macro Analytics Chart Above: SUBSCRIBER LINK
TERM PREMIUMS BEGINNING TO BE PRICED IN
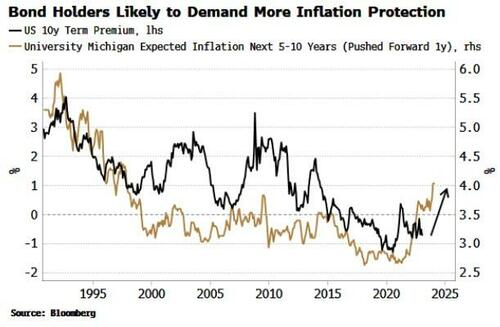
 Bondholders are now demanding more compensation for inflation that is becoming increasingly ingrained. It is no longer considered “Transitory”, though still falsely believing it will return to the Fed’s 2% target. Investors see a structural change has occurred, which will mean bonds must reflect this risk. Risk also must be priced in for increasing bond volatility (see the MOVE Index).
This is something we have been warning about since early 2022 and highlighted in this year’s Thesis paper with the chart to the right.
DURATION TERM RISK PREMIA CAN BE EXPECTED TO RISE.
As Simon White, Macro Strategist at Bloomberg reports:
At the core of the MOVE Index volatility is the volatility being experienced through uncertainty regarding inflation expectations. We have witnessed daily rises in the top 0.5% of all daily moves going back to 1960.
If bond holders are worrying inflation is becoming embedded then we should expect:
-
- Most immediately, yields would be biased structurally higher,
- Yields would likely decline less when the Fed cuts rates,
- This would lower the control the central bank have over longer-term borrowing costs.
This was the invidious position in which Volcker found himself in the early 1980s. The Fed at that point had “imperfect credibility”: when it hiked rates, the market did not believe it would keep them there. Instead, it was forced to cut them again when the ensuing recession hit. This meant inflation persisting, term premium rising, and the yield curve steepening – even as the Fed was hiking rates aggressively. It was only when Volcker raised rates to 20% in 1981 – despite a deep recession – that the deadlock was finally broken and inflation began to fall. Nonetheless, term premium did not peak until three years later as the market remained wary the inflation beast had not been decisively floored. Once bond markets scent inflation, it takes years before they become desensitized to it.
-
- Rising term premium also risks a self-reinforcing feedback loop.
- When it is increasing, the yield curve has a steepening bias, and steeper yield curves go hand-in-hand with higher rate volatility.
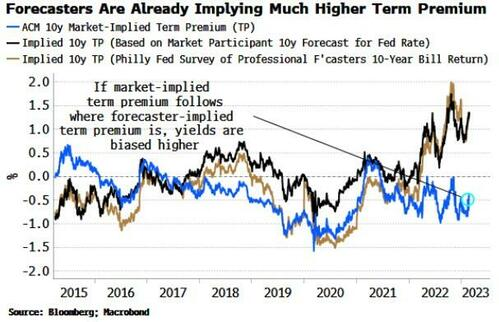
This is because longer-term forward yields must converge to shorter-term yields. The steeper the yield curve, the more paths yields can take to converge, which means higher yield volatility. Higher volatility means bond holders demand a higher yield to compensate, i.e. term premium rises. Avoiding a rise in term premium is thus highly desirable. But the cat may already be out of the bag. Term premium looks to be catching up to the much higher level currently implied by forecasters.
 There is no binding constraint that the forecasters’ view need be correct, but inflation is a social and behavioral phenomenon as much as an economic one. At some point, inflation expectations become self-fulfilling and drive inflation itself. An emerging narrative that inflation is becoming persistent adds to the likelihood that that is what we will soon see.
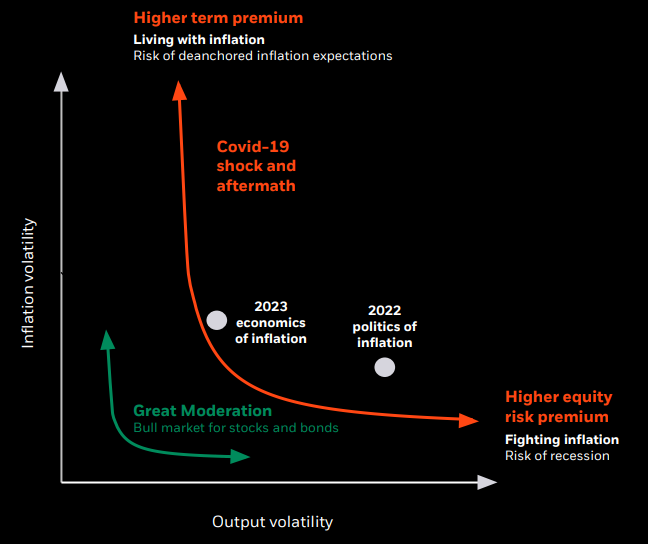
ONCE INFLATION GETS OUT OF THE BOTTLE IT IS NEARLY IMPOSSIBLE TO GET IT BACK IN!
Inflation expectations are already rising at the fastest rate in decades. As Simon White’s chart to the right shows, this adds further confidence to the notion that term premium will keep rising. A structural, term-premium driven rise in yields could take years to reverse as hitherto dormant bond vigilantes become conditioned to a world where inflation is persistently elevated and prone to sudden flare-ups.
CONCLUSION
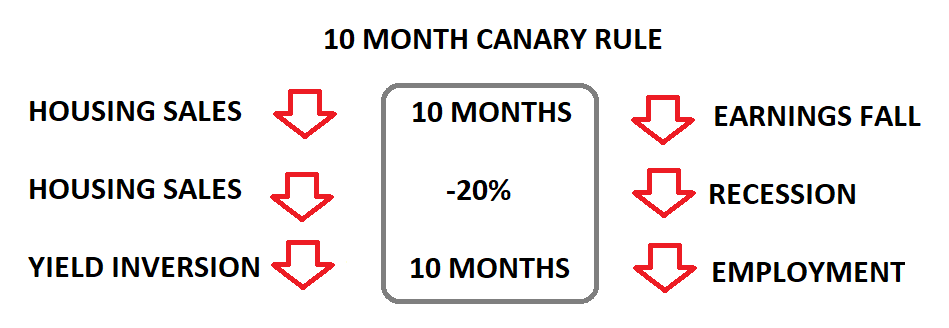 As we discussed in our last newsletter on the “10 Month Canary Rule” we have strong evidence that we are approaching a likely recession. The Fed can be expected to push rates as much as possible prior to this to give it the needed room to then drop rates substantially. This would hopefully deliver the impact required for the market response to dampen the full recessionary blow.
With interest rates now at levels that many investment professionals have not seen in their young careers, the timing is right for money to quickly shift towards safer, less volatile and an increasingly more attractive alternative of Money Market Assets (see Current Market Perspective section).
As the first chart below illustrates, low rates have distorted the Equity/Money Market Asset Ratios since the advent of the initial Quantitative Easing program. Prior to this change in Monetary Policy, the ratio collapsed when approaching the dotted red resistance line. This occurred during the Dotcom Bubble high and the pre-2008 Financial Crisis high. it seems highly likely that we should soon expect the dotted red level to soon be both tested and broken.
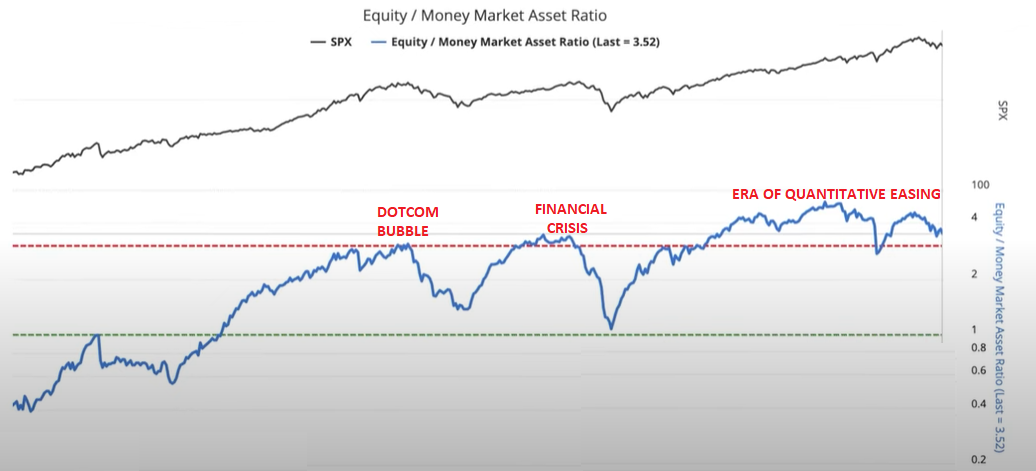
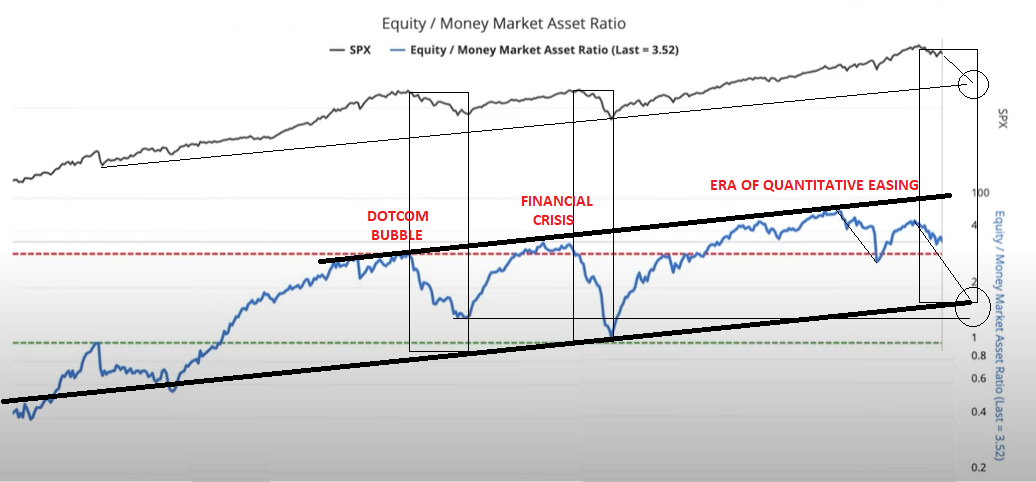
A CRITICAL TIPPING POINT APPROACHING
What once sustained the equity markets is significantly dissipating:
-
- Corporate Stock Buybacks are weakening: LINK,
- Holding Cash is now a solid risk alternative: CHART,
- Federal Reserve Liquidity continues to shrink at $90B / Month through QT,
- Insider Buying is weakening: LINK Corporate Insider-Buyers’ Strike Accelerated In February,
- Passive ETF Buying through 401K, IRAs is slowing.
There is an increasing willingness from Equities investors to sit in Cash, or even playing tourist in short-duration IG Credits. High quality instruments that isn’t likely going away or exposed to unseen counter-party risks.
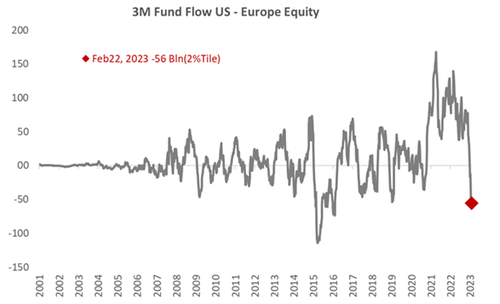 Cash is King as fund flows a shift from equities in the US and EU to short term yield instruments (3 Month) instruments. Net flows into global equity funds remained negative in the week ending March 1st, (-$7bn vs -$7bn in the previous week), driven by outflows from US equity funds, which have remained negative for four consecutive weeks. Flows into global fixed income funds accelerated (+$8bn vs +$5bn in the previous week) on stronger inflows into government bond funds and IG credit, which had seen more mixed flows in recent weeks… and who can blame them for rotating.
2Y Treasury Yields are now significantly higher than weakening S&P Dividend Yields.
 The Global Yield Benchmark has violently surged back towards the 4% level. The 10Y UST is reflective of increasing pressures on interest rates making them attractive global investors seeking yield.
With Treasury yields outstripping S&P 500 Dividend yields, money is increasingly leaking out of global equities. If rates keeping rising and equity earnings forecasts weaken, a leak will soon turn into a flood. It could be the trigger of a market capitulation.
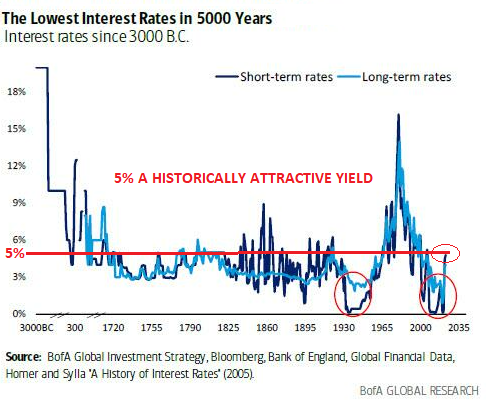 5% A HISTORICALLY ATTRACTIVE YIELD
1 YEAR T-BILL: 5.032%
2 YEAR NOTE: 4.859%
5 YEAR BOND: 4.247%
10 YEAR BOND: 3.886%
30 YEAR BOND: 3.878%
Equity / Money Market Asset Ratio Is likely to fall significantly if yields stay even close to 3%
YOUR DESK TOP / TABLET / PHONE ANNOTATED CHART
Macro Analytics Chart Above: SUBSCRIBER LINK
FAIR USE NOTICE This site contains copyrighted material the use of which has not always been specifically authorized by the copyright owner. We are making such material available in our efforts to advance understanding of environmental, political, human rights, economic, democracy, scientific, and social justice issues, etc. We believe this constitutes a ‘fair use’ of any such copyrighted material as provided for in section 107 of the US Copyright Law. In accordance with Title 17 U.S.C. Section 107, the material on this site is distributed without profit to those who have expressed a prior interest in receiving the included information for research and educational purposes. If you wish to use copyrighted material from this site for purposes of your own that go beyond ‘fair use’, you must obtain permission from the copyright owner.
NOTICE Information on these pages contains forward-looking statements that involve risks and uncertainties. Markets and instruments profiled on this page are for informational purposes only and should not in any way come across as a recommendation to buy or sell in these assets. You should do your own thorough research before making any investment decisions. MATASII.com does not in any way guarantee that this information is free from mistakes, errors, or material misstatements. It also does not guarantee that this information is of a timely nature. Investing in Open Markets involves a great deal of risk, including the loss of all or a portion of your investment, as well as emotional distress. All risks, losses and costs associated with investing, including total loss of principal, are your responsibility.