A RISK-ON -- RISK-OFF INDICATOR TO WATCH
The FAANGS and major Tech stocks have been a strong driver of the markets since the 2008 Financial Crisis. They are included in most market index ETFs and therefore they normally take the market with them when they move.
Recently they have shown relative weakness and when they do the markets mirror them.
What we have noticed is often these tech stocks will move slightly before the overall market follows. This gives us a slight trading advantage if we can spot it early enough. Minimally, an opportunity to consider applying a hedge.
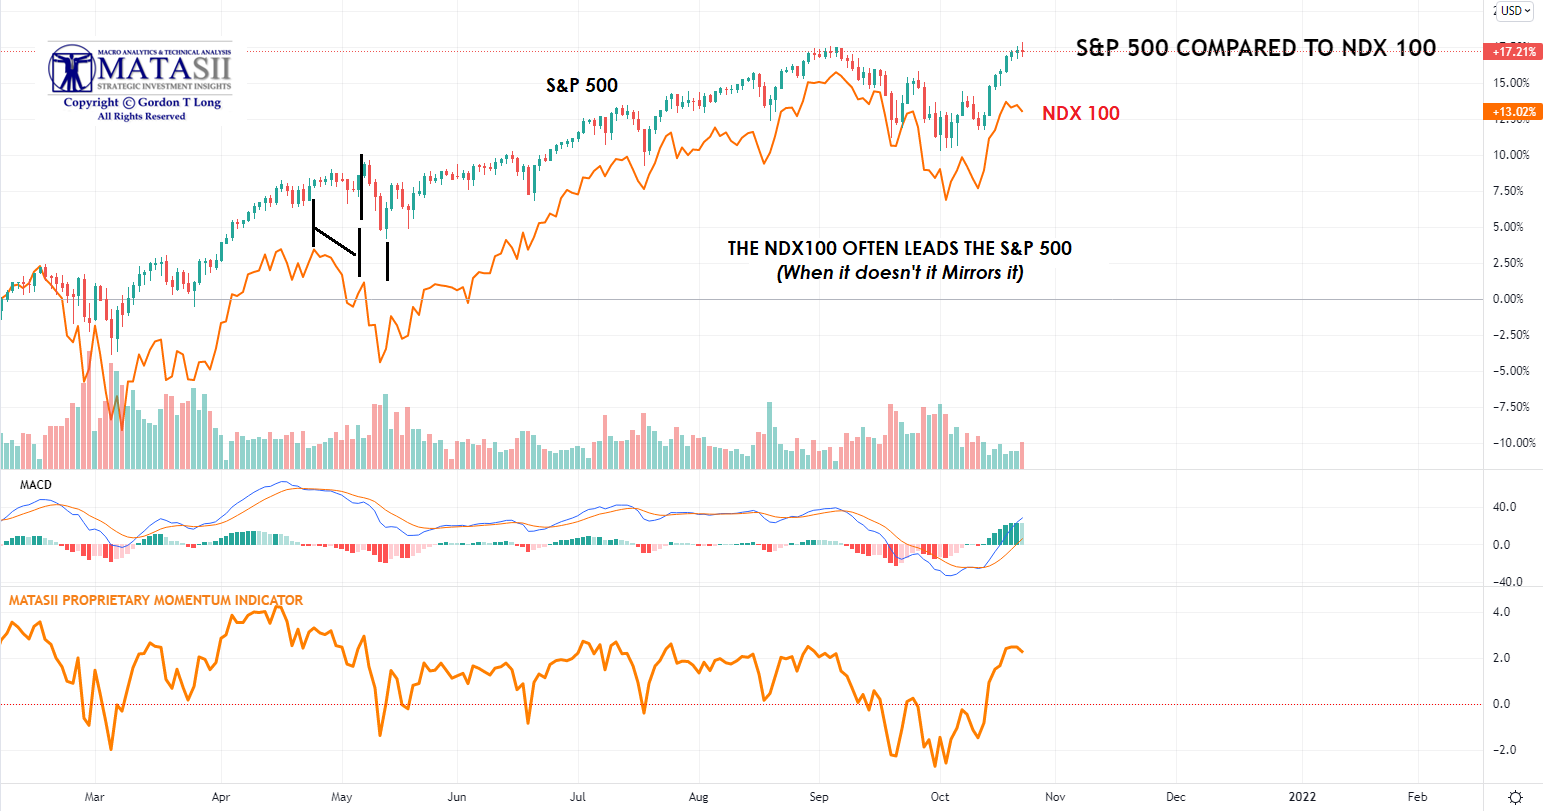
S&P 500 COMPARED TO NDX 100
In this chart we compare the NDX 100 price movement to the NDX 100. Generally we see that the S&P 500 mirrors the NDX 100 quite closely. However, we have marked up (with vertical bars) an example of where the NDX gave a clear signal prior to the significant May 7th drop in the overall market. We have noticed this occurring more frequently as the "rose has come off" the tech stocks and the market appears more worried and fragile.
We have also noticed the MATASII proprietary Momentum indicator (bottom panel) identifies this deviation quite quickly! When used in conjunction with the MACD (also in a lower panel) it is quite useful.
Here is your subscriber link to this chart set-up
https://www.tradingview.com/chart/YbvmWp9l/
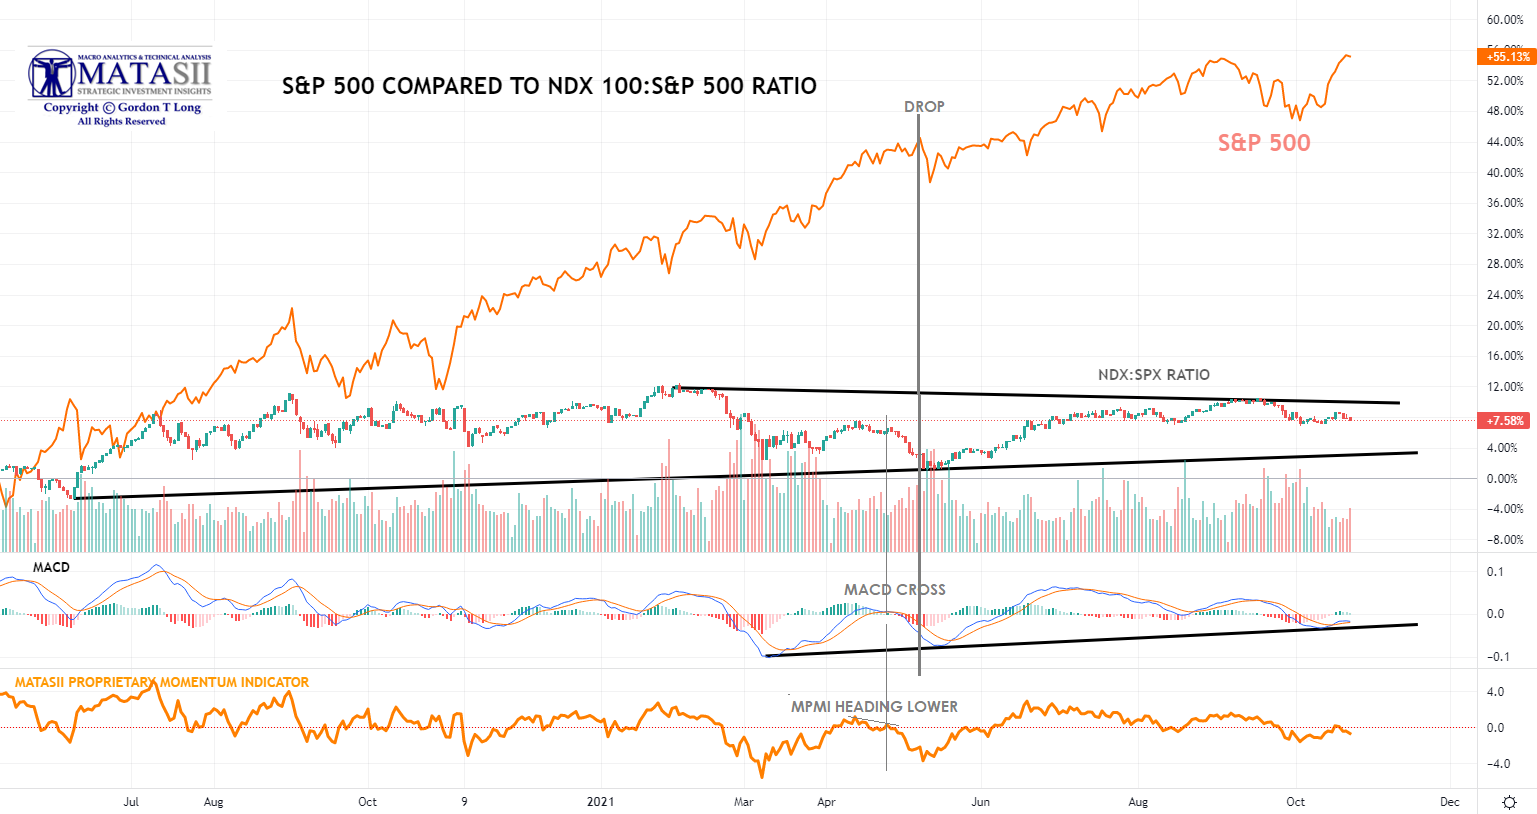
S&P 500 COMPARED TO NDX 100: S&P 500 RATIO
In this chart we compare the S&P 500 to the ratio of the DNX100 and S&P 500 and importantly use our indicator signals based on the ratio versus the S&P 500 (bottom panels).
You immediately notice how even though the S&P 500 has not dropped both our MATASII Proprietary Momentum Indicator (MPMI) and the MACD Cross indicator are warning of coming weakness in the S&P 500 Index.
Here is your subscriber link to this chart set-up
https://www.tradingview.com/chart/vUXE6CmF/
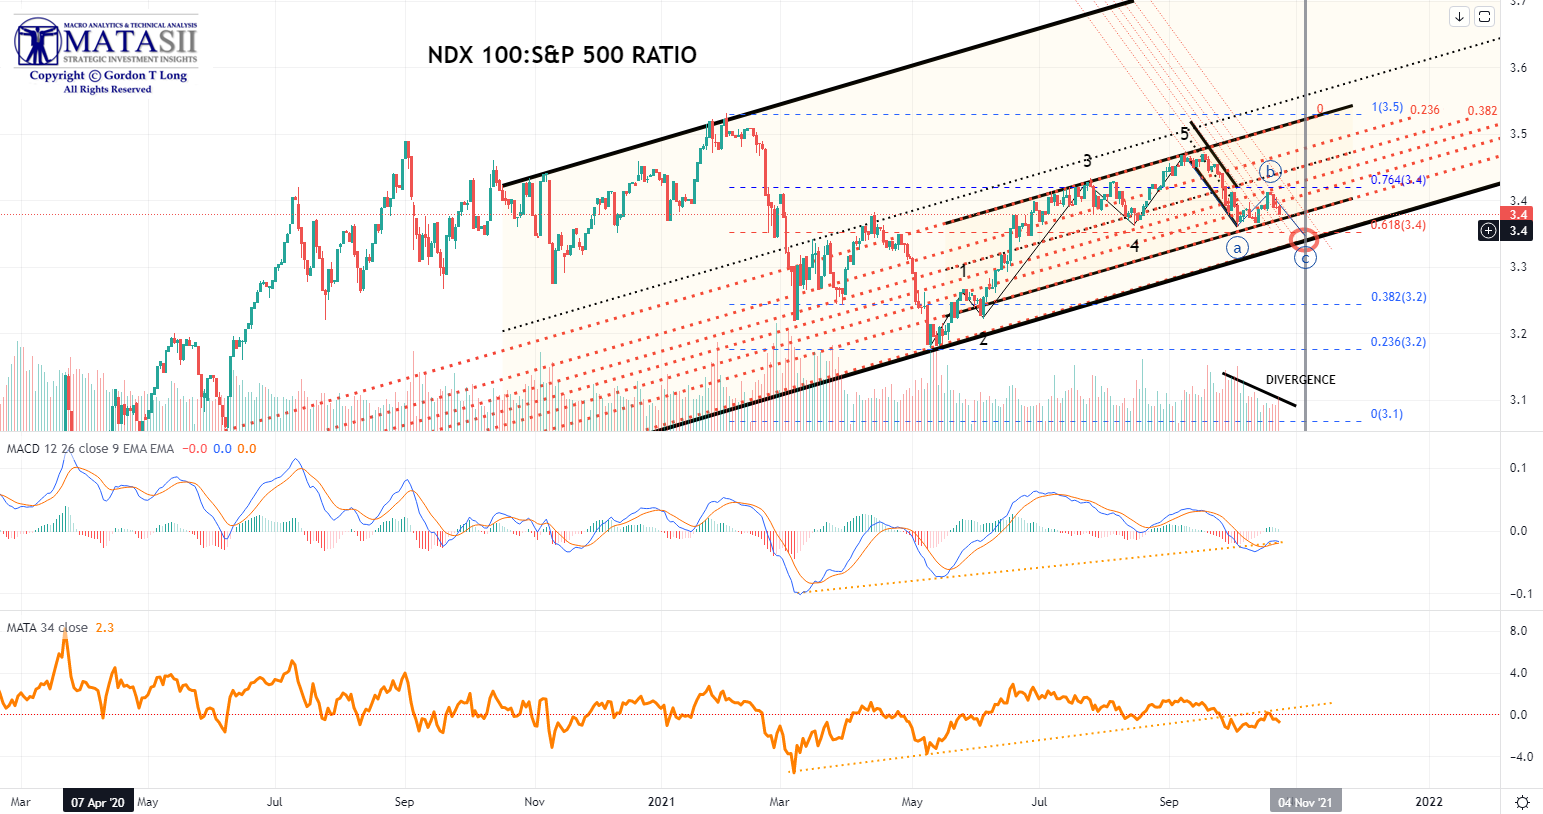
TECHNICAL ANALYSIS OF BDX 100: S&P 500 RATIO
In this chart we explode the NDX:SPX Ratio with Technical Analysis above our important indicators which are based on the ratio.
We have a clear warning from the indicators of a drop in the ratio plus targets from the ratio itself. The ratio targets are based on multiple Fibonacci Ratios on various planes, Fibonacci extensions, Parallel Channels and Elliott Wave counts. None of this in itself gives us a specific S&P 500 target but does give us a directional warning and a Short Term RISK-OFF Signal!
Here is your subscriber link to this chart set-up
https://www.tradingview.com/chart/L5uTDA2e/