WHAT JUST HAPPENED??
The dust began to settle last week after the prior week’s key events, which included; an FOMC Meeting shift, an important Quadruple Witch & an historic trillion dollar GAMMA adjustment. Fortunately the fallout has left important road signs to potentially guide us.
A PIVOT, SUPPLY & LIQUIDITY MAY POINT THE WAY.
How we were shown:
- US DOLLAR: Is being prepared for a likely US dollar sacrifice.
- YIELD CURVE: A noticeable flattening of the Yield Curve
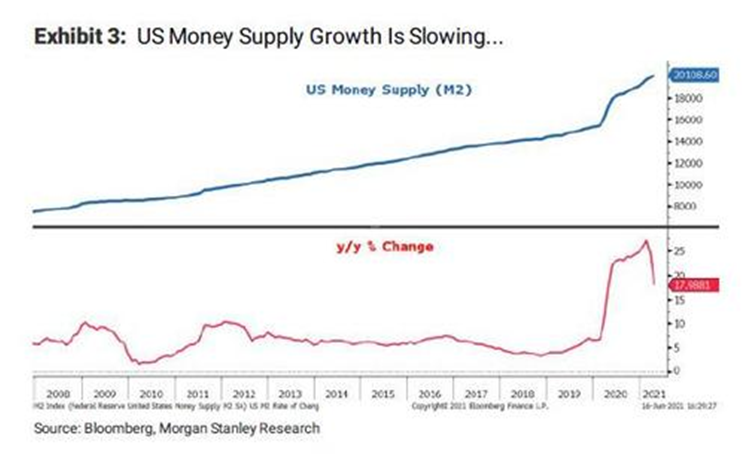
- S&P 500: The rate of change Y-o-Y of Money Supply becoming an important concern.
 Let’s examine each below: Let’s examine each below:
1- US DOLLAR
THE FOMC PIVOT
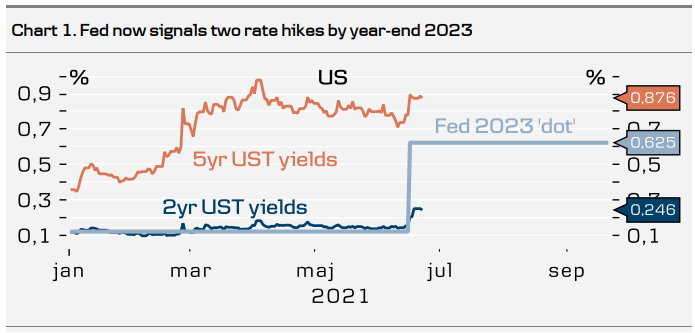
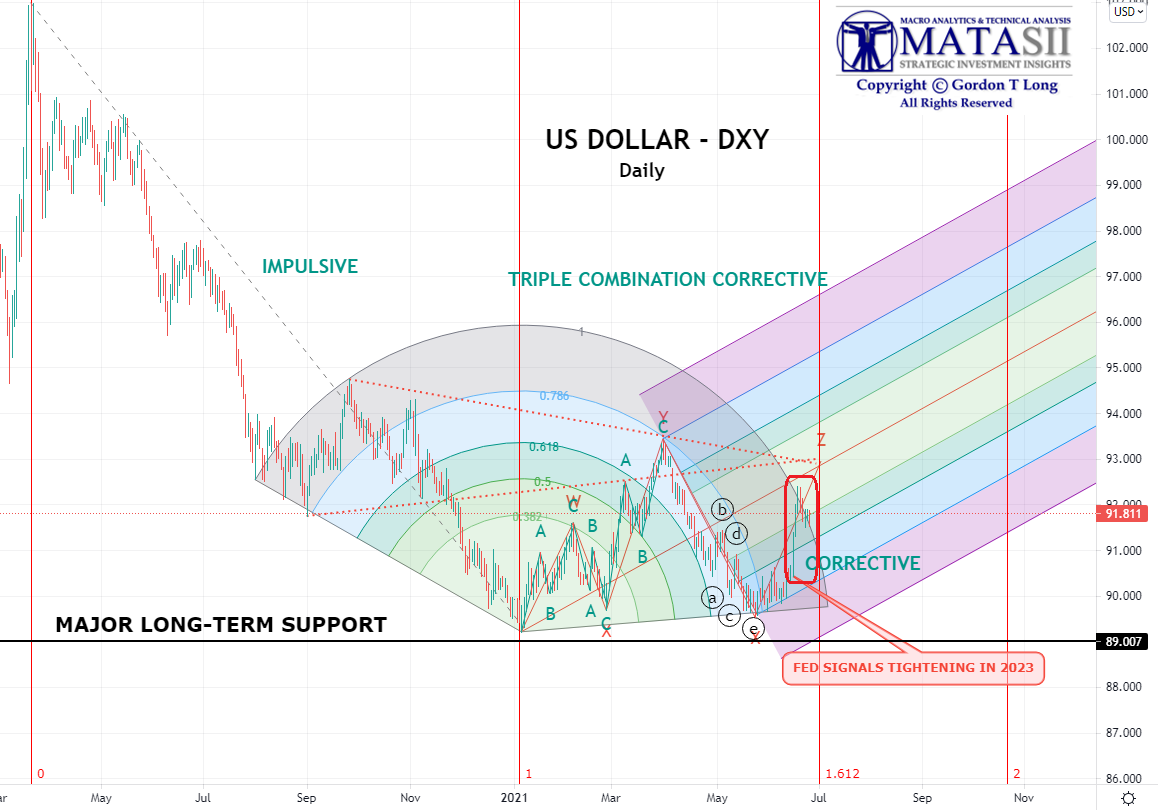
The June 16th FOMC meeting was “tepidly hawkish” with the signal being two rate increases beginning in 2023. Ironically, the dot plot reveals that FOMC participants project a pace of 3-4 hikes a year after the first hike, even though the market currently expects just ~2.1 hikes in the first 12 months after the first rate hike.
We suspect this was all part of an attempt to put some additional buffer in the US Dollar before Yield Curve Control (YCC) is officially announced, when rates will be forced down, thereby sacrificing the US Dollar. There are concerns that too big a potential lowering of the US Dollar could push import cost inflation, due to the fact that the 70% US consumption economy has become totally dependent on import consumer goods.
|
|
|
 2- BOND YIELDS 2- BOND YIELDS
SUPPLY CONTROL
YELLEN’S TGA GAMESMANSHIP
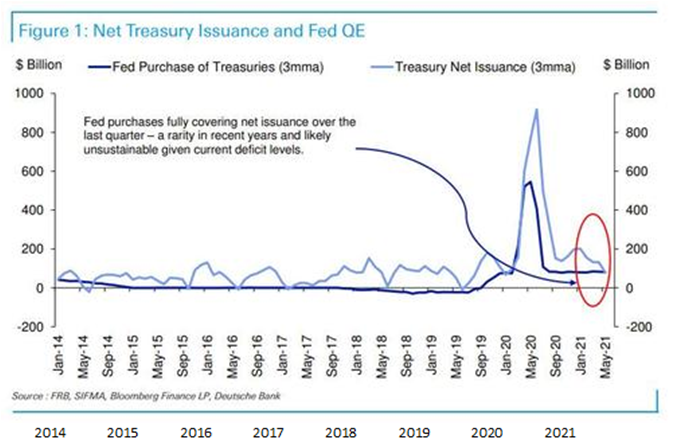
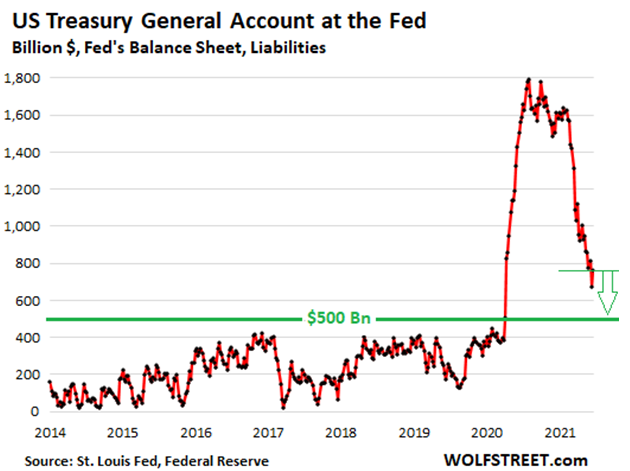
The US Treasury’s Net Debt issuance has intentionally collapsed over the last 2-3 months as Secretary Yellen dramatically reduced the Treasury’s General Account (TGA) cash stockpile in anticipation of the debt ceiling deferral expiring on August 1st.
The current 3-month moving average at $77Bn is the lowest since just before the pandemic and also around a third of the level seen in January this year. This effectively achieved two goals:
- Dramatic reduction of Treasury Supply, thereby increasing upward pressure on Treasury prices and a reduction in yields.
- Placing pressure on Congress to extend the debt ceiling moratorium and allowing massive Democratic spending initiatives to become law.
|
|
|
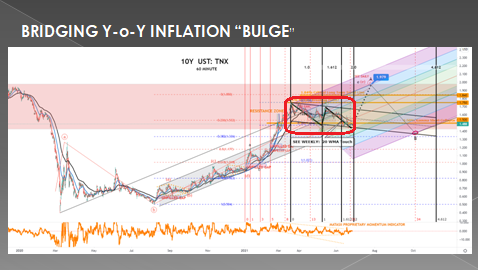
The Fed purchases (shown above) have fully covered net issuance over the last quarter. This was a rarity in recent years and though likely unsustainable (given current deficit levels), it has achieved an important goal. It has held down treasury yields during the anticipated and problematic inflation of Y-o-Y comparisons with the pandemic’s recessionary pressures in inflation. The chart of the 10Y UST Note Yield below highlights the significance of this 3 month period (red box below), which took pressure off previous exploding higher yields.
|
|
|
3- S&P 500
LIQUIDITY: IT’S ABOUT THE 2nd DERIVATIVE STUPID!
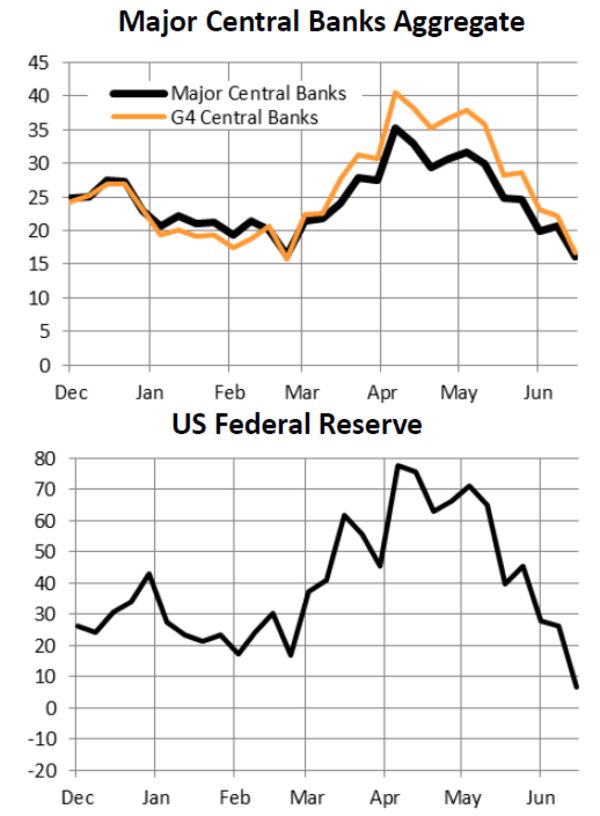
Crossborder Capital Ltd. of London keeps indexes of central bank liquidity growth globally. Their charts are shown to the right and indicate a global deceleration, which is most marked in the U.S. and which uncoincidentally peaked roughly when bond yields topped out in early April.
U.S. monetary base growth has plummeted to 7%, peaking at 78% only 10 weeks ago. It is driving a downturn in liquidity expansion. The ECB and Bank of England liquidity growth also peaked in April, but the downturn has been less pronounced. Meanwhile, the People’s Bank of China and now the Bank of Japan look to be moving in the opposite direction. If liquidity growth begins to fall, it implies problems for stocks.
For months, the market has been mired in more cash than it knows what to do with. The model used by Crossborder Capital suggests a risk that liquidity might leave too soon. The logic is that if there is a lot of money around, it has to go somewhere. If there are more liquid or safe assets in circulation, it isn’t unsafe for a proportion of them to go into stocks. But this theory is vulnerable not only to the numerator increasing (share prices going up), but also to the denominator decreasing, as money supply is reined in. When equity holdings reach prior peaks as a share of world liquid assets (below right), that is cause for concern about share prices. It happened earlier this month.
|
|
|
| |
|
The Y-o-Y percentage change in US M2 Money Supply growth is slowing.
|
|
|
|
|
Equity holdings reach prior peaks as a share of world liquid assets.
|
|
|
|
|
CONCLUSION
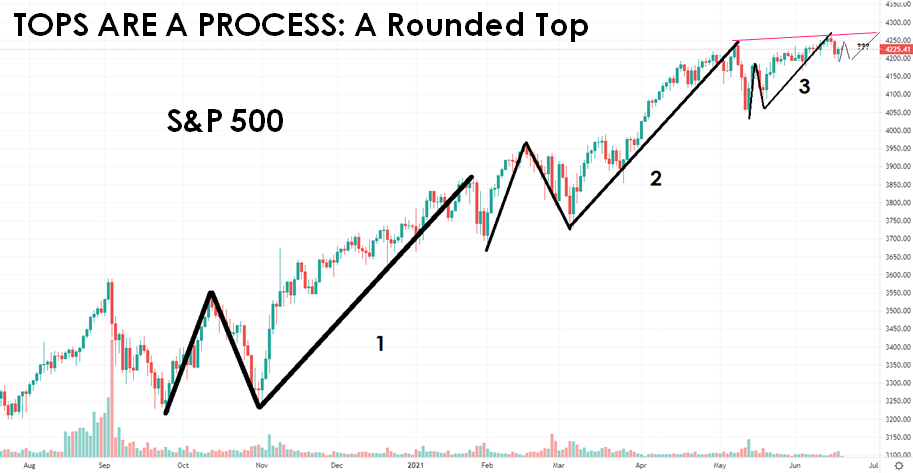
As the chart of the S&P 500 above suggests, the equity market may be reaching a point where a corrective consolidation is required before attempting to head higher.
YIELD CURVE
We started this newsletter with the question, “What Just Happened?”. What has been left out so far is the Flattening of the Yield Curve.
The Treasury Yield Curve has flattened dramatically. The three-day flattening in the 5s30s curve after the meeting was a six standard deviation move. Breakeven inflation rates have fallen and real yields have risen. The market-implied timing of interest rate hikes has come forward by three months, with the Treasury market now pricing the first rate hike in December 2022.
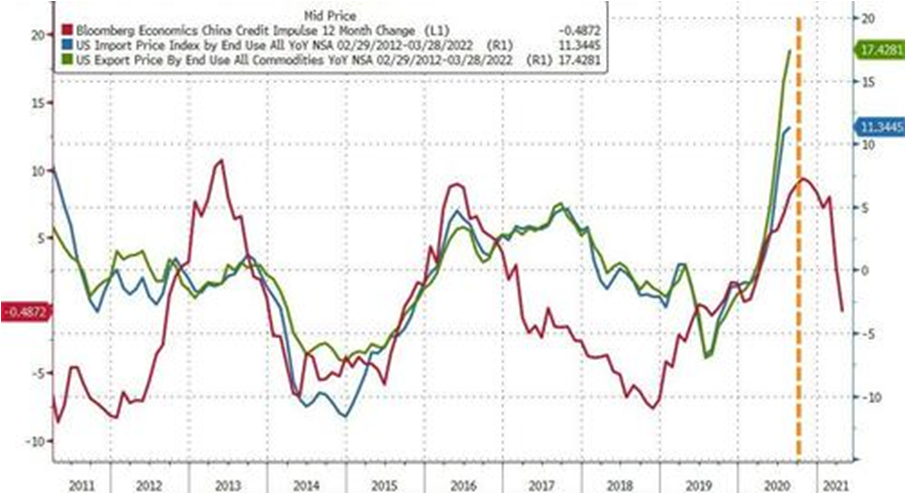
This is normally a signal of slowing future growth and a possible recession. A Double Dip Recession is not at all out of the range of possibilities. The Fed is aware of this and seeing the level of Import Inflation (top right) is surely not naive to what must be done. The markets normally are ahead of the Fed and force its hand.
|
|
|
|
SEE SECTION BELOW: CURRENT MARKET PERSPECTIVE
Yield Curves are rolling over!
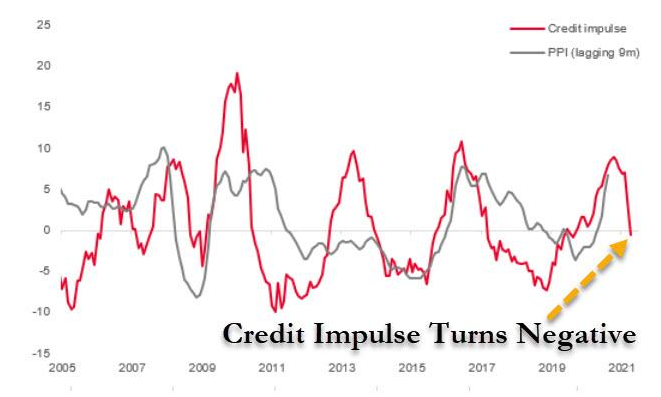
The Chinese Credit Impulse (above right) is also warning of coming tightening credit. When we consider all this along with the fact that Import Inflation is at extreme levels (top right), we can see how the Fed is likely preparing for the inevitable reality of YCC to reduce interest rates and with it a cyclical fall in the US dollar. We highlighted this in July’s UnderTheLens video.
As a result of the above the current beliefs are for the FOMC to discuss tapering in July in order to provide forward guidance at the September meeting, with a formal announcement of tapering in March 2022 and first rate hike in 3Q23. Here is what the Fed is telling Congress:
“Inflation has increased notably in recent months. This reflects, in part, the very low readings from early in the pandemic falling out of the calculation; the pass-through of past increases in oil prices to consumer energy prices; the rebound in spending as the economy continues to reopen; and the exacerbating factor of supply bottlenecks, which have limited how quickly production in some sectors can respond in the near term. As these transitory supply effects abate, inflation is expected to drop back toward our longer-run goal.”
Jerome Powell, Chairman of the Fed: Congressional Testimony
|
|

 Let’s examine each below:
 2- BOND YIELDS