Gordon T Long

Gordon T Long

Global Macro Research | Macro-Technical Analysis 

MATA

DRIVERS: INFLATION


THE PROBLEM IS MOST INFLATION IS REAL ‘STICKY’!

I have spent years analyzing the nuances of Inflation, Disinflation, Deflation et al. and yet I still learn more with each cycle. In my analysis I have come to trust some data sources more than others. I thought in this newsletter I would share some of the thinking of others more than I normally do. Why? This is a confusing time and the more perspectives, the better my chance of getting it right … or as close to right as possible in this investing game!

BOTTOM LINE OF MY READINGS THIS WEEK:
 
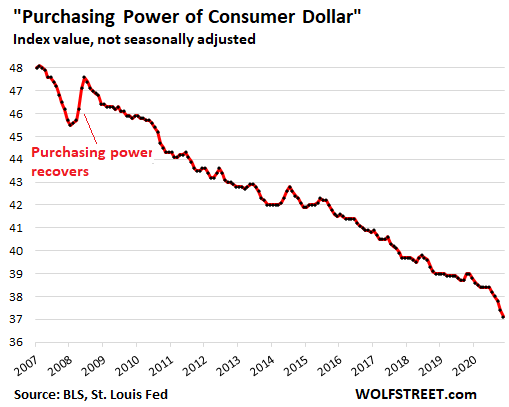
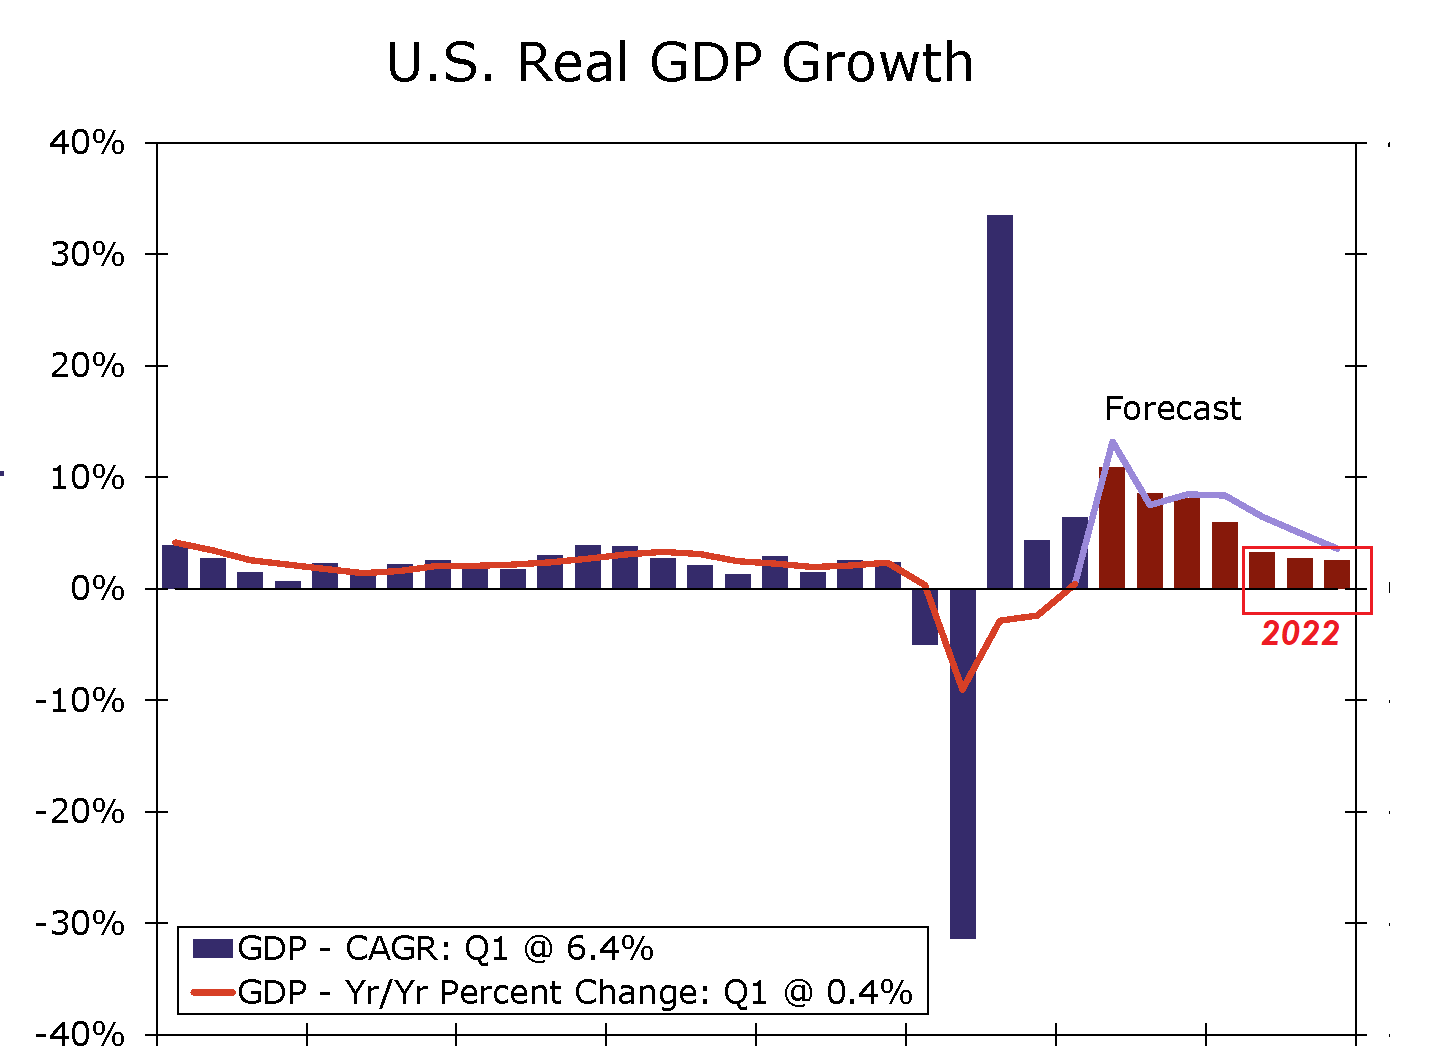
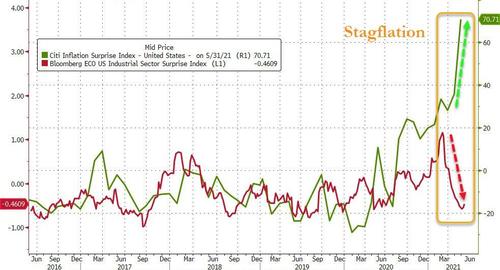
We are facing a serious erosion of our Purchasing Power (continued lowering of Standard of Living) as well as Economic Stagnation now becoming “baked in” to the outlook for 2022!
 
A REGIME SHIFT??
 
The big question is if the political crisis response to the pandemic will now lead us towards a marked regime shift or not. A crisis environment is the only environment that allows for changes to the policy mix that are large enough to potentially define a new era. Currently my readings suggest:
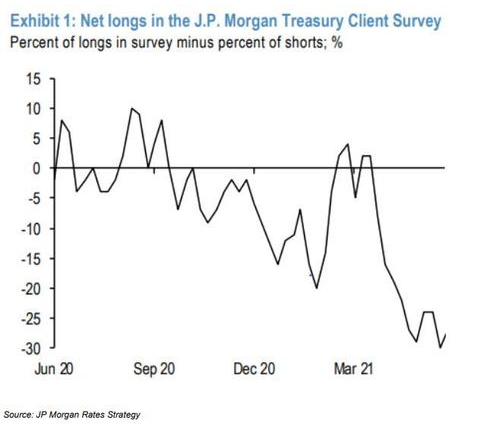
    1. Everyone and their mother is positioned for a massive inflation spike this summer already and
    2. No one dares to genuinely think that we have entered a sustained level shift in inflation rates over the coming decade.
Most people still lick their decade long wounds of trying to predict or bet on sustained higher inflation. Few economists ever got it right, one way or the other!
 
There are two types of recency bias in play in this inflation debate:
    • First, there is clearly a recency bias in inflation expectations – why markets are already positioned for higher inflation. That is the only way you can explain how important oil is for inflation expectations over the coming 10 years.
    • Second, there is a recency bias in the way the crisis response is calibrated. The most recent crisis in 2008/2009 was a material demand shock. This is why everyone currently suggests treating the pandemic as a demand shock, which it is most likely not. Bringing truckloads of fiscal fuel to the fire during a supply shock risks creating bizarre bottlenecks, such as the ones we are experiencing right now.
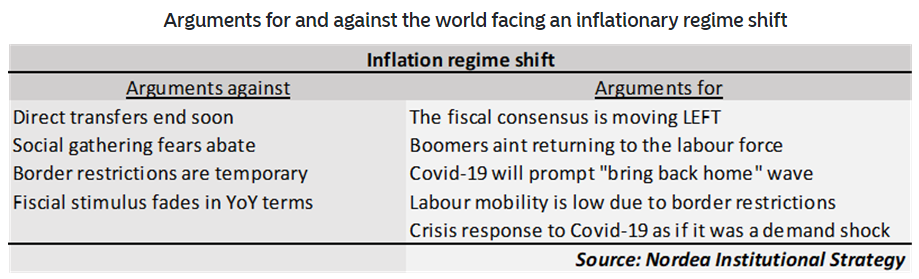
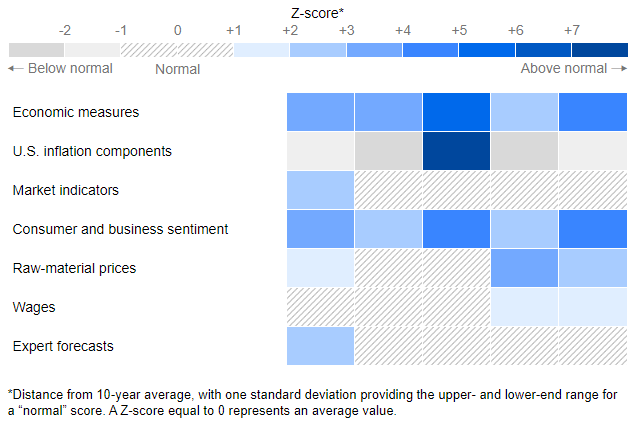
The Swedish Bank Nordea summarized the pros and cons of the inflationary regime shift debate in the table below. It finds more arguments in favor of a regime shift than against, not least due to the consensus moving leftwards fast on fiscal stimulus. This is a potential game-changer when it is happening amidst a supply shock crisis!
 
 
ANALYSTS ARE ONLY PARTIALLY BUYING THE FED’S NARRATIVE
 
The survey findings to the right from JP Morgan Treasury clients illustrates how strongly everyone believes Treasury Yields are headed higher. Was it any wonder the Fed had it so easy to trigger a short squeeze over the last couple of weeks?
 
But it isn’t just clients, it is financial institutions overall. Many seem to echo the findings of just two of the economic teams I follow.
 
The Danish Danske Bank(chart to the right) has concluded that:
    • PCE core goods inflation is likely to remain high for now. A stronger USD and lower goods demand should slow PCE core goods inflation in 2022.
    • PCE core services excluding housing and health care inflation, in the long-run, is mostly driven by inflation expectations. The current level of long-term inflation expectations suggest PCE core services excluding housing and health care inflation will run around 2.5-3.0% y/y.
    • Rents have started to increase sharply after the slowdown in 2020 and early 2021. We expect higher rent inflation near-term but since we expect house price increases will slow down somewhat, we expect rent inflation will settle at around 3.5% y/y.
    • Wage growth is important for PCE health care inflation. If wage growth increases due to higher inflation expectations we are likely to see higher PCE health care inflation also further out. We expect PCE health care inflation to run around 3% y/y.
    • PCE inflation will be 3.3% Y-o-Y this year and 2.5% Y-o-Y next year.
    • PCE core inflation will be 2.8% Y-o-Y this year and 2.6% Y-o-Y next year.
  •  
Meanwhile we see Wells Fargo Bank forecasting (see chart below) almost exactly the same inflation scenario:
    • PCE inflation will be 3.3% Y-o-Y this year and 2.7% Y-o-Y next year
    • PCE core inflation will be 2.8% Y-o-Y this year and 2.5% Y-o-Y next year.
It appears from my readings that analysts are buying the Fed narrative to a certain degree, but see inflation staying elevated relative to pre-pandemic Inflation levels.
 
 
10Y and 30Y UST YIELD CONSEQUENCES
 
Wells Fargo research concludes the Inflation outlook suggests Q4 2021 yields of 2.0% on the 10Y UST and 2.6% on the 30Y UST.
 
 
BLOOMBERG’S INFLATION WATCH
 
i found recent research by Bloomberg to be instructive. They isolated 35 Indices (5 each for the 7 categories shown to the right). Each Index is then given a Z-Score color as shown at the top of the chart. We define each level as a Standard Deviation of the 10Y average of that Index. 3-4 standard deviation is not unusual. I encourage you to read the details at LINK.
 
 
CONCLUSIONS
 
1- LOST PURCHASING POWER
 
IT IS NORMALLY PERMANENT!
 
The Purchasing Power of the US Consumer Dollar is in steady decline. Losses in Purchasing Power are not temporary nor transitory. They are normally never recovered!
 
2- STAGFLATION
 
Fed is holding rates at zero and buying $120 billion in bonds every month in the face of 17.4% export price inflation, 11.3% import price inflation, 6.6% producer price inflation, 5% consumer price inflation, over 15 million Americans on government dole, over 9 million job openings for Americans, record high stock prices, record low home buyer sentiment, banks are puking excess cash back to The Fed at record levels, and stagflation’s shadow is looming (see bottom right).
 
High Inflation and Slow Growth is the definition of the Stagflation Trap which is the central bankers’ nightmare!
 
KEY TAKEAWAYS
  • Based on our analysis, we project PCE inflation will be 3.3% y/y this year and 2.5% y/y next year (PCE core inflation: 2.8% y/y and 2.6% y/y), see chart above.
  • Inflation expectations suggest that inflation will be higher on a sustained basis compared to the years before the pandemic hit. A downside risk is that inflation expectations may decline when inflation peaks (all else equal).
  • Higher money velocity would be inflationary but we doubt that M2 money velocity will return all the way back to its pre-pandemic level, as some of the money is spent on transactions not included in GDP (like real estate transactions and transactions in financial assets), where we have already seen large price increases.
  • Some of the broad price increases may take time to materialize due to sticky prices.
 
  • We expect higher wage growth, reflecting both higher inflation expectations and higher demand for labor. This should support higher inflation on a more sustained basis. The Phillips curve relationship has been weak for several years, likely because inflation expectations have become well-anchored.
  • Rising food and commodity prices mean higher headline inflation and inflation expectations, as we do not expect the economy to enter a commodities super cycle,
  • We expect food and commodities price inflation to ease, which should also ease total headline inflation and all else equal pull inflation expectations lower.
  • PCE core goods inflation is likely to remain high for now. A stronger USD and lower goods demand should slow PCE core goods inflation in 2022.
  • PCE core services excluding housing and health care inflation is, in the long-run, mostly driven by inflation expectations. The current level of long-term inflation expectations suggest PCE core services, excluding housing and health care inflation, will run around 2.5-3.0% y/y.
  • Rents have started to increase sharply after the slowdown in 2020 and early 2021. We expect higher rent inflation near-term, but since we expect house price increases to slow down somewhat, we expect rent inflation will settle at around 3.5% y/y.
  • Wage growth is important for PCE health care inflation. If wage growth increases due to higher inflation expectations, we are likely to see higher PCE health care inflation also further out. We expect PCE health care inflation to run around 3% y/y.
 
NOTE TO EQUITY INVESTORS
 
As this month’s video spells out, Credit leads Bonds and Currencies, which lead the equity markets. So as not to get blindsided in the equity markets, you need to watch the other markets closely! There is also a consistent pattern where if the equity market is up, then either or both the 10Y UST (TNX) and US$ (DXY) are down with gold and silver up. Though you may not be interested in Bonds, the charts of the TNX below may save you some major losses!
 
“We have all seen what’s happened in previous taper tantrums, and you’ve seen 10-12% pullbacks in the market. Will that be healthy? It would probably scare some people but I do think that in the end that you can’t worry about the market’s every move because in real terms, we have negative real rates of more than 10% today, meaning you’re losing 10% of your purchasing power annually at the current moment. Negative real rates are pretty repressive. And when food prices start moving…that’s a huge regressive tax on the poor.”


FOLLOWING DETAILED ANALYSIS IS SUBSCRIBER CONTENT ONLY

Subscribe to view full post content with supporting live charts
 

FAIR USE NOTICE  This site contains copyrighted material the use of which has not always been specifically authorized by the copyright owner. We are making such material available in our efforts to advance understanding of environmental, political, human rights, economic, democracy, scientific, and social justice issues, etc. We believe this constitutes a ‘fair use’ of any such copyrighted material as provided for in section 107 of the US Copyright Law. In accordance with Title 17 U.S.C. Section 107, the material on this site is distributed without profit to those who have expressed a prior interest in receiving the included information for research and educational purposes.  If you wish to use copyrighted material from this site for purposes of your own that go beyond ‘fair use’, you must obtain permission from the copyright owner.


NOTICE  Information on these pages contains forward-looking statements that involve risks and uncertainties. Markets and instruments profiled on this page are for informational purposes only and should not in any way come across as a recommendation to buy or sell in these assets. You should do your own thorough research before making any investment decisions. MATASII.com does not in any way guarantee that this information is free from mistakes, errors, or material misstatements. It also does not guarantee that this information is of a timely nature. Investing in Open Markets involves a great deal of risk, including the loss of all or a portion of your investment, as well as emotional distress. All risks, losses and costs associated with investing, including total loss of principal, are your responsibility.